Technical Analysis Of The Markets


Current Position of the Market
SPX Long-term trend: There is some evidence that we are still in the bull market which started in 2009 and which could continue into 2021 until major cycles take over, and it ends. A move up to ~4500 is possible before the current bull market makes a final top and SPX corrects into its next major cycle low due in 2023.
SPX Intermediate trend: SPX correction underway.
Analysis of the short-term trend is done daily with the help of hourly charts. They are important adjuncts to the analysis of daily and weekly charts which determine longer market trends.
SPX Base Projection Reached – End of the Line?
Cycles: Looking ahead!
7-yr cycle – Last lows: 2009-2016. Next low: ~2023
Market Analysis (Charts, courtesy of StockCharts)
DJIA-NDX daily charts
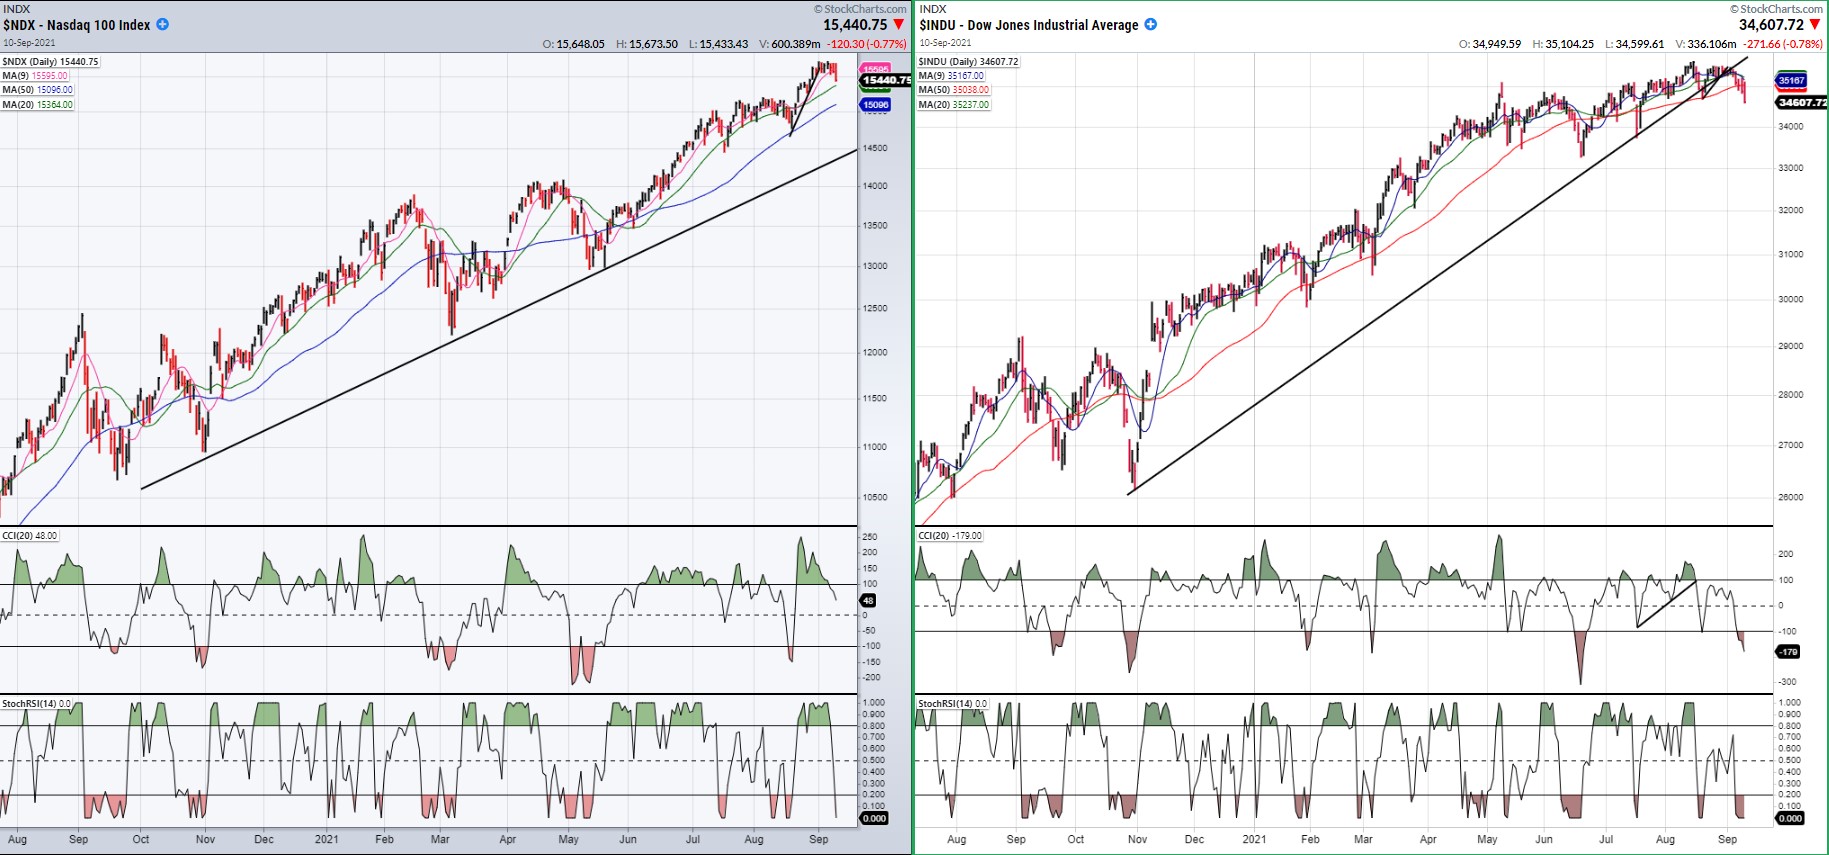
In last week’s newsletter, I pointed out the sharp contrast between the performance of the NDX and the DJIA starting about May 2021. While the DJIA appeared to be losing steam, the NDX has forged ahead, increasing its relative strength until this past week with NDX making a new high on Tuesday, while DJIA made its final high about a month earlier; although, when you compare the charts, you can see that price deceleration started much earlier in the Dow. And as I mentioned last week, the Dow might have peaked earlier if it had not been for Microsoft and APPL -- individual components that both primary indexes have in common.
The reason I picked the time period starting with the Fall of 2020 to compare these two charts is because this is when the first important consolidation/correction common to both indices occurred after the March 2020 low. It led to another year of bullishness, but the deceleration pattern which is currently evident in the DOW suggests that it could be starting something of a similar or greater import. It could even mean that the Dow has reached its bull market peak, ahead of the two others.
SPX daily chart
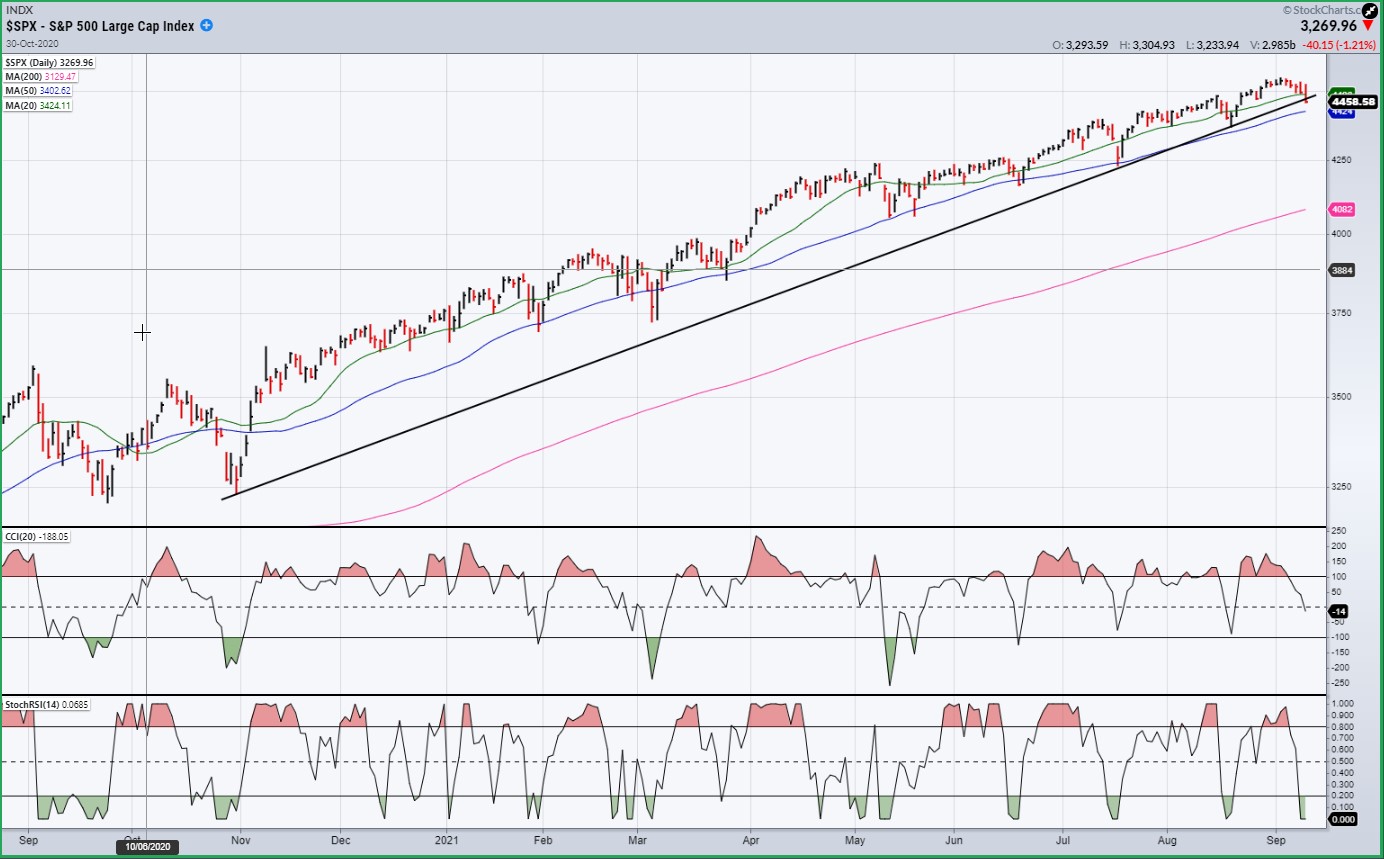
There is a short-term cycle which beats fairly regularly in all three indices, but which is more visible in the SPX. It has been particularly noticeable since May and on Friday, with a few more days ostensibly remaining in its normal phase, it closed below its 20-dma, something that it had reserved for the last two days of it phase since May. We could therefore conclude that it is about to have its biggest correction since that date. And, if the remaining weakness into the low of the cycle takes us below the last minor low which took place on August 19, at 4368, it would be the first time since March 2020 that a short-term correction exceeded the low of the previous one, and that could be a big deal since it could mean that we are witnessing the reversal of the bullish trend.
Of course, more than a minor break below 4368 would have to take place before we could be convinced that an important top was made at 4546, which was the high made by SPX on 9/2 (4585.45 to be exact) -- a figure amazingly close to the 4550 that had been forecast as a result of the formation made on the P&F chart at the March 2020 low, and a good enough reason to expect an important high to occur around this level. However, there has not been enough distribution – so far – at the recent top to do anything more than retest the 4368 low. So, if the current short-term cycle ends up bottoming at, or above 4368, we will have to see how much strength develops in the next phase of that cycle. And, if it cannot exceed the current high of 4585.45, then the bulls will have something to be concerned about because by the time that next cycle is ready to turn down, more distribution/congestion will have taken place on the P&F chart with a potential to project lower prices for the next decline.
For now, unless something changes drastically in the market action over the next week, such as a larger cycle over-riding the short-term one, it seems too early to expect an immediate protracted correction.
SPX hourly chart
This is a 60m chart of the current short-term cycle. After coming out of its up-trend channel on Thursday, it dropped below its top formation and closed on the low of the day, Friday. Unless there is an immediate reversal on Monday morning, we can assume that it is now in its down-phase and will continue to pressure prices until it makes its low in another week or so.
As I mentioned above, for now it is not expected to go below the level from which it started its uptrend; but even a retracement down to that low could be a sign that a larger correction, perhaps one of intermediate nature has started. This would be confirmed if the next short-term cycle is not capable of overcoming the high (4546) established by the current one.
We know that it’s only a matter of time before the 7-year cycle (whose low is due in 2023) puts a lid on the current uptrend. The clue to when this will take place could come from monitoring the performance of the short-term cycle.

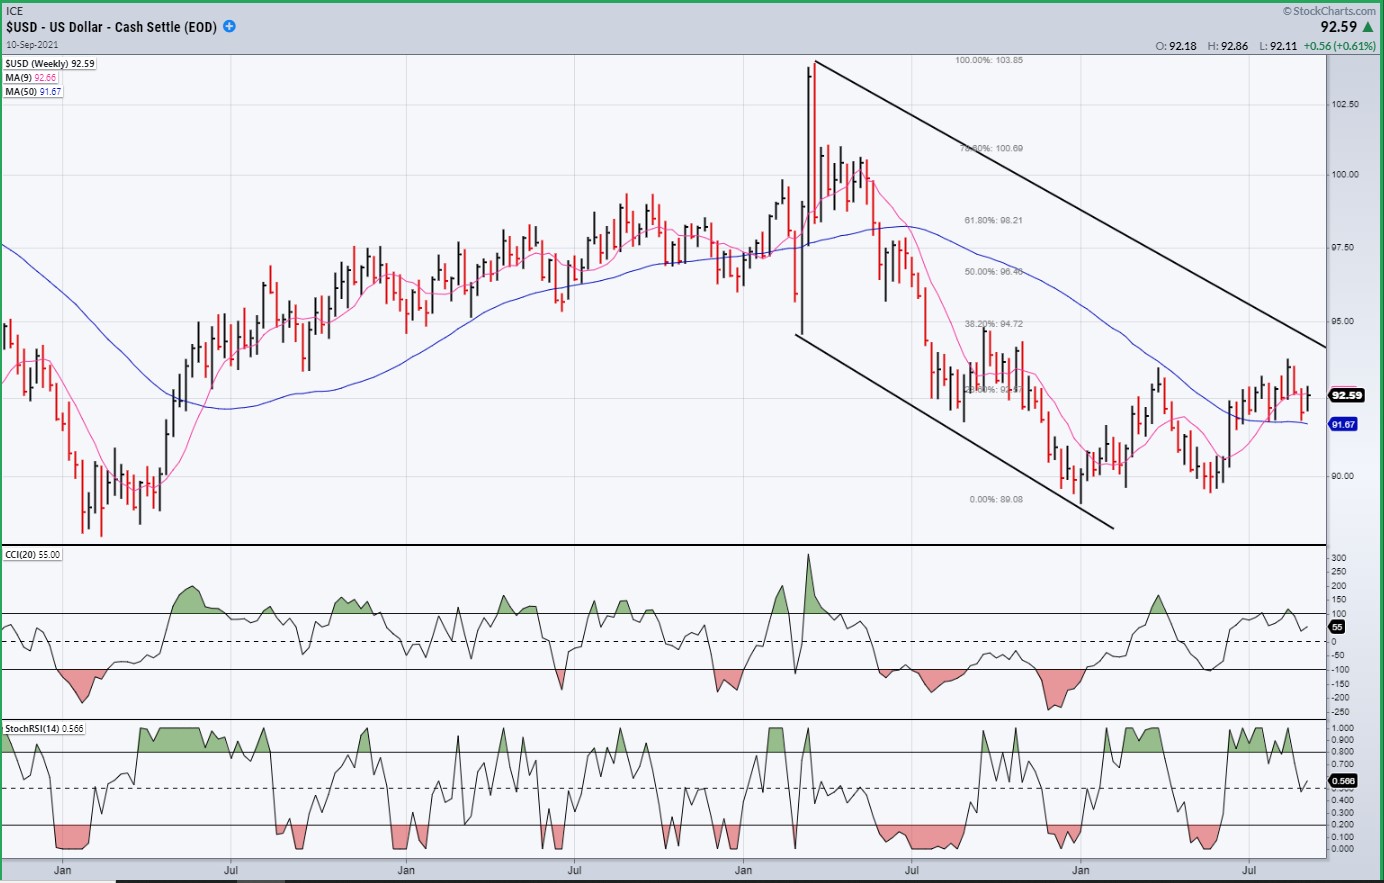
USD (dollar) dly
The dollar found support on its 50-dma and has bounced. It could still break it and retest its recent low.
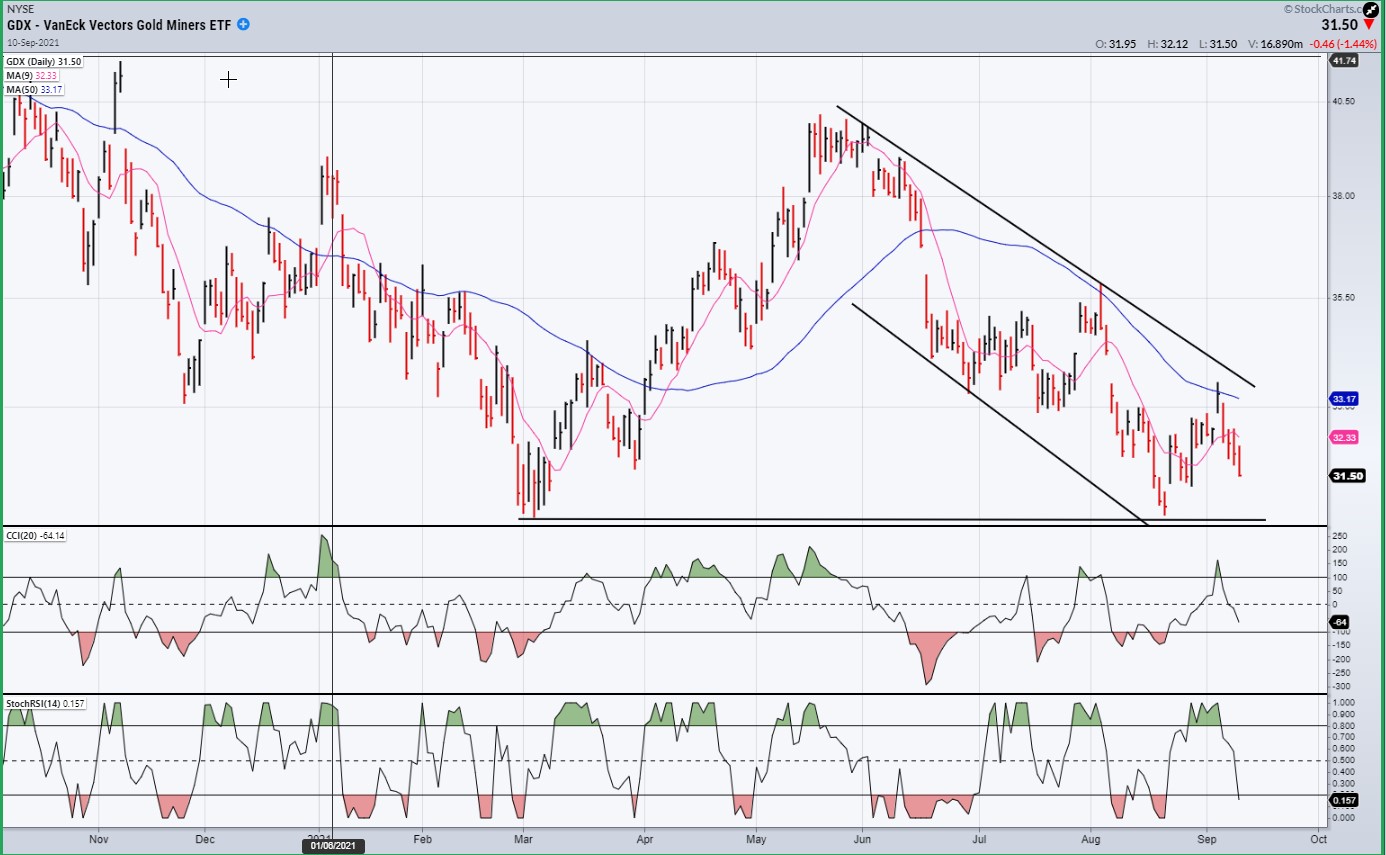
GDX (gold miners) (dly)
GDX remains confined to its corrective channel. Its rally met with resistance at the 50-dma where it was pushed back to where it was at the previous short-term peak. A move above the 50-dma would now be a move out of its corrective channel. That may be a tall order for now. With the last low showing no sign of decelerating, it may, at best, be able to move up to the descending channel line where it should meet with selling once again.
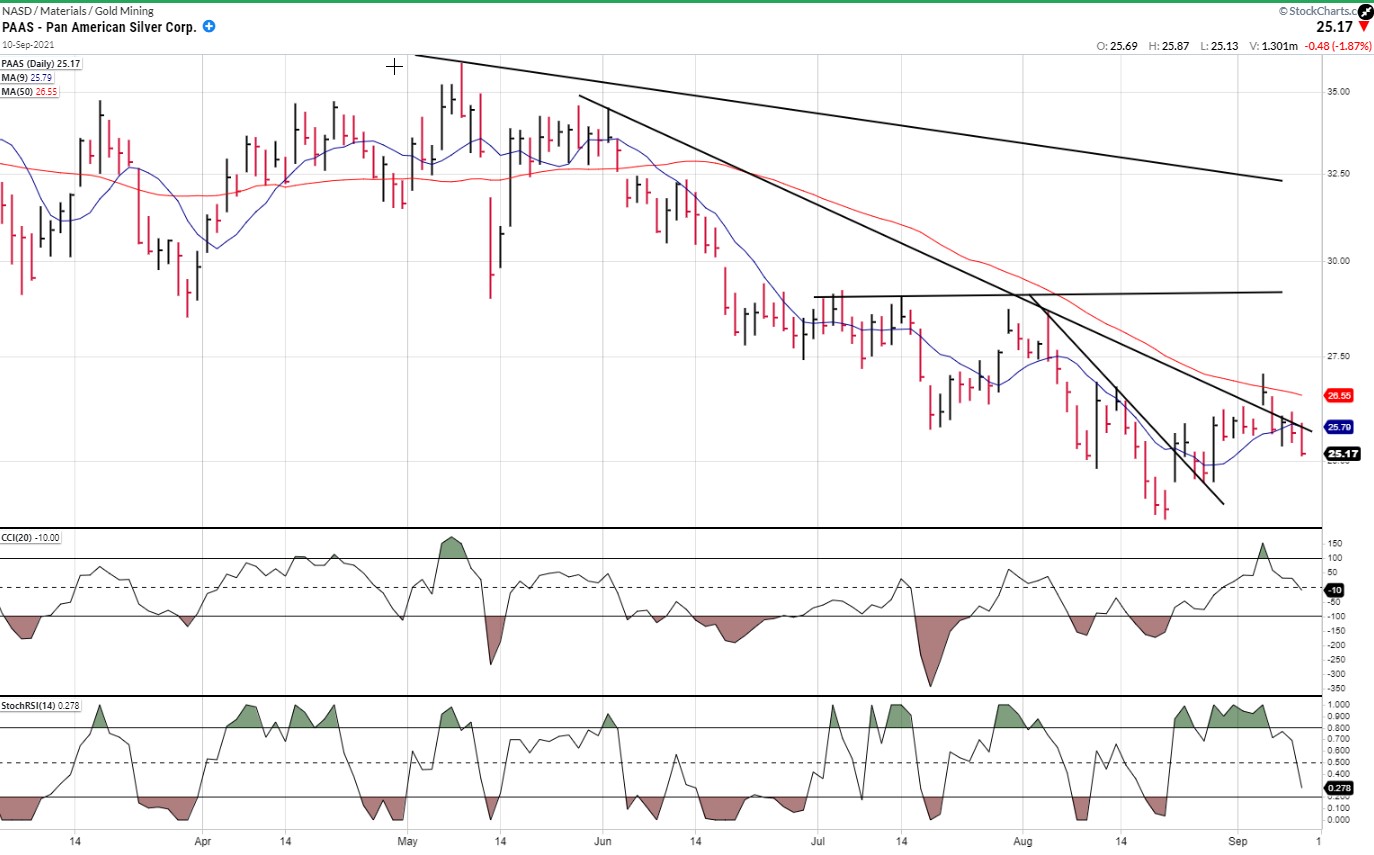
PAAS (dly)
PAAS made an unsuccessful attempt at moving above the combined resistance of its downtrend line and its 200-dma and was pushed back. However, not by much and the next attempt, if it comes from this level, could be more successful.
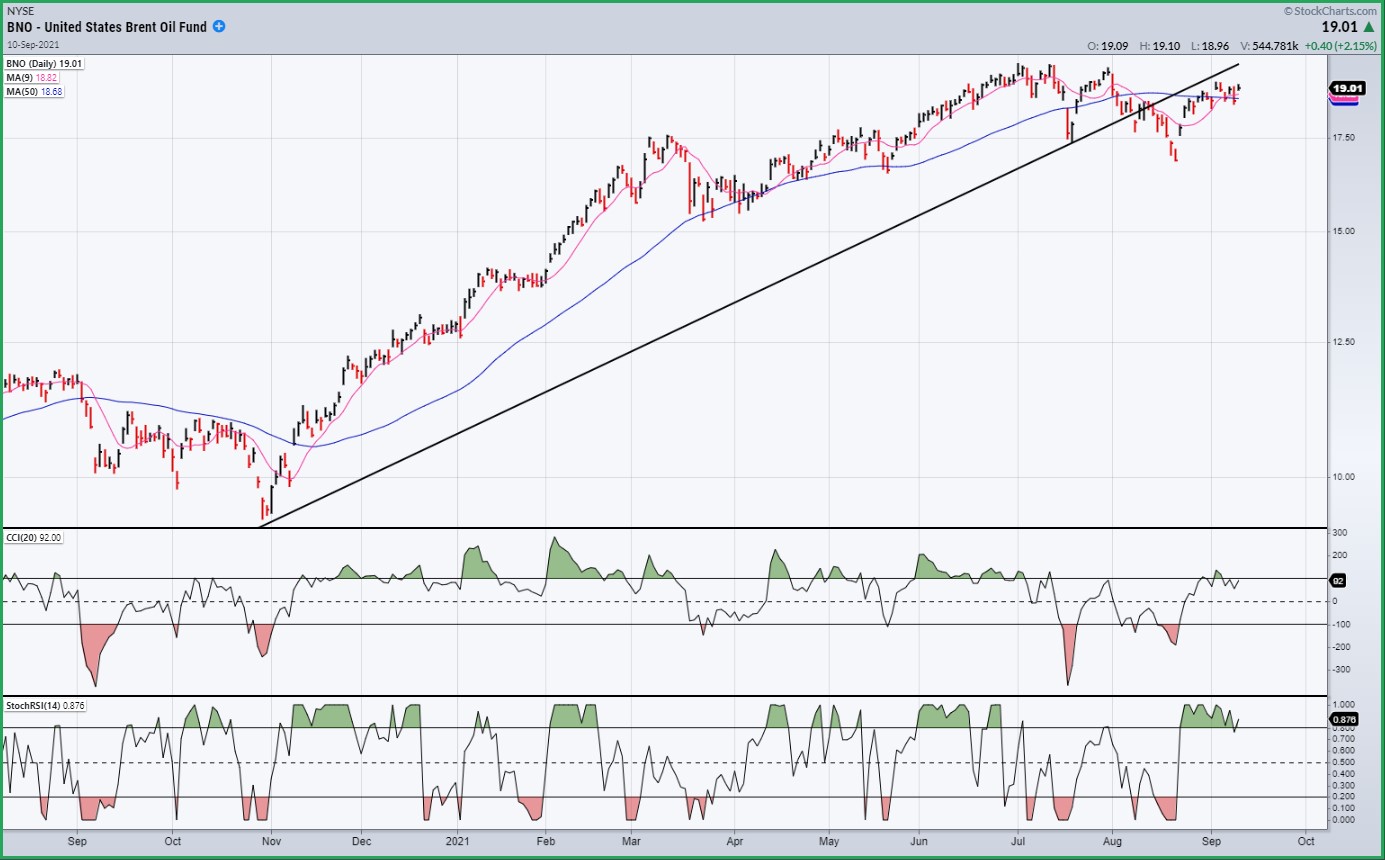
BNO (Brent oil fund) dly
BNO had a brief consolidation and then rallied, but it is finding resistance under the previous broken trend line and may be having trouble staying above the 50-dma. The next time it moves below it, this could lead to a deeper correction. Additional strength could lead to 22.
SUMMARY
A close monitoring of the SPX short-term cycle should help us determine when the final high of the uptrend which started in March 2020 has been struck for this index. But it is possible that the Dow has already made its bull market high.
Free trial subscription
With a trial subscription, you will have access to the same information that is given to paid subscribers, but for a limited time-period. Over the years, I have developed an expertise in P&F charting (price projection), cycles (timing), EWT (structure), and general technical analysis which enables me to warn subscribers of pending reversals in market trends, and how far that trend can potentially carry. For a FREE 2-week trial, subscription options, and payment plans I encourage you to visit my website at www.marketurningpoints.com.
The above comments and those made in the daily updates and the Market Summary about the financial markets are based purely on what I consider to be sound technical analysis principles. They represent my own opinion and are not meant to be construed as trading or investment advice but are offered as an analytical point of view which might be of interest to those who follow stock market cycles and technical analysis.
********

When Andre Gratian was a stock broker years ago, a friend introduced him to technical analysis of the market. Consequently, it is not an exaggeration to say that Andre fell in love with this approach! Ever since then, it has become an increasingly important part of his professional life. Gratian has studied the works of Wyckoff, Edwards & Magee, Edward J. Dewey (cycles) and many others. However, one of my most profitable undertaking has probably been to study Point & Figure charting, which he finds invaluable in analyzing stocks and indices. If he were restricted to one methodology, this is the one that he would choose. This well-rounded background has given him what he feels to be a special insight into the stock market, facilitating the recognition of meaningful patterns and the ‘turning points’ in all trends, whether they be short or long term. Andre feels very comfortable discussing the stock market and passing on meaningful information to others. His subscribers include individuals and money managers throughout the world. Moreover, his Newsletters are currently published on several financial sites, here and abroad.
More from Gold-Eagle


