Technical Analysis Of The Markets


Current Position of the Market
SPX Long-term trend: The 4540 projection which had been in effect since the March 2020 low has now been reached, but it is too early to call for an end to the bull market which started in March 2009.
SPX Intermediate trend: An intermediate correction has started. Let’s see if it evolves into something more serious.
Analysis of the short-term trend is done daily with the help of hourly charts. They are important adjuncts to the analysis of daily and weekly charts which determine longer market trends.
Has the 4540 Target Identified the Bull Market Top?
Cycles: Looking ahead!
7-yr cycle – Last lows: 2009-2016. Next low: ~2023
Market Analysis (Charts, courtesy of StockCharts)
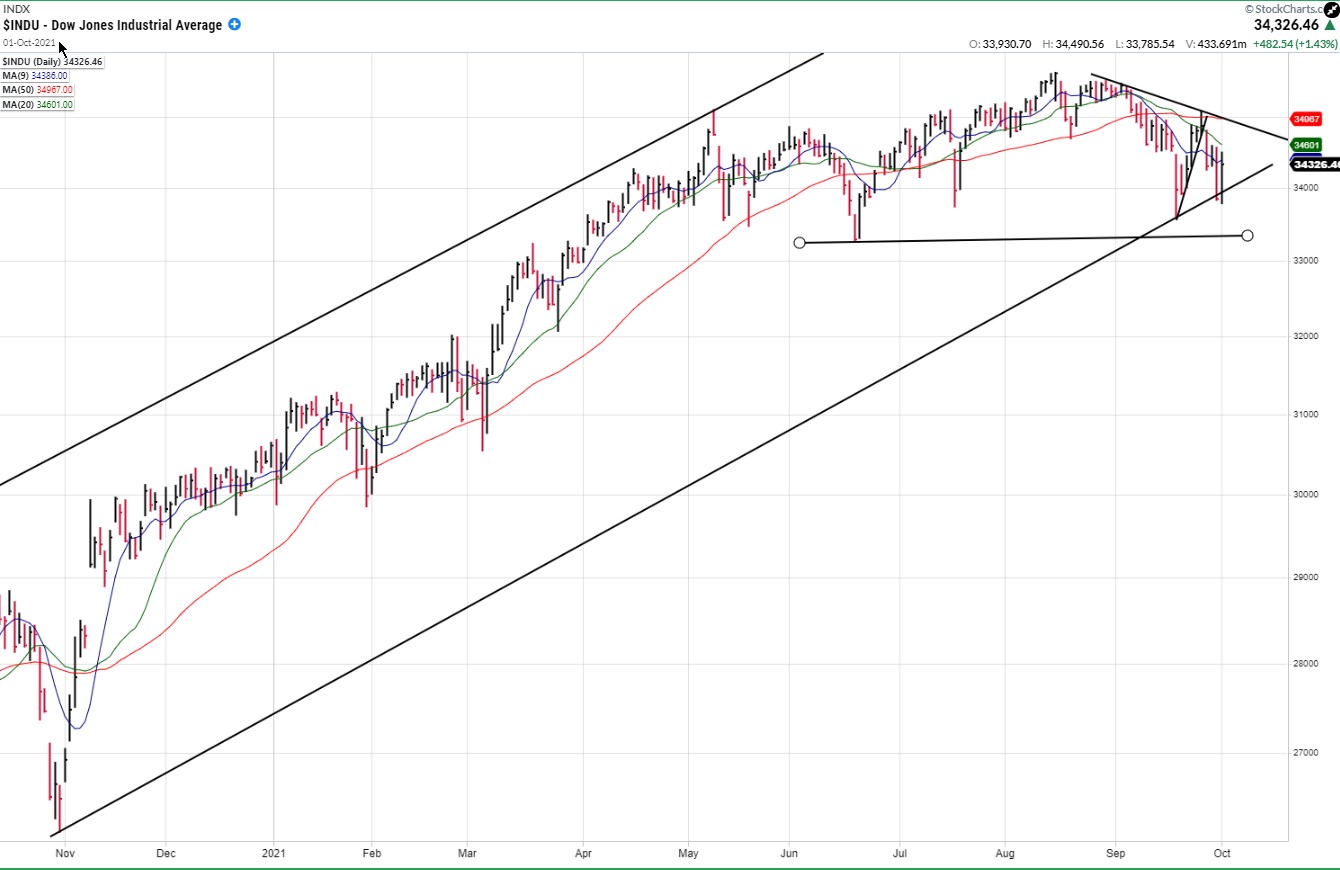
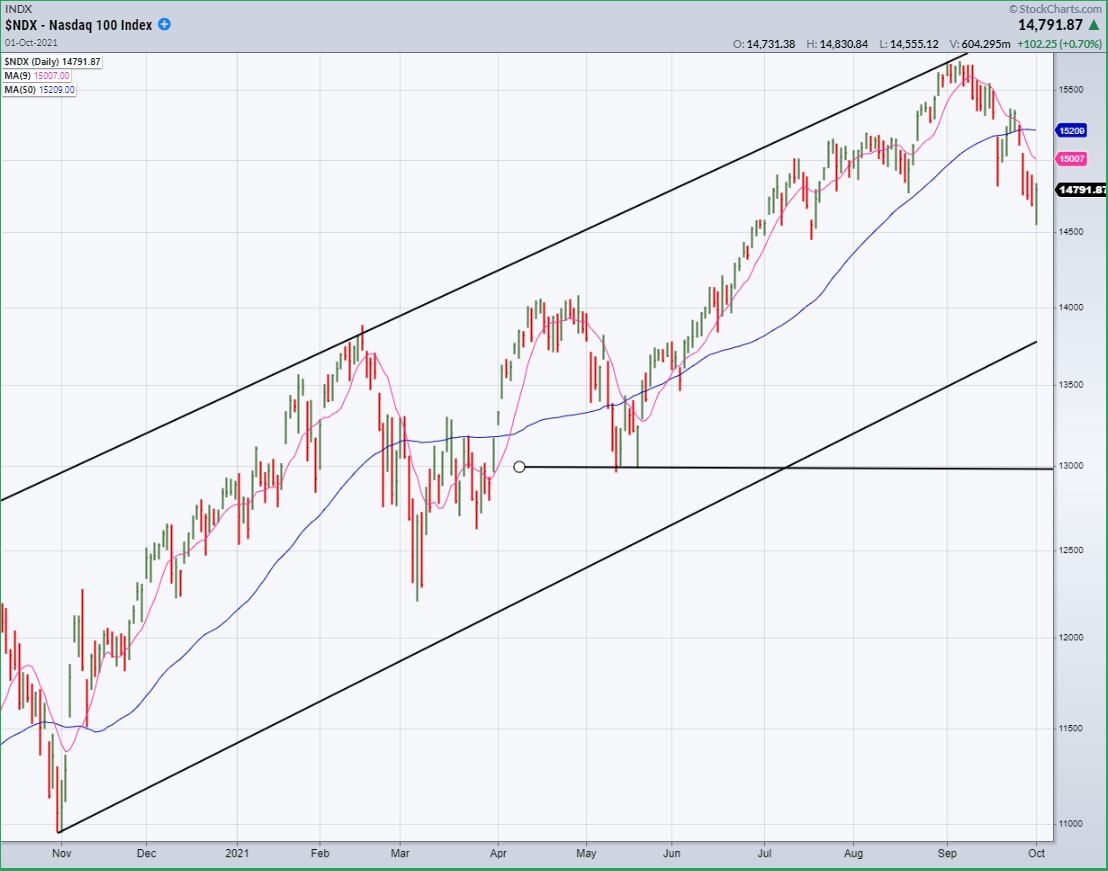
DJIA-NDX daily
After the March 2020 low initiated a strong upthrust of about equal strength in the major indices, the first intermediate correction occurred between mid-September to the start of November. After that brief respite indices continued to rise in a more moderate but sustained uptrend. In this section we compare the performance of DJIA and NDX since that year end intermediate low. Their trends were roughly similar until mid-February 2021 when NDX underwent another intermediate correction while DIA continued pretty much unabated until about May when both indexes sufffered another, less severe correction.
The period of interest comes after that date. NDX continued its uptrend with renewed momentum which lasted into early September before a top appeared. By contrast, although DJIA also continued to move higher, it did so at a much more moderate pace and topped out in mid-August. The top of both indices only came two weeks apart; but that does not tell the whole story. Drawing a horizontal line at the beginning of the last up-phase of each index, illustrates the difference in their performance. DJIA began to decelerate much earlier and, since it made its high, has been much weaker.
Cycles suggest that DJIA should break below its June low well before the end of the year. If so, the resulting chart pattern will take on the appearance of a market top.
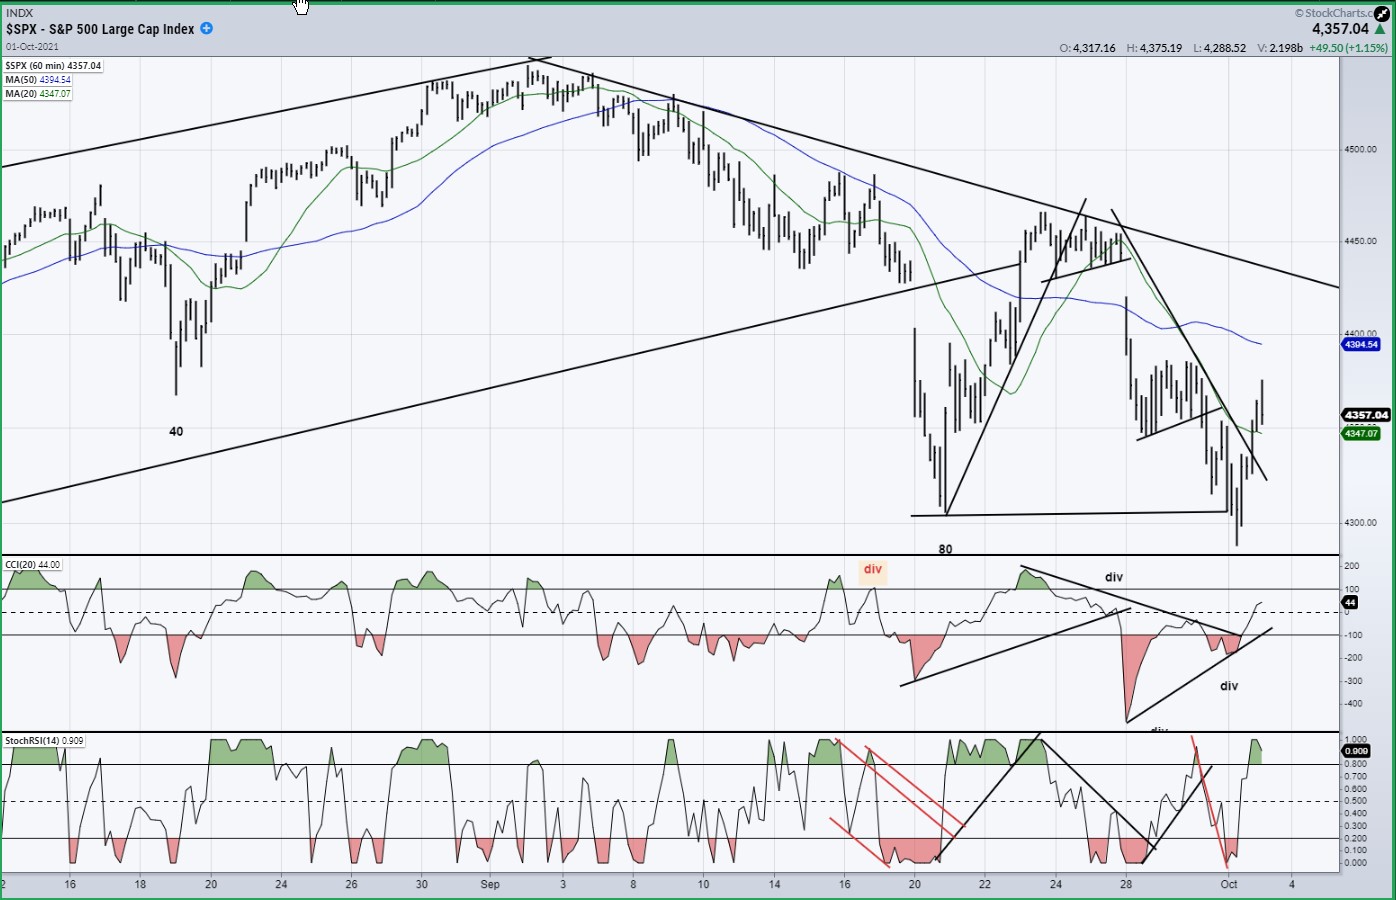
SPX daily chart
SPX, being a hybrid of DJIA and NDX, is neither as weak as the former nor as strong as the latter. Below is a chart of SPX which is more detailed than those above. I have added a mid-channel trend line, oscillators, and identified the short- term cycle which is an alternation of the Hurst 40 and 80-day cycles. These have had a very regular beat since May and, along with the P&F chart, are of great help in forecasting what the index is likely to do in the foreseeable future.
For several months now, I have suggested that, based on the P&F pattern that SPX created when it made its March 2020 low, it would likely make an important high at 4540 which could even turn out to be the top of the bull market that started in March 2009. Being aware that a 7-year cycle -- the same one which created the March 2009 low and repeated in February 2016 -- would make its next low in 2023, it became important to see how the index would perform after it made an all-time high at 4546 this past August. So far, SPX appears to be making its deepest correction since November of last year and, based on the short-term cycle pattern and the P&F chart, the decline is not likely to be over.
After bottoming below a previous short-term low for the first time since last September, the 80-day cycle made its low on 9/20 while overcoming that of the previous 40-day cycle on 8/20. Furthermore, after a 160-point rally, the index completely retraced its uptrend and made a new low on Friday before starting another powerful oversold rebound which spanned 88-points before it came to an end. Odds favor that this is only a countertrend rally, with SPX expected to drop to a new short-term low by the time the next 40-day cycle bottoms around 10/20.

SPX hourly chart
The hourly chart shows more plainly how the last short-term low was penetrated by the current 80-day cycle low, and how that low was itself overcome by the decline into Friday morning before a powerful oversold rally took hold. We now need to watch if the current rebound will turn into an uptrend which can surpass the recent high of 4456 -- which is what SPX would have to do to nullify the P&F count established at that level calling for a drop down to about 4260-4230 on approximately 10/20, when the next 40-day cycle is slated to make its low. If this is what the index does, it will confirm and prolong the new downtrend which was started when prices broke through the bottom trend line of the rising channel -- and especially when it traded below the former 40-day cycle low.
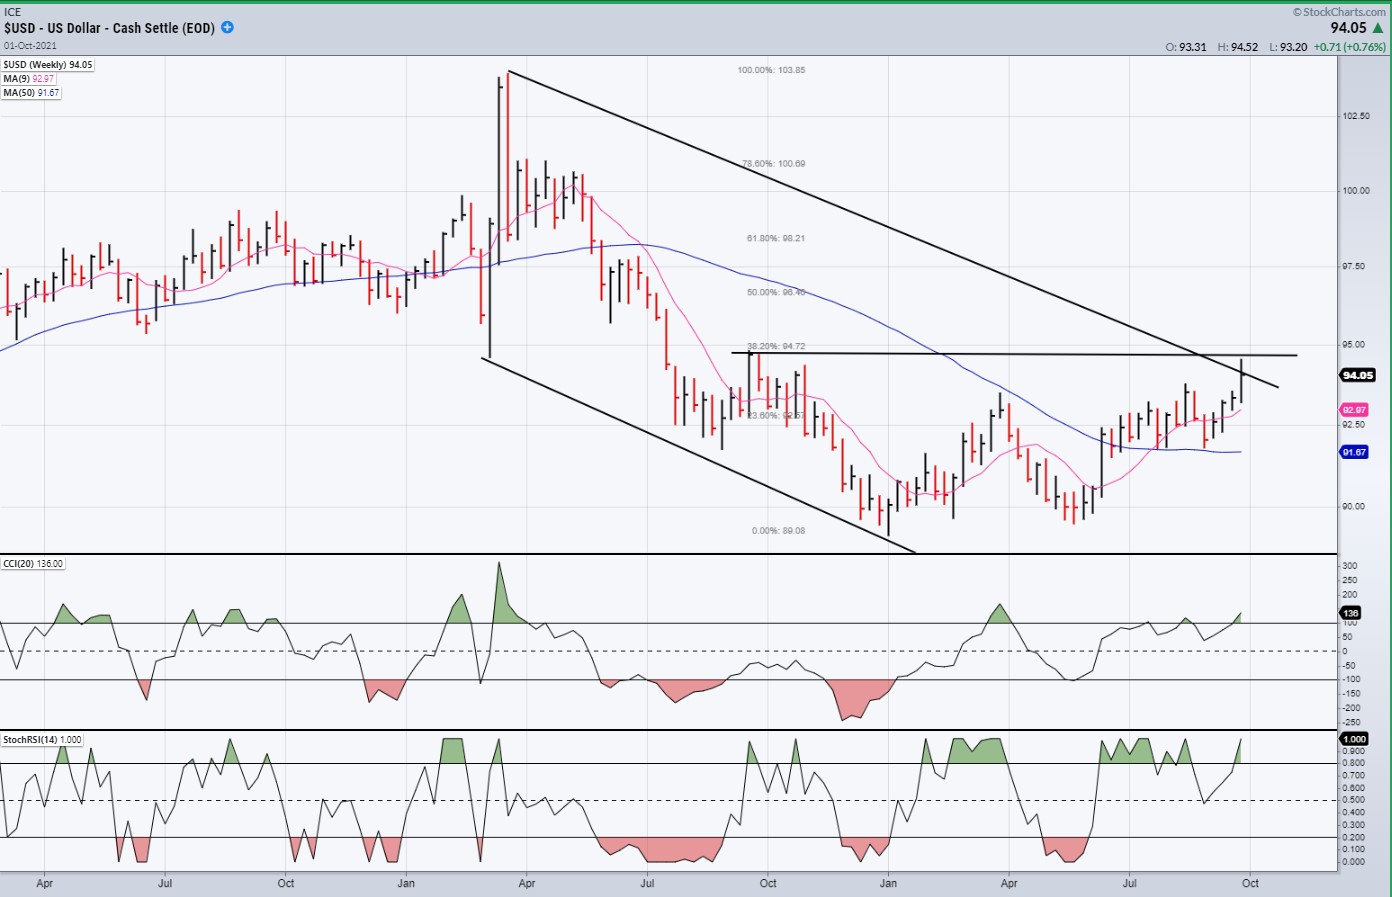
USD (dollar) (daily)
The dollar has now reached the top line of its corrective channel, concurrently retracing .382 of its decline. This should be enough to trigger a minor consolidation in the index before it pushes toward the 50% retracement level of 96.50 where it will meet with much stronger resistance.
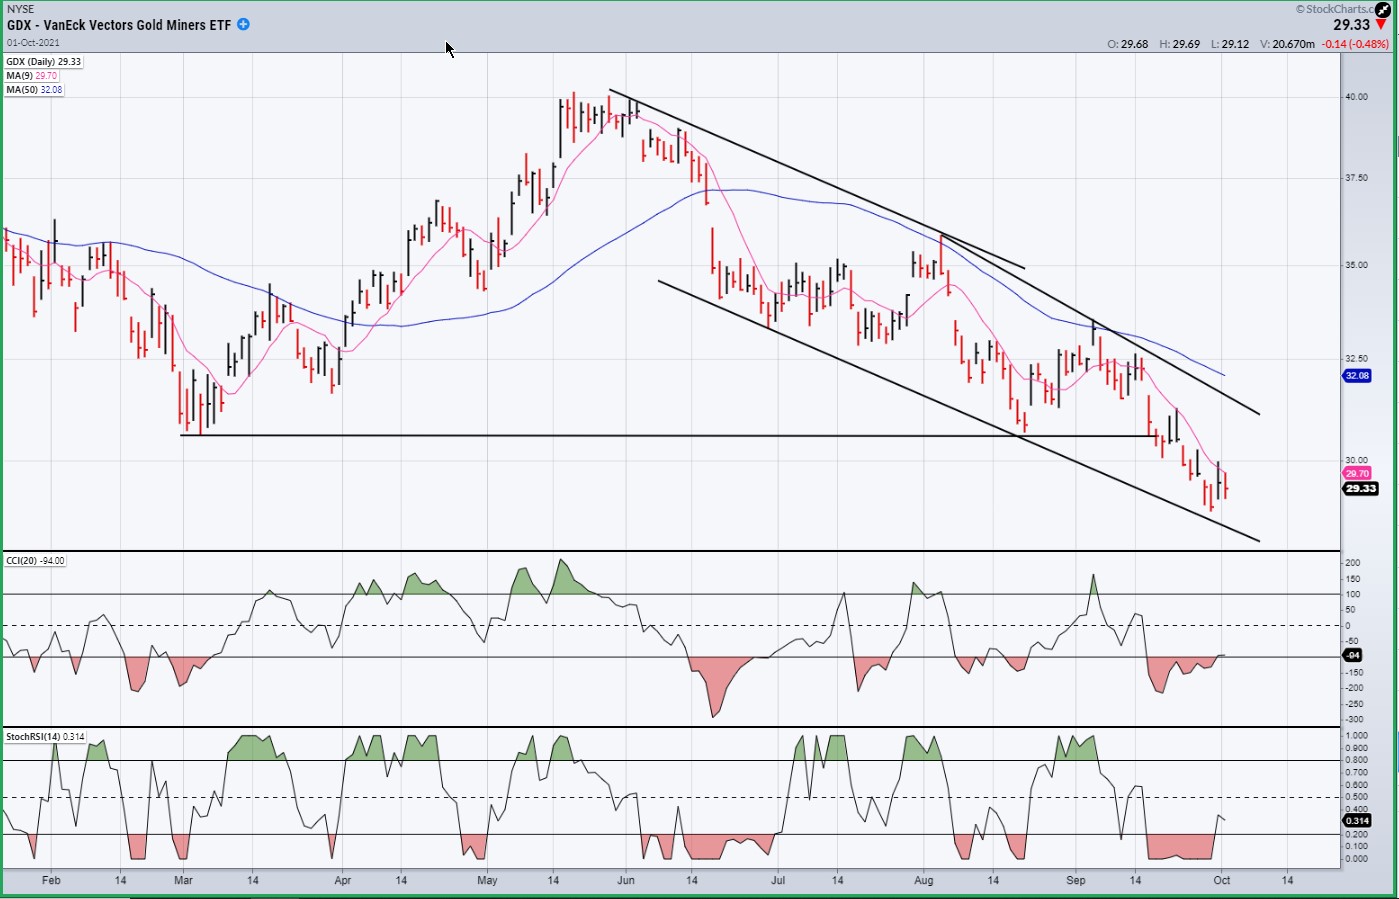
GDX (gold miners) (daily)
GDX broke support when it dropped below 30.60. It may find new temporary support at its recent low of 28.80, but it may have to see ~27 before it has a chance to reverse its downtrend.
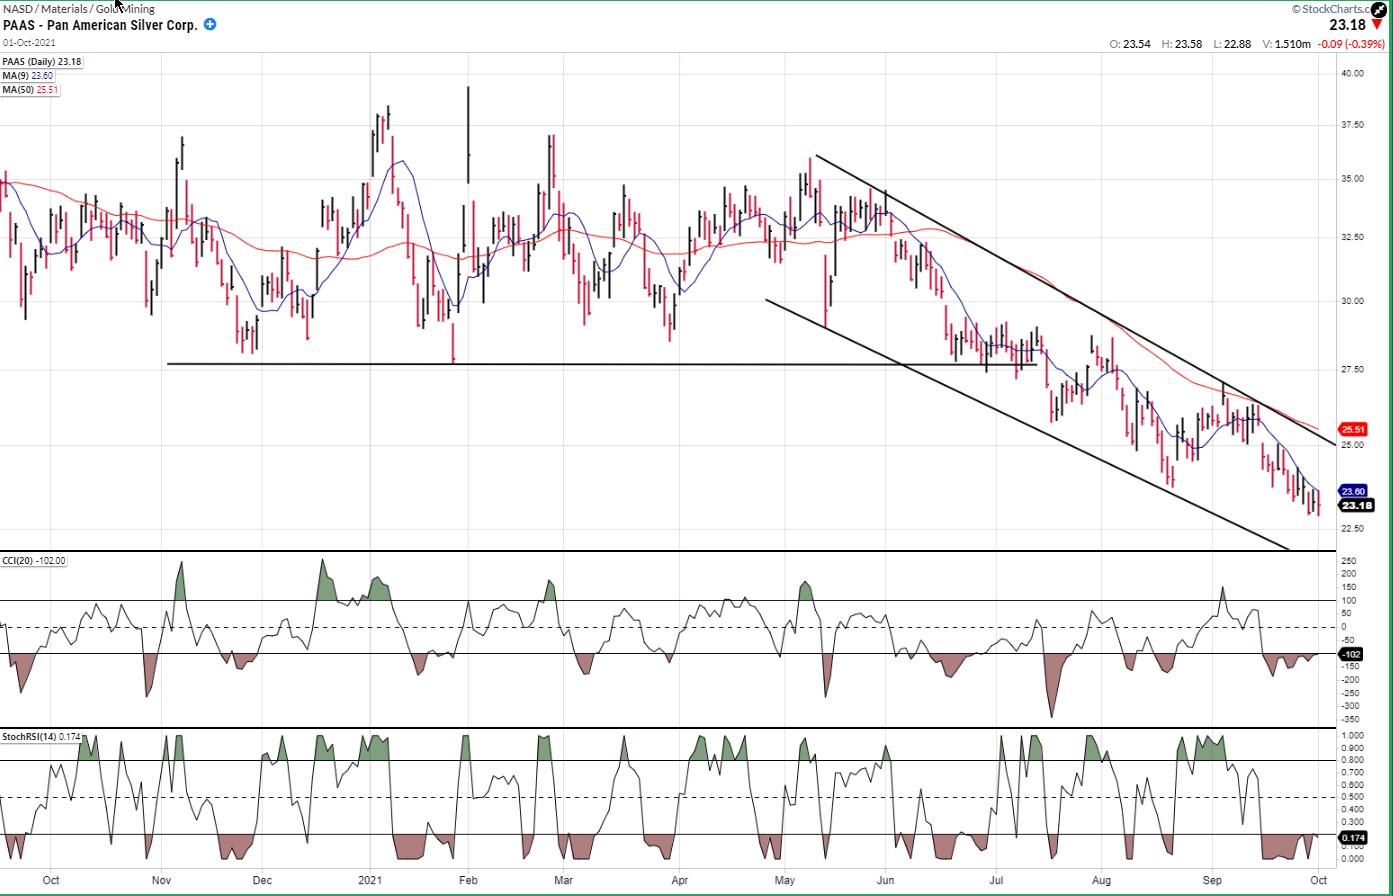
PAAS (daily)
PAAS broke support when it traded below 27.50. The chart shows signs of price deceleration, but the index is making it crystal clear that it will remain in a downtrend until it is able to move above its top channel line which is reinforced by the 200-dma.
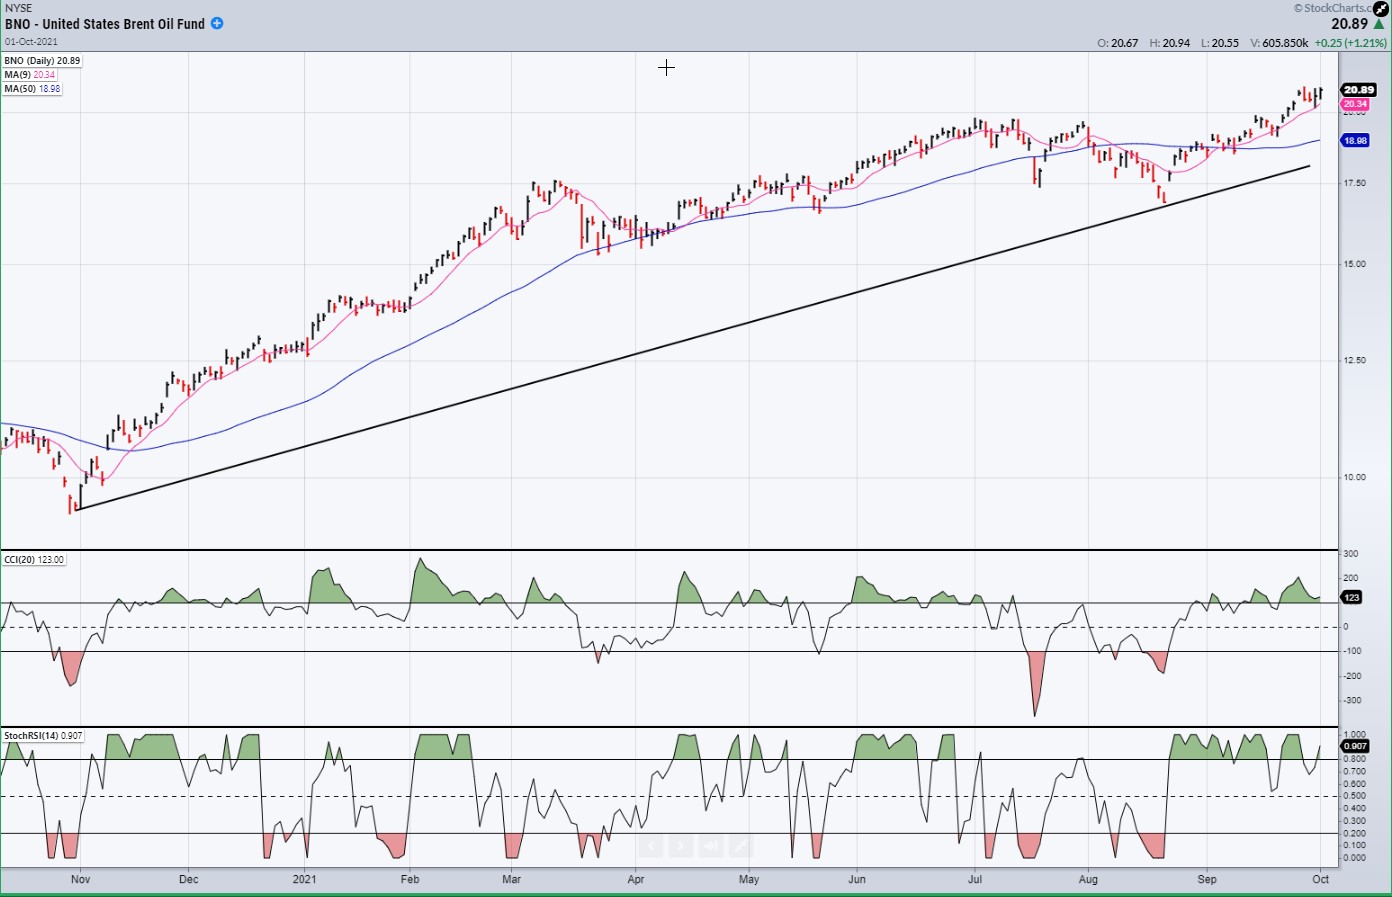
BNO (Brent oil fund) daily
BNO is about to print 21 but should be able to reach 22 before it starts a significant correction.
SUMMARY
After reaching its important 4540 projection, SPX reversed and started a downtrend which should lead to an intermediate correction, at least! However, it is too early to call for an end to the bull market.
Free trial subscription
With a trial subscription, you will have access to the same information that is given to paid subscribers, but for a limited time-period. Over the years, I have developed an expertise in P&F charting (price projection), cycles (timing), EWT (structure), and general technical analysis which enables me to warn subscribers of pending reversals in market trends, and how far that trend can potentially carry. For a FREE 2-week trial, subscription options, and payment plans I encourage you to visit my website at.
The above comments and those made in the daily updates and the Market Summary about the financial markets are based purely on what I consider to be sound technical analysis principles. They represent my own opinion and are not meant to be construed as trading or investment advice but are offered as an analytical point of view which might be of interest to those who follow stock market cycles and technical analysis.
***********

When Andre Gratian was a stock broker years ago, a friend introduced him to technical analysis of the market. Consequently, it is not an exaggeration to say that Andre fell in love with this approach! Ever since then, it has become an increasingly important part of his professional life. Gratian has studied the works of Wyckoff, Edwards & Magee, Edward J. Dewey (cycles) and many others. However, one of my most profitable undertaking has probably been to study Point & Figure charting, which he finds invaluable in analyzing stocks and indices. If he were restricted to one methodology, this is the one that he would choose. This well-rounded background has given him what he feels to be a special insight into the stock market, facilitating the recognition of meaningful patterns and the ‘turning points’ in all trends, whether they be short or long term. Andre feels very comfortable discussing the stock market and passing on meaningful information to others. His subscribers include individuals and money managers throughout the world. Moreover, his Newsletters are currently published on several financial sites, here and abroad.


