Technical Analysis Of The Markets


Current Position of the Market
SPX Long-term trend: Uptrend continues.
SPX Intermediate trend: The correction from 2400 continues,
Analysis of the short-term trend is done on a daily-basis with the help of hourly charts. It is an important adjunct to the analysis of daily and weekly charts which discuss longer market trends.
Correction Continues
Market Overview
SPX has been correcting ever since it reached its 2400 target on February 30. The correction has been mild, declining about 46 points in its first phase. The second phase was a rally which reached 2390 last week, falling short of a potential target extension to 2410. Now, the index appears to have started on its next phase which should be another decline induced by intermediate cycles bottoming over the next six weeks. A projection based on the amount of distribution generated since the high does not foresee a major -- but still healthy -- decline at this time, which could continue for several more weeks until all three cycles have made their lows. More precise information will be made available to subscribers in the form of daily updates, as the formation unfolds.
After the correction is complete, another rally should reach a new high which will be determined by the re-accumulation pattern created by the current correction. A significant decline of an estimated 300+ points will most likely wait until the next high before getting underway.
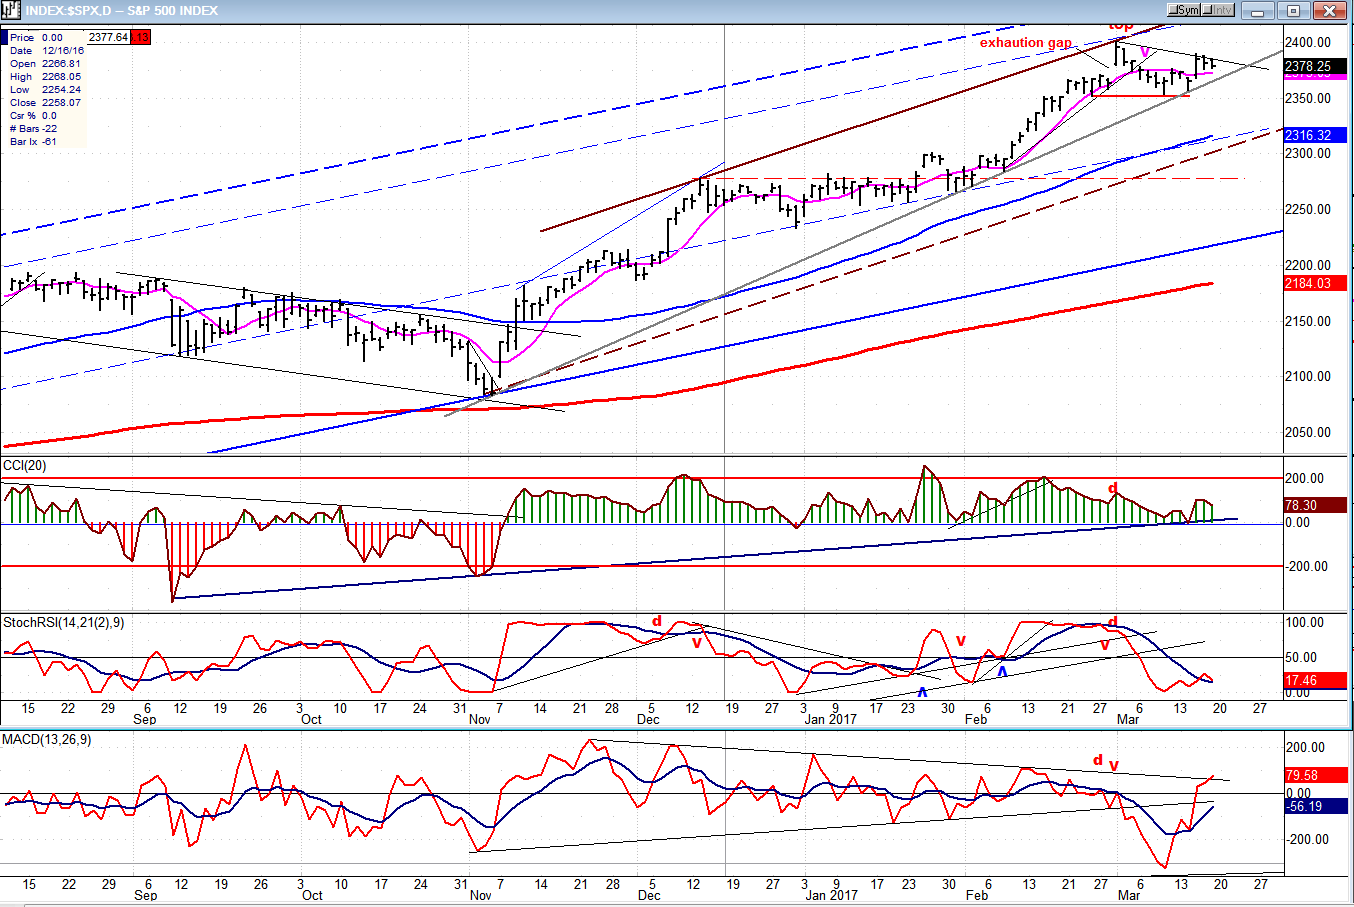
Daily Chart
The rally from 2084 has been progressing in the secondary (brown) channel which is actually the tertiary channel if you consider the primary pit bull market channel (not shown on this chart). The trend line drawn from that low stopped the first part of the correction, and it needs to be broken to confirm that it is now extending into the cycle lows which could come in late April-early May.
Structure suggests that SPX should trade outside of the bottom (dashed) trend line of the secondary channel before the correction is complete, and (coincidentally) find support on the extensive congestion area which took place over a two-month period above 2100. However, with three important cycles bottoming in close proximity over the next few weeks, we could experience some volatility before we are ready to resume the long-term uptrend.
The indicators look mixed, all going in different directions, but two of the three have already peaked suggesting that we are about to break the trend line from 2084. For confirmation, the top indicator must break its trend line and go negative.
Advance warning that the daily indicators are ready to give a sell signal usually comes from the hourly indicators which are the early birds. As we will see next, they issued a fairly decisive call on Friday.
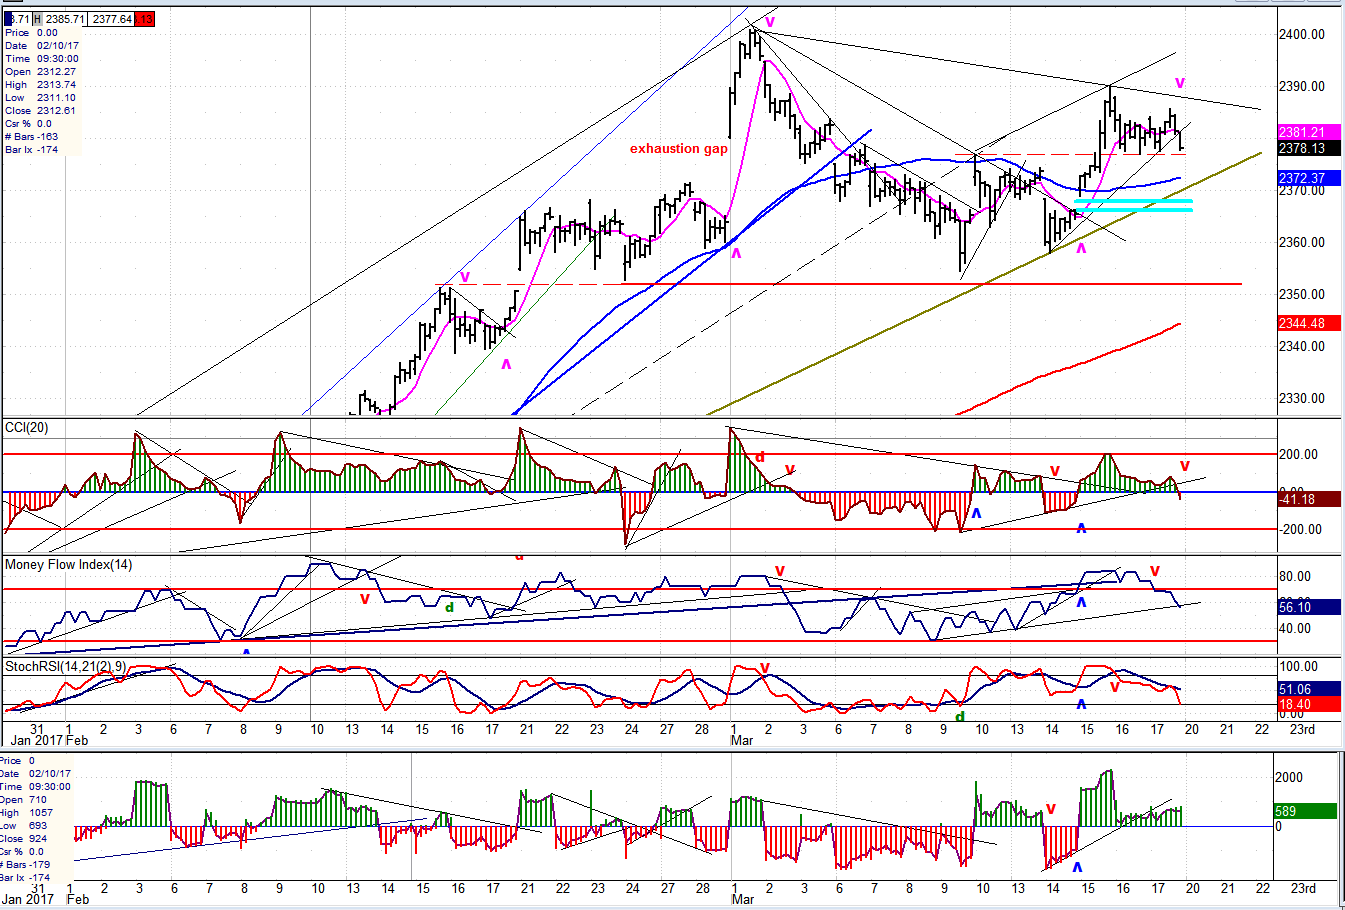
Hourly Chart
After the rally following the Fed’s decision to raise rates, the index went into a minor consolidation phase which turned down on Friday after a failed attempt at moving higher. The last two hours of trading on Friday took the index back to the lowest level of the day where it closed, seemingly ready to break below the small congestion area which has enough distribution to decline well outside of the trend line and even below the gap. If this occurs, it would create a confirmed sell signal that should also break below the 2353 level which has previously supported prices.
This is the implication given by the closing action of the oscillators on Friday, and which often results in a downside gap opening on the next day of trading. Should this happen, a good decline on Monday would result in a sell signal in the daily indicators. As always, the market action will need to confirm the analysis.
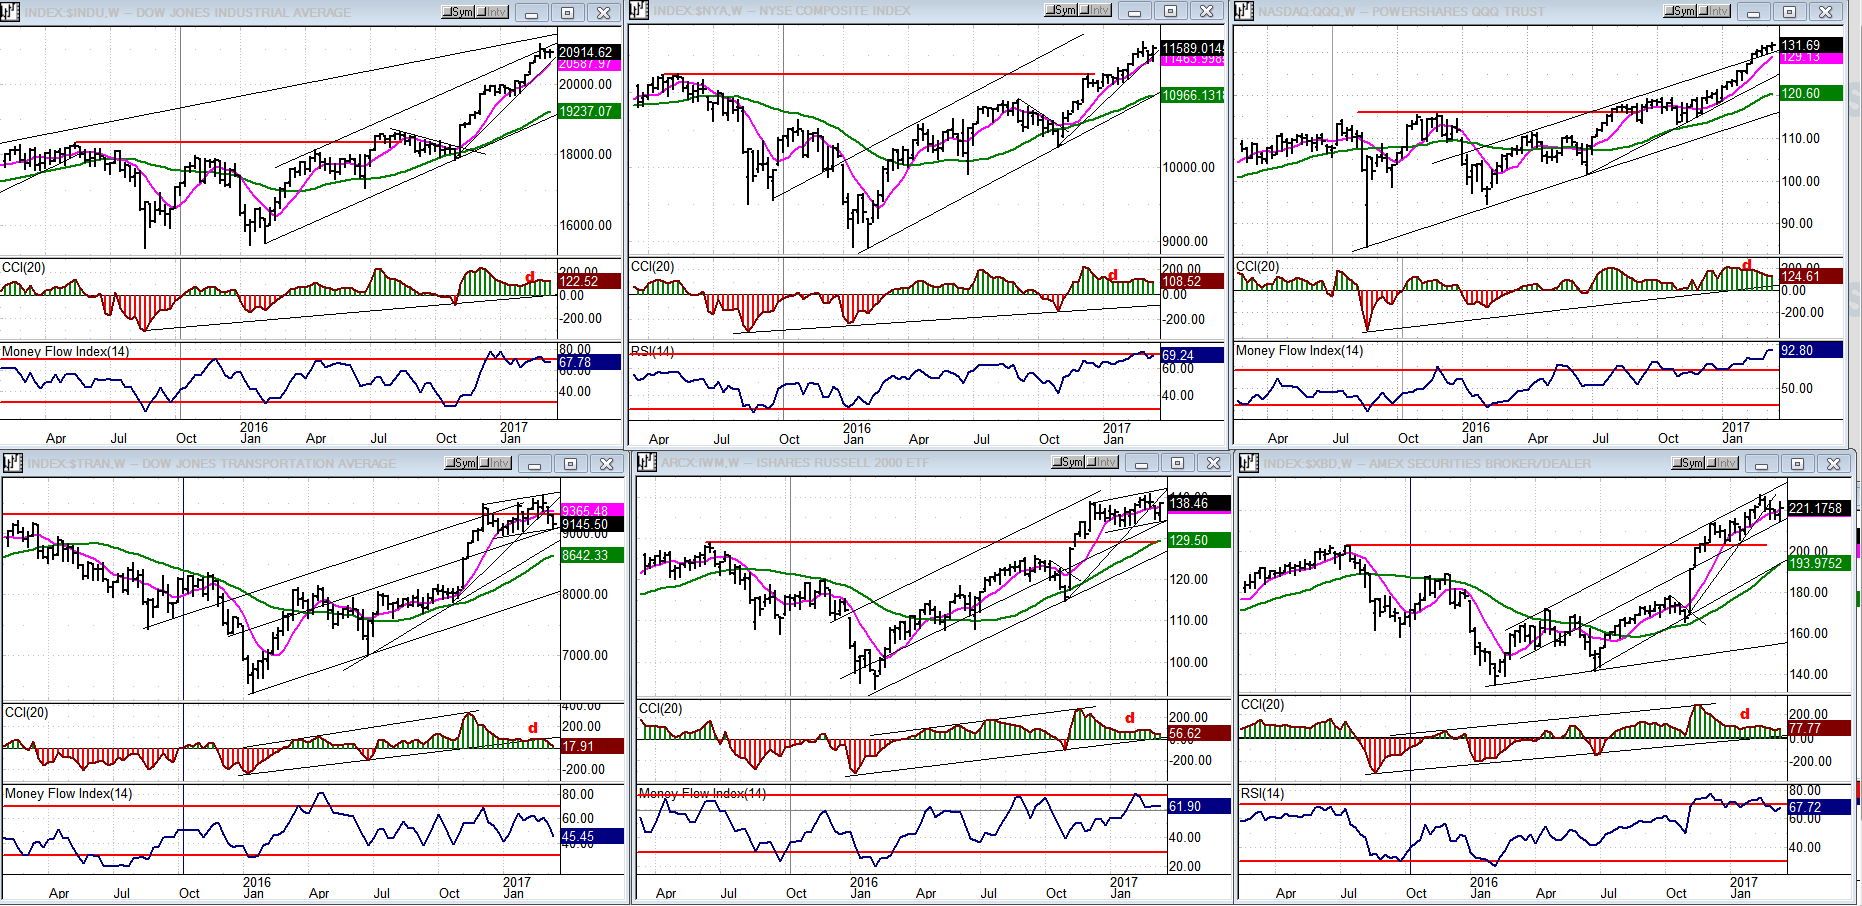
An Overview Of Some Important Indexes (Weekly Charts)
TRAN and IWM (bottom left and center) continue to be the weakest of the group with TRAN now clearly the weaker (which is as it should be) and nearly ready to give a weekly sell signal. As you can see, the strong ones are overbought according to their MF and RSI and showing negative divergence on at least one of the oscillators. But it’s the transportation index which could be the first to go negative next week.
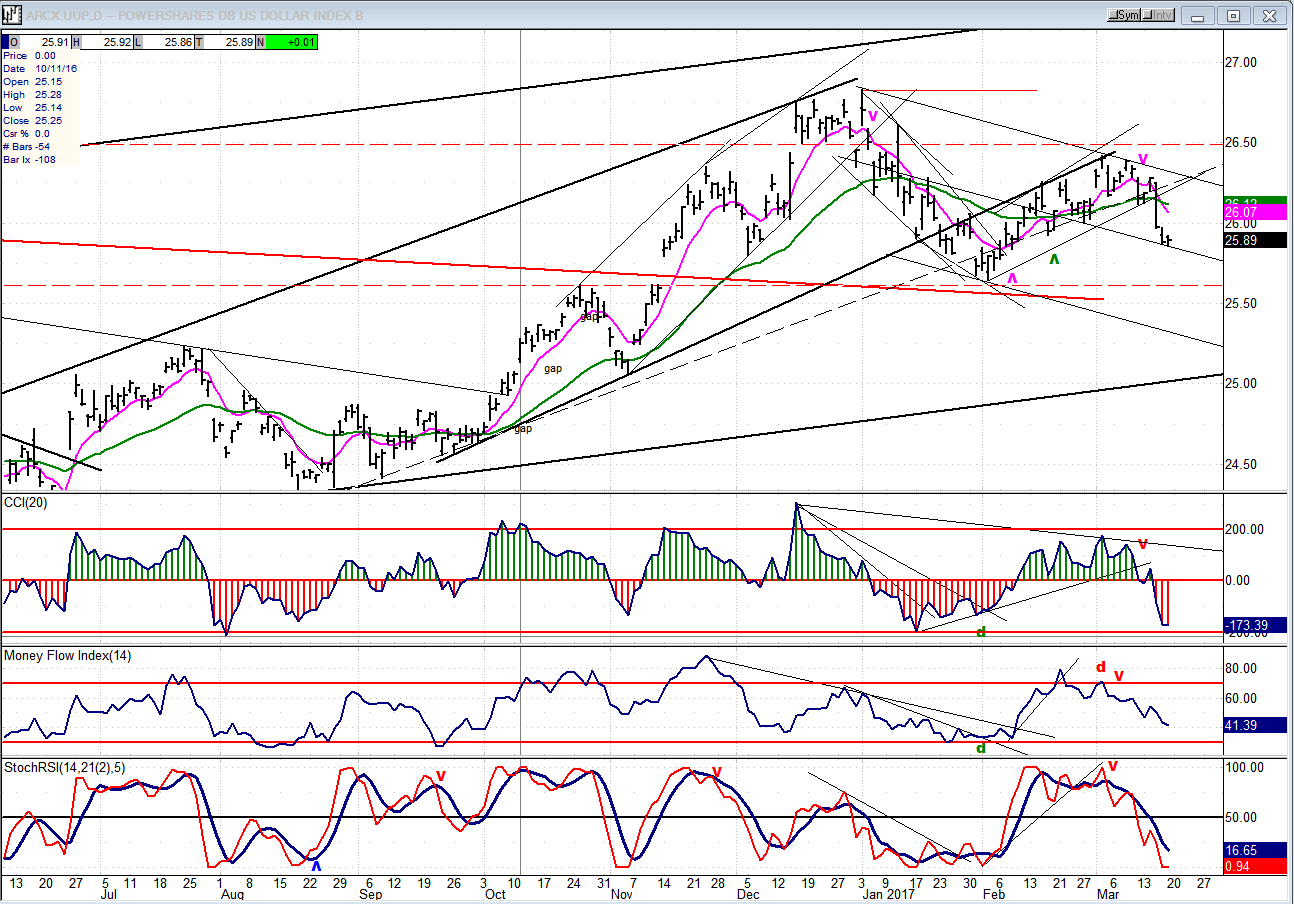
UUP (Dollar ETF)
UUP had a quick drop last week as it continues the c-wave correction from its 7-yr high. It found temporary support on the corrective mid-channel line, but is likely to drop lower before its correction is complete.
GDX (Gold Miners ETF)
With the help of a daily and two weekly cycles bottoming close to one another, GDX rallied in what could still be an incomplete correction from its secondary top. In which case, it could still make slightly new lows, but not before completing its current rally which requires one more high. The current pattern does not have much of a base and some backing and filling is needed.
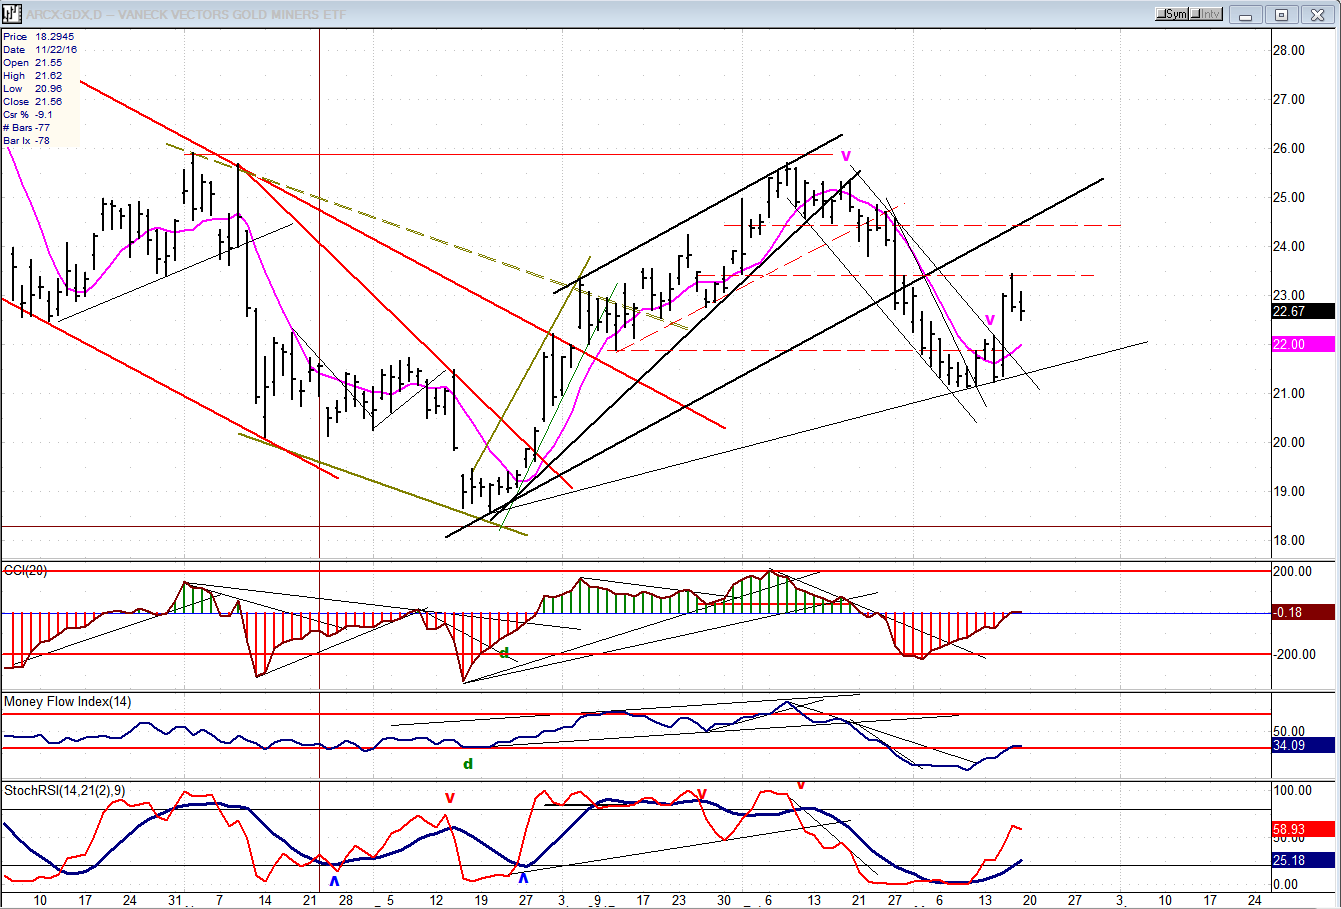
Note: GDX is now updated for subscribers throughout the day, along with SPX.
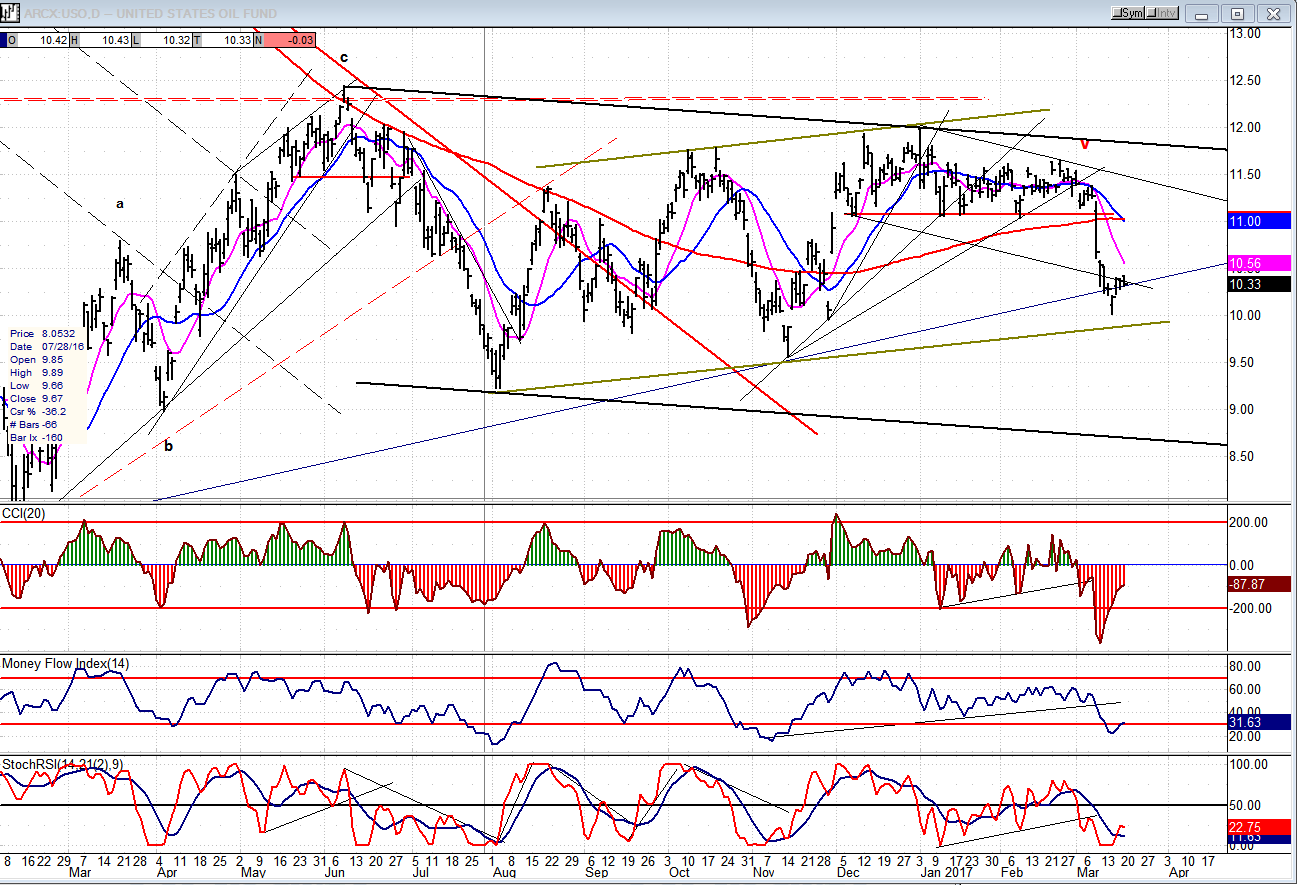
USO (US Oil Fund)
USO is holding on its main trend line, even though it was breached. If it fails, it can still rely on the lower up-channel line for support. Beyond that, the bottom of the larger corrective channel could be the target. USO must be given a little time to decide which path it next wants to follow.
Summary
SPX started a correction after it reached the 2400 target. Until now, it was not certain if it wanted to continue to the 2410 extension before correcting. Friday’s action strongly implies that it is preparing to continue the corrective process which could last for several more weeks until the three intermediate cycles that are currently bottoming have made their lows. More specific information will be provided through multiple daily updates, including price projections and reversal points, as the correction evolves.
********
For a FREE 4-week trial, send an email to [email protected], or go to www.marketurningpoints.com and click on “subscribe”. There, you will also find subscription options, payment plans, weekly newsletters, and general information. By clicking on "Free Newsletter" you can get a preview of the latest newsletter which is normally posted on Sunday afternoon (unless it happens to be a 3-day weekend, in which case it could be posted on Monday).
The above comments and those made in the daily updates and the Market Summary about the financial markets are based purely on what I consider to be sound technical analysis principles. They represent my own opinion and are not meant to be construed as trading or investment advice, but are offered as an analytical point f view which might be of interest to those who follow stock market cycles and technical analysis.

When Andre Gratian was a stock broker years ago, a friend introduced him to technical analysis of the market. Consequently, it is not an exaggeration to say that Andre fell in love with this approach! Ever since then, it has become an increasingly important part of his professional life. Gratian has studied the works of Wyckoff, Edwards & Magee, Edward J. Dewey (cycles) and many others. However, one of my most profitable undertaking has probably been to study Point & Figure charting, which he finds invaluable in analyzing stocks and indices. If he were restricted to one methodology, this is the one that he would choose. This well-rounded background has given him what he feels to be a special insight into the stock market, facilitating the recognition of meaningful patterns and the ‘turning points’ in all trends, whether they be short or long term. Andre feels very comfortable discussing the stock market and passing on meaningful information to others. His subscribers include individuals and money managers throughout the world. Moreover, his Newsletters are currently published on several financial sites, here and abroad.


