There's Gold in Them Thar Hills


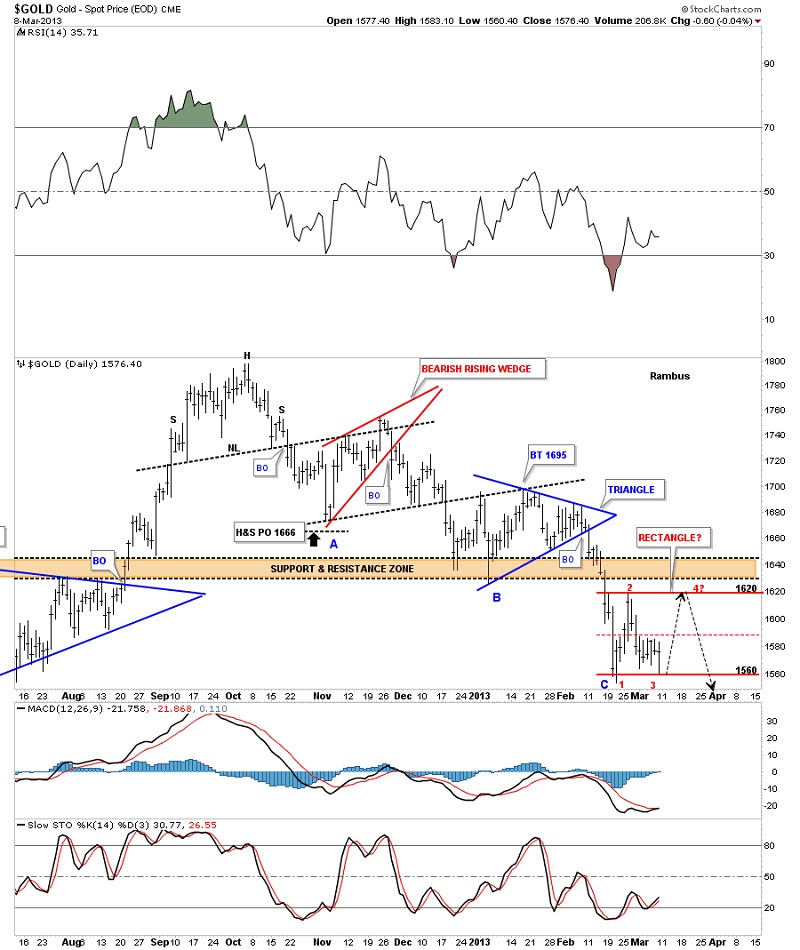
The current chart is a daily bar chart for gold that shows all the consolidation patterns since hitting the top of the rectangle back in October of last year at 1800 or so. If gold was ready to break below the bottom rail of the big rectangle, today would have been a good time to do so. Because it didn't breakdown this morning that tells me the sideways correction that has been going on already for almost 3 weeks now, still has more work to do. Below shows what I think could be a smaller red rectangle that is forming below the brown shaded support and resistance zone that may end up being just one more consolidation pattern to the downside. The possible red rectangle is about 60 points and with today's close around 1575 or so would leave about 45 more point to go to reach the top rail. At our most recent bottom there have been 3 main declines out of the Head&Shoulders Top and the two consolidation pattern. This is a good example of how a downtrend works. It starts out with a top that breaks down hard and then a consolidation pattern forms and then when its finished you get another hard down and so on until you get a reversal pattern form at the bottom. I've labeled these 3 hard down phases

This last chart shows what I consider the most important moving averages on the daily look. As you can see the price action is trading well below all three moving averages which is a negative.
This should get everyone up to speed on how gold is trading. I don't really expect much action until the smaller rectangle is finished forming.
Editors Note:
Rambus Chartology is a Precious Metals Based Technical Analysis Site with a twist
"Give a Man a Chart and he can eat for a day : Teach a man To Chart and He will never Starve"
More Info and Charts a http://rambus1.com/
 Meet Rambus, a seasoned trader and technical analyst renowned for his unbiased and insightful chart work. Through his website, Rambus Chartology, and Substack newsletter, Rambus shares his expertise with a global community of subscribers, providing daily updates, commentaries, and hands-on training in the art and science of chartology. With his calm, humble, and down-to-earth approach, Rambus demystifies complex market trends, helping his followers navigate the challenges of today's volatile markets. Join the Rambus Chartology community today and discover a unique blend of technical analysis, trading expertise, and time-tested protocols. Subscribe now at www.rambus1.com or https://rambuschartology.substack.com/


