Three Drivers Of Gold Prices
We cannot value gold. It does not generate any cash flows, which we could discount. But it doesn’t mean that the price of gold changes randomly. Market sentiment is powerful in the precious metals market – but the same applies to other markets (after all, humans are emotional creatures). However, it does not operate in a void. Actually, there are some important fundamental drivers at work. Just like in the cosmos. It seems to be empty space – but gravity works there. Similarly, the precious metal market seems to be very emotional and without any logic, but when you look closely, you will discover important forces in action. What are they?
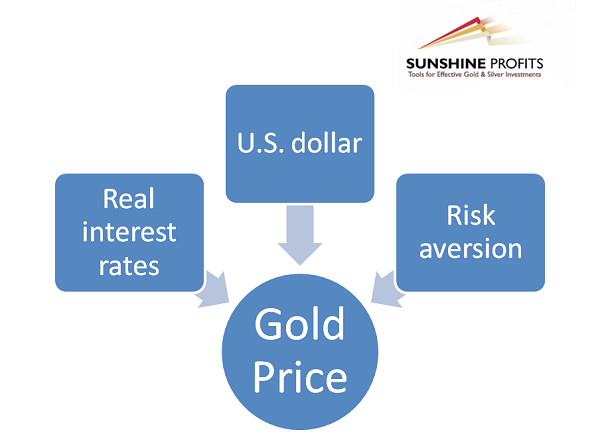
Our research has shown that the most important elements in the gold’s puzzle are: the real interest rates, the U.S. dollar, and the risk aversion (although its less seen in the data). It’s the Golden Triad of Gold’s Drivers (see the diagram below). Let’s analyze them.
Diagram 1: Golden Triad of Gold’s Drivers.

Real Interest Rates And Gold Prices
Why do the real interest rates matter for gold? Well, resources are scarce. Everything comes with a cost. Holding the yellow metal in a portfolio is not an exception here. Some costs are clear: storage and insurance of gold. But these expenses are not the main costs. The most important are the opportunity costs for foregone interests. Instead of holding gold, investors could be lending it (or the cash spent) out. The higher the real interest rates, the larger are the opportunity costs of investing in gold, so investors are less willing to hold a lot of the shiny metal (think about the 1980s and the 1990s, when Volcker increased nominal interest rates, pushing the real rates higher). And the lower real interest rates, the smaller are the opportunity costs, so people are more eager to hold more gold. In particular, the negative real interest rates are gold’s real friends (the 1970s or the post-Lehman era are the best examples).
The key is that if on aggregate people want to increase their gold allocation, the only way for that is when the price of gold rises relative to other investment assets. This is because if all people desire more gold, there is nobody there to buy from, so its relative price has to increase to force some bullion holders to sell it. Gold is money, so when all try to hold more of it, its price has to rise.
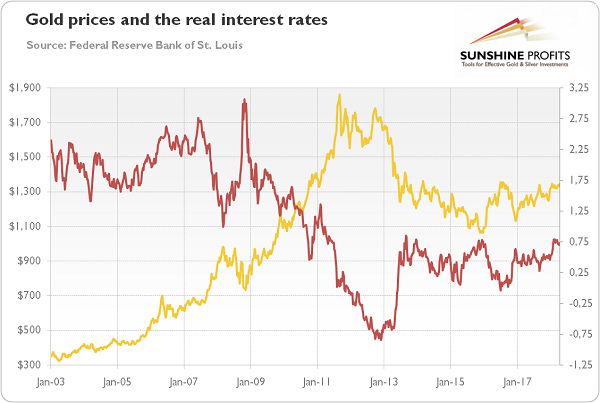
And what do the data say? As one can see in the chart below, the long-term correlation (since 2003) between the real interest rates and the gold prices is -0.87.
Chart 1: The price of gold (yellow line, left axis, P.M. London Fix) and the U.S. real interest rates (red line, right axis, yields on 10-year Treasury Inflation-Indexed Security) from 2003 to 2018 (weekly averages).

U.S. Dollar And Gold Prices
Gold is quoted in the U.S. dollar. So its price rises when the greenback weakens. And it declines, when the dollar strengthens. However, gold behaves like a currency, not a commodity. Therefore, when investors sell the greenback, it depreciates against other currencies, such as the Japanese yen, the euro, and gold. This is why we often see a positive correlation between the euro or the yen’s strength and the price of gold.
But there is something more. Gold is not merely one of many currencies: it is a bet against the U.S. dollar. Although the gold standard was finally abandoned in 1971, the historical association of gold as the ultimate money is still deeply rooted in the minds of investors. Gold cannot be printed and it has been money for thousands of years. This is why it serves as a hedge against black swans, which can land on our current dollar-denominated-system.
According to the statistics, the long-term correlation (since 1973) between the U.S. dollar index and the gold prices is -0.6 (see the chart below). So the link is strong, but a bit weaker than in the case of the real interest rates.
Chart 2: The price of gold (yellow line, left axis, P.M. London Fix) and the U.S. dollar index (red line, right axis, the major currencies index) from 1973 to 2018 (weekly averages).

Risk Aversion And Gold Prices
The function of a hedge against the current financial and monetary system is related to gold being a safe-haven asset, i.e., an asset that is uncorrelated or even negatively correlated with another asset or portfolio in times of market stress. This feature explains why gold is used as insurance against tail risks, or as portfolio diversifier. Hence, when uncertainty increases, investors become more risk averse and demand higher risk premium (as it is seen in widening credit spreads). And they shift some funds into safe-haven investments, such as gold. Similarly, when economic confidence increases, gold struggles.
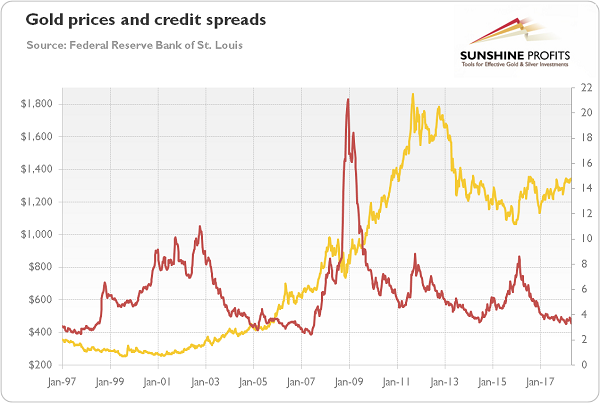
Let’s confront it with the data. The long-term correlation (since 1997) between the credit spreads and the gold prices is 0.17. It is not much, but investors have to remember that it is difficult to quantify the risk aversion – credit spread is only an imperfect approximation.
Chart 3: The price of gold (yellow line, left axis, P.M. London Fix) and the credit spread reflected by the BofA Merrill Lynch US High Yield-Option Adjusted Spread (red line, left axis) from 1997 to 2018.

Conclusion
Gold demand depends on the investors’ psychological perception of the value of gold. Such market sentiment is in turn dependent on a myriad of interrelated variables. The most important are the level of real interest rates, the strength of the U.S. dollar, but also the level of confidence in the economy among the market participants (although it’s hard to quantify it). Low real interest rates, weak greenback and high risk aversion are bullish for gold. High real interest rates, a strong U.S. dollar and low risk aversion are bearish. Hence, when you invest in gold, omit the chaff and focus on these factors – the wheat of profitable investment in the precious metals.
You can, for example, conduct the regression analysis. The simple regression which uses these three factors (weekly averages since 2003) explains about 86 percent of gold price variability. According to that model, the current gold prices are overvalued. It may be the case that there are other factors in play the regression does not cover – or that the yellow metal is likely to fall. You have been warned.
Arkadiusz Sieron


