Trouble is Coming To The Stock Market


Stocks are finishing multiple patterns of varying degrees of trend that look close to completion. Patterns are the market speaking to us. Markets know where they are headed next. These patterns are the accumulated price action from all investors everywhere with all knowledge about everything known on the planet. They measure the group psychology of all investors, with predictive results. The shape of these patterns is language, is communication to us of where stocks are headed. These patterns this weekend are warning that trouble is fast approaching for the stock market.
Tops tend to take longer to form than bottoms, but there is mounting evidence that a major top is close at hand. The following Elliott Wave and Pattern mapping charts take us from the wide lens view, the larger trend, down to the narrow, shortest term micro view to get a full picture for the S&P 500. Elliott Waves move in predictive fashion, giving us insight into the group psychology of all investors, and provide guidance as to when trend turns are likely, and what degree of trend the coming turns will be. These mapping charts are telling us caution is warranted at this time in the stock market.
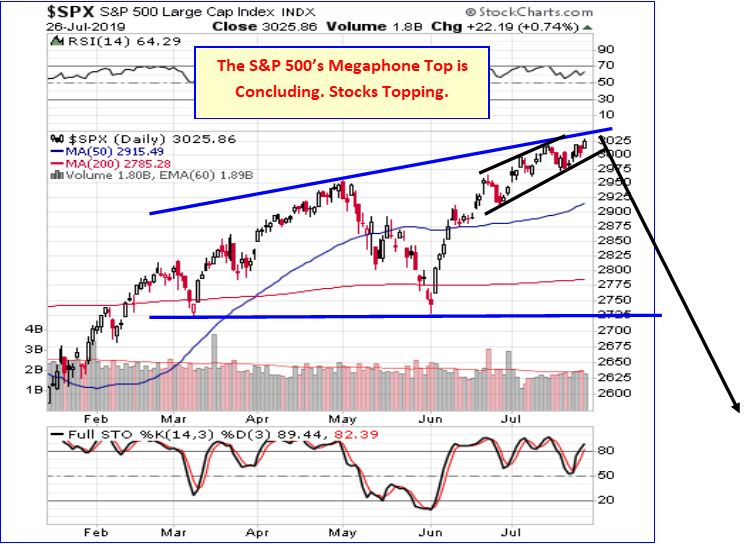
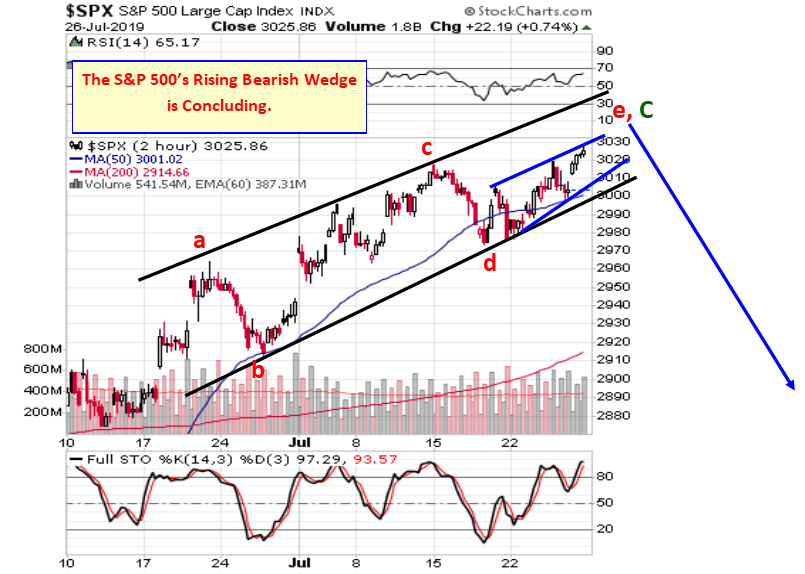
The S&P 500 is completing two huge Bearish Multi-decade topping patterns from 1986, a Jaws of Death Megaphone top pattern and a Rising Bearish Wedge pattern. The moves from waves (D) down and (E ) up are also forming a large Megaphone termination topping pattern shown in chart below. These topping patterns are very close to completion. Once finished, a massive stock market decline is coming.
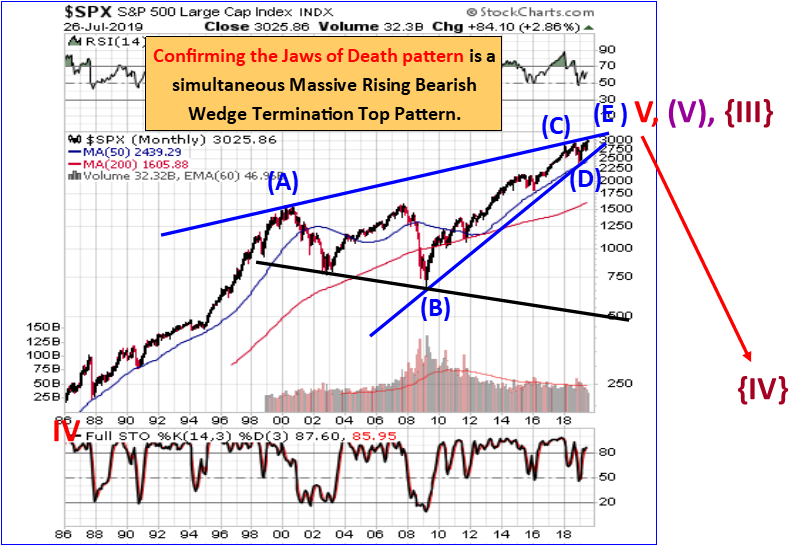

The S&P 500 has also formed and is completing a large Megaphone Jaws of Death termination topping pattern from 2017. This pattern overlaps waves (C ), (D), and (E ) of a Rising Bearish Wedge Pattern.
If so, the upper rising boundary line gives us an approximate upside price target for the end of Grand Supercycle degree wave {III} of 3,050 to 3,100ish. In this case it is likely we just saw the top of subwave A-up of (E ) up, and likely the bottom of B-down. Wave C-up started with June 4th’s powerful rally and is close to completion.
The alternate is that the current top is wave A-up with B-down next.
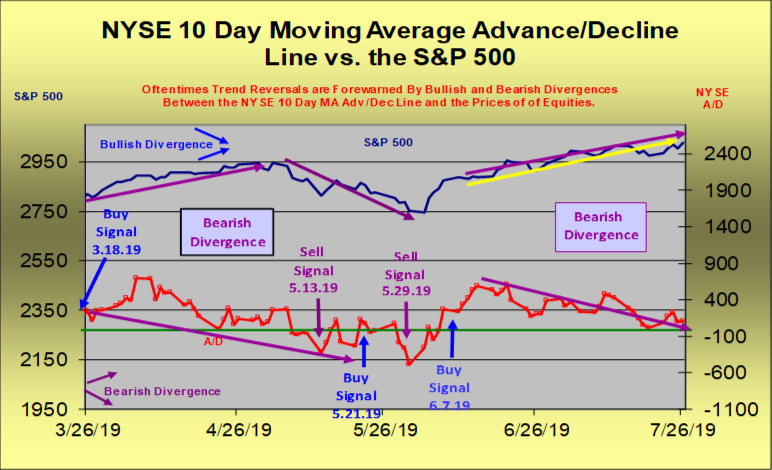
This weekend we want to focus on another set of indicators that are also warning that a significant stock market decline is approaching. If we study the Bearish Divergences between the major averages and their 10-day Advance/Decline Line Indicators, we get a clear message that trouble is near for stocks. Look at the following charts. These divergences are large and growing. No matter how high stocks rise, breadth is not following, and in fact is weakening. This is a classic warning, an early warning, to investors and traders that stocks are topping. The larger the size of these divergences, typically the larger the decline. These divergences are significant.
First, the S&P 500 versus the NYSE 10 Day Average Advance/Decline Line Indicator:
The NYSE 10 day average Advance/Decline Line Indicator has formed a large and growing Bearish divergence with the S&P 500, warning that another large stock market decline is coming.
The S&P 500 plunged after a large Bearish divergence between the NYSE 10 day average Advance/Decline Line Indicator and the S&P 500, warned that a strong decline is approaching. That decline occurred in May.
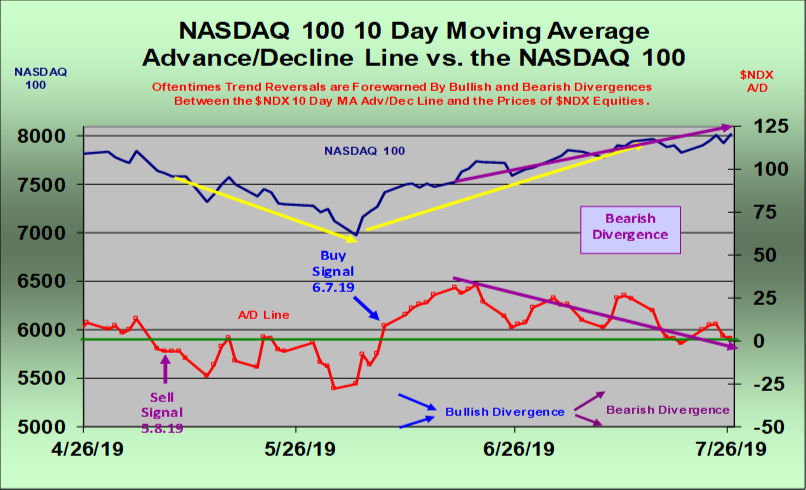
The NASDAQ 100 versus its 10 Day Average Advance/Decline Line Indicator:
There is another large and growing Bearish Divergence between the NDX and its 10 day average Advance/Decline Line Indicator, warning a strong stock market decline is approaching.
The NASDAQ 100 declined sharply from a large and growing Bearish divergence with its 10 day average Advance/Decline Line Indicator, which warned that a decline was approaching. That decline was the May decline.
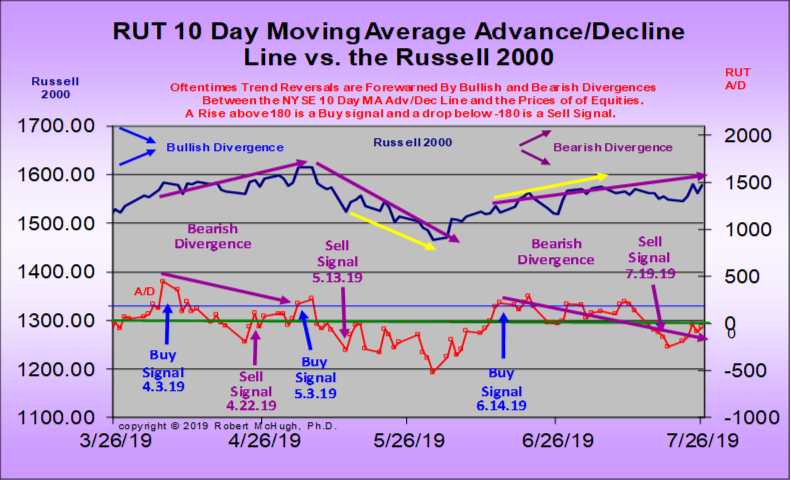
Russell 2000 versus its 10 day Average Advance/Decline Line Indicator:
The RUT has formed a large and growing Bearish divergence with its 10 day average Advance/Decline Line Indicator, warning a strong stock market decline is approaching.
Small cap stocks dropped sharply after our Russell 2000 10 day average Advance/Decline Line Indicator triggered a Sell signal on May 13th, 2019, a signal change that was expected, given the large Bearish divergence evident beforehand.
It rarely feels dangerous to investors as new highs are being reached almost weekly. But watching how volume performs on up days versus down days is revealing. Thursday, July 25th’s strong decline had the highest volume in several weeks. Friday July 26th’s volume, and volume on previous rally days this past week, was lower. This is a sign of distribution of stocks from strong hands to weak hands. The smart money is gradually getting out now.
So, both breadth and volume are warning us that stocks are nearing a top. Then there are the two official Hindenburg Omen potential stock market crash signals on the clock right now, concurrently. It is not good that there are two at the same time. This previously occurred the second half of 2018, which was followed by a year-end crash. The two new official H.O.’s on the clock now are warning us the stock market is fragile at this time. If you want the theory and history of Hindenburg Omens, you can go to our Guest Articles button at the left of the home page at www.technicalindicatorindex.com
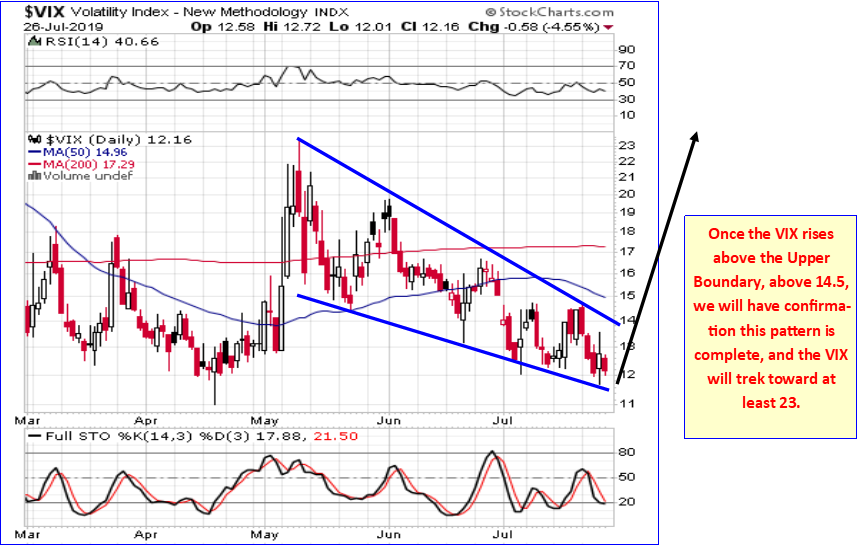
Another concerning factor for the stock market at this time is the VIX. Specifically, the pattern the VIX has formed over the past three months. The VIX is finishing a Declining Bullish Wedge, which has an upside price target around 23, which is typically associated with strong declines in stocks.
It will be interesting to see if the summer trading and investing malaise pushes the worst of the coming decline off until late August into year-end or will the decline start over the next week. Perhaps stocks drift lower over the next several weeks, with oscillating waves down and up and then accelerate to the downside in a month or so. On the other hand, given the dangerous condition the stock market sits in at this time, any black swan event could send this thing down hard in a hurry.
The warnings are clear, abundant, and confirmed by several independent sciences, methods and tools of technical analysis.
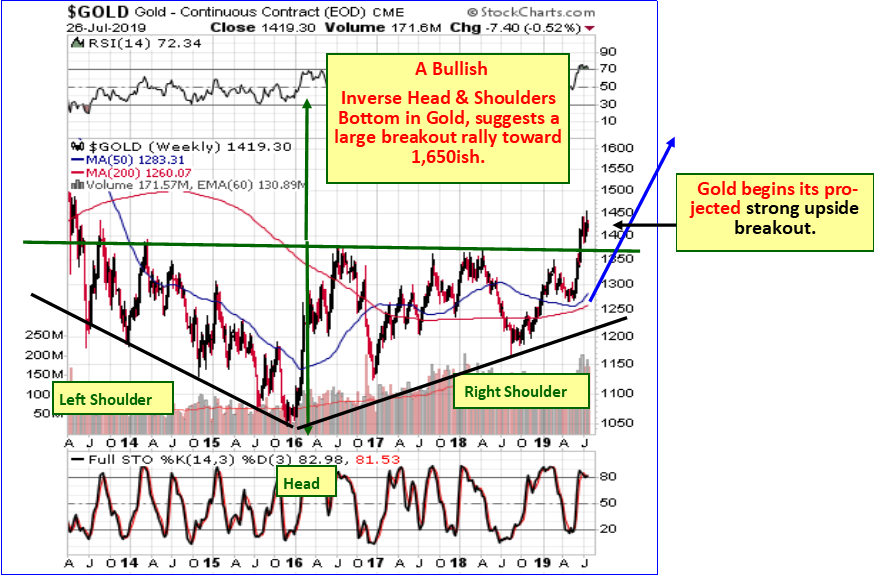
Gold is on a trek toward 1650, with corrective declines along the way. Gold could provide a safe haven once stocks begin their coming decline.
Subscriptions are available for either our Platinum Trading Membership or our Standard Membership at the Subscribe Today or Renew Today button at the upper left of the home page at www.technicalindicatorindex.com
At Dr. McHugh is President and CEO of Main Line Investors, Inc. At McHugh’s www.technicalindicatorindex.com we have developed several proprietary indicators that help us identify when the next significant move is starting for the stock market, Mining stocks, and precious metals, as well as which direction the move will develop. We publish these indicators in every Daily Newsletter to subscribers.
*********


