The Truth About Where Gold Price Is Headed


I will be honest, it has been a long time since I have been excited about gold, but I am starting to like gold once again. I had grown too bored to care what gold did. With the bull market top in 2011, and four years later price continues to founder can you blame me?
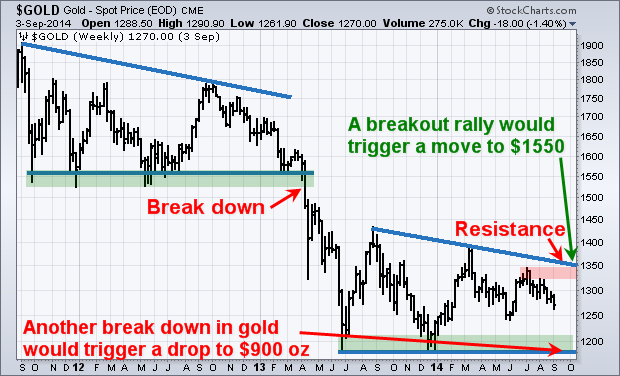
Let me start out by painting a picture for you. This is my technical analysis overlaid on the price of gold. This simply gives you a visual of were the price of gold is trading.
But first, if you have not yet seen this “Gold in the USA” infographic you must check it out… it shows the history of gold in a visual format, and you will likely learn something from it – Click Here
GOLD HOLDS LONG-TERM BEARISH PATTERN
Gold peaked around 1900 in September 2011 and quickly fell to the 1550 area. The metal then consolidated for 18 months before it broke support. The sharp decline triggered a drop in price to $1200 in April 2013. Since then gold has been in another consolidation, which is a bearish continuation pattern.
The lower highs in 2013 and 2014 reflect weakening demand and increasing selling pressure at lower price levels. A break down in price below support would trigger further weakness and a drop to roughly $900 oz. If you want more of a bearish visual; see my August gold report – Click Here
GOLD’S BULLISH OUTLOOK SIGNS OF A BOTTOM
SIGN #1: Gold is technically still in a down trend but it may be quietly forming a bottom. This is how bull markets often start. First it declines in value to a point which breaks the most steadfast bulls. And it does this by relentlessly losing value for an extended period of time. If the market doesn’t shake you out, it will wear you out!
Gold is no longer talked about by the majority of participants, nor is it talked about every day in the media. Simply put, everyone is bored of the low price and sideways trading the past couple of years.
SIGN #2: The key to front running the next rally in gold is to watch the price of gold stocks. They typically lead gold. So when gold stocks start outperforming the price of gold along with the HUI gold stock index we can expect the price of gold to follow a few days or weeks later.
Gold stocks as a whole have not yet started to outperform gold. But if we look at the HUI/Gold ratio it is at extreme levels. This is the same level we saw in 2001 before gold and gold stocks rocketed higher for several years. The ratio is not something you should trade off of, but it’s a good confirmation indicator that gold stocks are priced fairly.
SIGN #3: Looking at what the price of gold has done over the past 40 years 12 months before interest rates have been increased is very interesting and not something many traders know.
With interest rates expected to rise in 2015 this is a statistic that should be reviewed. Numbers do not lie and historical charts show the price of gold rising an average of 20% within the year before interest rates rise. And in case you happen to miss the first 6 months of the move, do not worry. Most of the rally takes place just 6 months before rates go up.
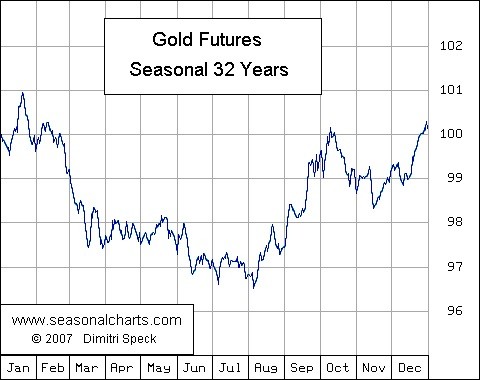
SIGN #4: September is the strongest month for gold each year when looking at the 32 year seasonal chart. The odds favor higher prices this month. Likely not enough to spark a new bull market, but may build a base in the price.
GOLD FORECAST AND CONCLUSION:
One day these weeks gold will breakout down from this consolidation pattern or breakout and rally from this basing pattern. Which way is the question we are all wondering.
Anyone who clearly states gold has bottomed and to buy is taking a stab at being a hero and to say what the masses want to hear. Sure, it sounds great, but it’s BS.
From a price and technical standpoint gold remains bearish or neutral at best. Until price clearly breaks out from this range you should trade with caution and small position sizes.
However, when/if gold starts to rally it is likely best to jump on the train rather than wait for a pause or pullback in price after the breakout. It may just keep on rising until $1550 is reached.
Watch My Daily Gold Video Analysis at www.TheGoldAndOilGuy.com
Automated Investing System for the Average Trader: www.AlgoTrades.net
Chris Vermeulen

Chris Vermeulen has been involved in the markets since 1997 and is the founder of Technical Traders Ltd. He is an internationally recognized technical analyst, trader, and is the author of the book: 7 Steps to Win With Logic
Through years of research, trading and helping individual traders around the world. He learned that many traders have great trading ideas, but they lack one thing, they struggle to execute trades in a systematic way for consistent results. Chris helps educate traders with a three-hour video course that can change your trading results for the better.
His mission is to help his clients boost their trading performance while reducing market exposure and portfolio volatility.
He is a regular speaker on HoweStreet.com, and the FinancialSurvivorNetwork radio shows. Chris was also featured on the cover of AmalgaTrader Magazine, and contributes articles to several financial hubs like MoneyShow.com.


