A turning Point in the Gold Market?


The gold market is showing unmistakable signs of a turnaround that could witness in the coming weeks a bullish move to levels unseen since 1997.
From a technical standpoint, gold still needs a decisive close above $300/oz. to turn the trend from bearish to bullish, and it needs a close above the $312-$315/oz. level to signal the beginning of a major upward trend. Those levels, however, are well within reach and could be attained within the next two weeks. A penetration of these critical resistance levels will provide investors with a major buying signal.
From a fundamental standpoint, gold is definitely in the driver's seat as a form of monetary exchange. As currencies, bond markets, and stock market indices around the world collapse in a massive deflationary depression, gold stands above every other form of money as being free from the underlying fundamental weakness that currently plagues global markets. It is, after all, the only form of money that is not simultaneously someone else's liability. In short, gold is debt free and immune from crises in confidence, which is precisely the fundamental cause of the economic contagion presently enveloping the globe.
Gold's comeback from an atrocious-looking technical outlook began last month when gold futures registered what is known in Japanese candlestick parlance as a "harami" pattern on its candlestick chart. That bullish chart pattern, which formed at the bottom of a steep decline from a "contracting triangle" formation, signaled the beginning of an impressive (not to mention shocking) rise to its current levels, where it is testing the all-important $300/oz. mark. Indeed, gold must be given credit for bucking the bearish trend that has plagued it for the past year and for proving the gold bears (including us) wrong. While it still isn't official, gold does appear on the verge of registering a clear bullish buy signal.
Yet another salient technical feature of gold's chart is the breakout from a bullish "falling wedge" pattern, a chart formation we missed in our earlier analyses (much to our embarrassment). Because of this strong technical move, we are now forced to annul our previous short sale recommendations and are now recommending long positions in certain areas of the gold market, including gold mining stocks. Nearest month put options on futures contracts should also be exchanged for gold calls.
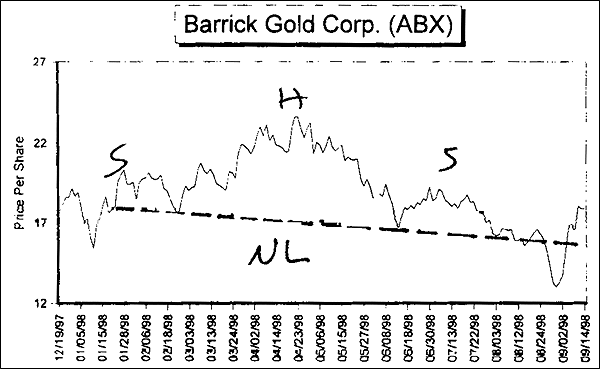
Turning our attention to the gold mining stocks, we see several promising technical features in some of the charts. Barrick Gold (ABX.NYSE), for example, registered a bearish "head and shoulders" pattern over most of this year, but it has now penetrated the "neckline" of the H&S pattern and appears headed for still higher prices. A basic rule of technical analysis (as articulated by the venerable Edwards and Magee) is that a buy signal is given when prices move at least 3 percent above the neckline of an H&S pattern. That is now the case with Barrick.
Battle Mountain Gold (BMG.NYSE) has also decisively penetrated the neckline of a H&S top formation and its price progression looks quite strong. From an Elliott Wave perspective, its "wave dynamics" are looking very impressive and are showing every sign of a strong impulsive move to higher prices. Also, trading volume on this stock noticeably increased when the neckline penetration was achieved, a bullish phenomenon.
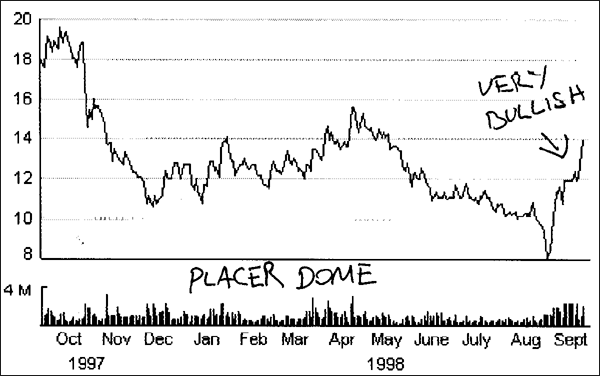
Another bullish gold mining stock is found in the chart for Placer Dome (PDG.NYSE). This chart features a strong breakout to the upside with accompanying volume pickup and has also formed a nice "half mast"—a bullish continuation pattern. Investors should especially look to buy this stock if prices penetrate the next major resistance level at $16 (though it looks to be a buy even now).
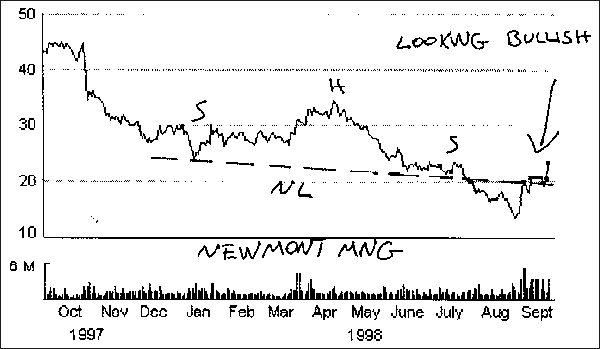
Finally, we note with interest the recent breakout from the neckline of an H&S pattern in Newmont Mining's (NEM.NYSE) chart. As with the above-mentioned stocks, the neckline penetration was accompanied by heavy volume, and a bullish flag pattern is emerging. As long as current levels do not fail, this stock should be considered a buy.
Our analysis of the gold market would not be complete without making mention of the white-hot bullion coin market. Gold coins, especially the U.S. Gold Eagle, are selling like the proverbial hotcakes, and this is intriguing in light of the low prices that have characterized the gold market over the past year. The Wall Street Journal ran a feature story on the strong demand for U.S. gold coins on Sept. 25, and according to the article, sales of U.S. gold bullion coins are on line to eclipse sales levels of 1987—the last year such strong sales were achieved. The Journal article was unable to provide a clear answer to the motive behind such strong buying among U.S. investors. We can be fairly certain, however, that an onrushing freight train named Y2K is one reason. The imminent collapse of the U.S. stock market, we are sure, is another.


