US Banks Precious Metals Derivative Exposure Surged In The Beginning Of 2017


According to the most recent report on the US Financial Institutions Derivatives trading activity, the US banks held a record amount of precious metals contracts in the first quarter of 2017. Not only did the US banks report a record amount of precious metals contracts, they also held a record amount in notional value of commodity and equity derivative contracts.
There just seems to be a lot of paper floating around in our highly inflated stock, bond and Forex markets. And… there needs to be. Without an ever increasing amount of leverage via their derivative bets and hedging, these markets would be in serious trouble. Furthermore, the practice of using contracts to hedge bets upon on other derivative bets has put the financial market in a highly fragile state.
The Office of the Comptroller of the Currency (OCC) put out their First Quarter 2017 Quarterly Report on Bank Trading and Derivative Activities. In that report, they published the following chart on the U.S. Banks notional value in precious metals contracts:
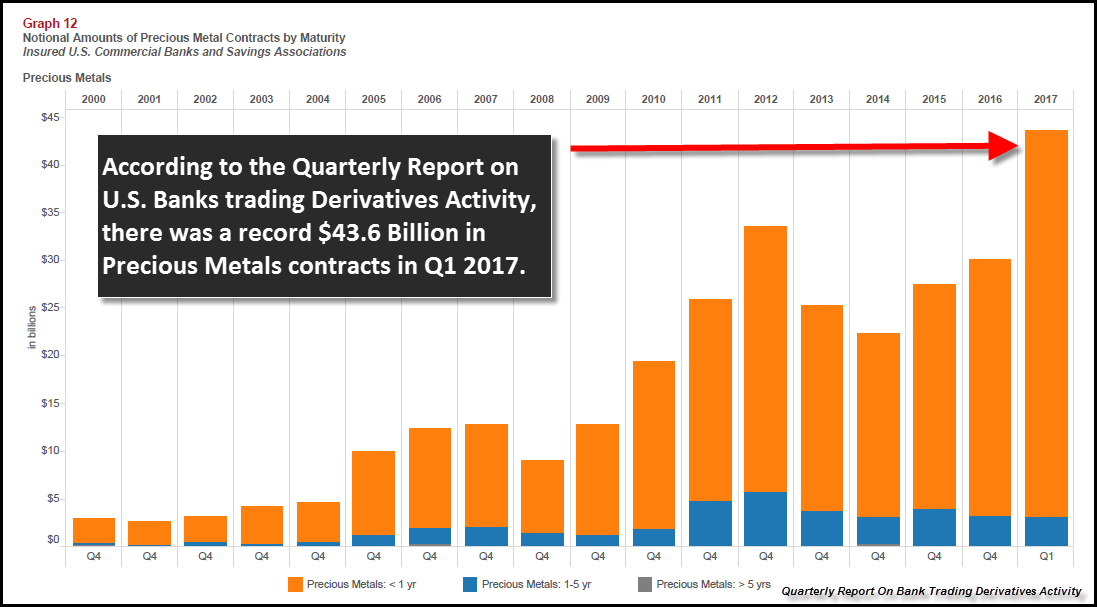
As we can see in the chart, the overall trend has continued higher since 2000. What is interesting is that the notional value of precious metals contracts held by the U.S. banks is even higher in the first quarter of 2017 versus Q4 2012 when the prices of the precious metals were much higher.
In looking at previous data, there were some quarters that had a higher notional amount of precious metals contracts. This was due to the banks adding short contracts as the price of precious metals increased. However, Q1 2017 of $43.6 billion was up considerably versus the $28.3 billion in Q1 2016.
For example, in Q3 2016, U.S. banks also held $43.6 billion in precious metals contracts. Again, this was due to a lot of short contracts held by the U.S. banks when the gold price surged to a high of $1,366 in the third quarter of 2016. As the gold price sold off over the next several months, the precious metals contracts declined in the fourth quarter of 2016:
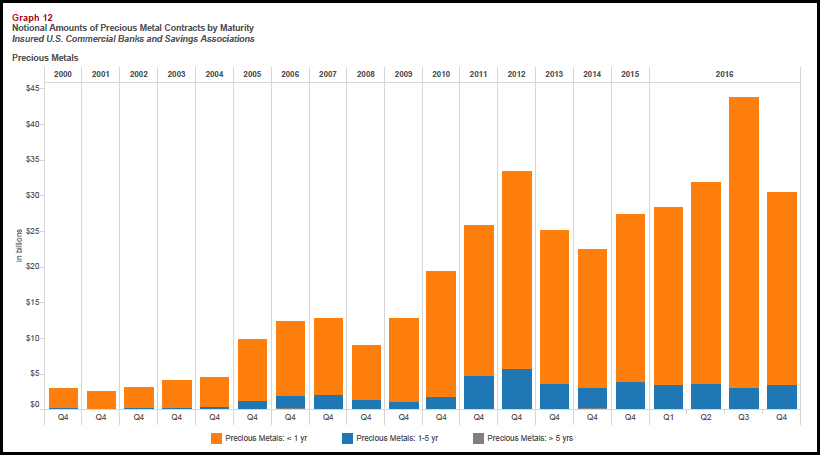
We can see this in the last bar on the chart on the right. But what is quite interesting is the big increase in US banks precious metals exposure in the first quarter of 2017, shown in the first chart above, when the amount of short gold contracts the large U.S. banks held declined significantly in the chart below:
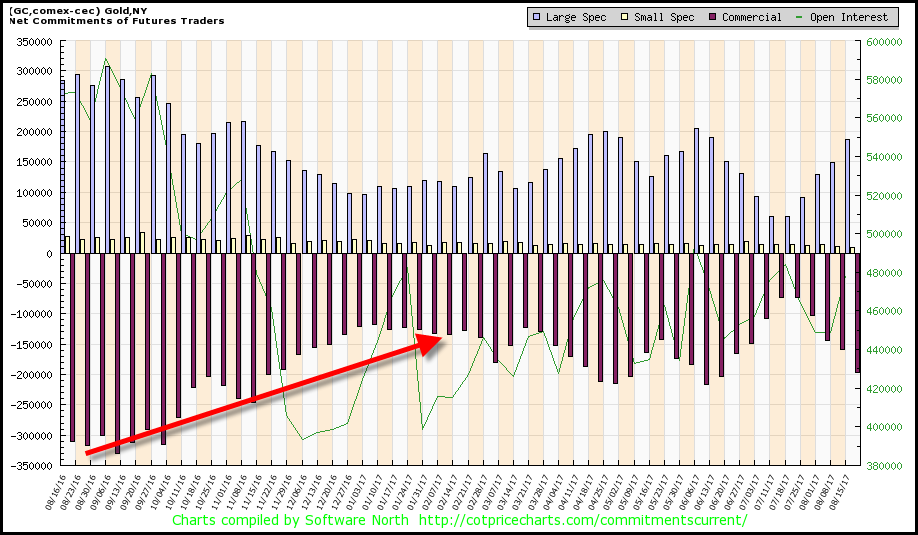
Now, this is only showing the US banks gold contracts. This does not include other precious metals, such as silver, platinum and palladium. However, gold is by far the largest market. If we include the FX contracts (forward exchange contracts), the total notional amount is enormous:
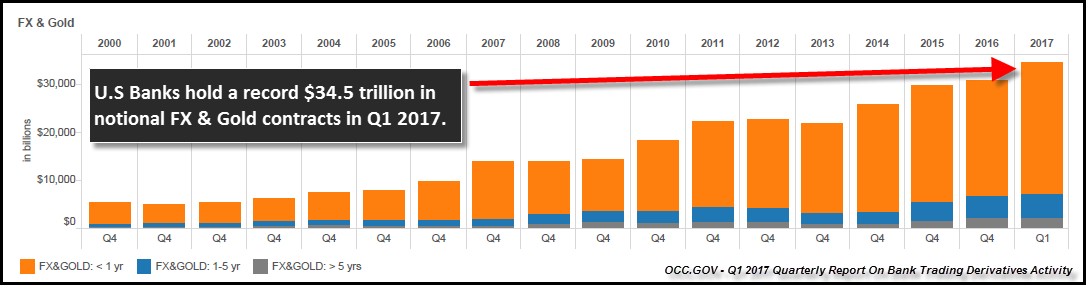
The total notional amount of US banks FX & Gold Contracts was a stunning $34.5 trillion in the first quarter of 2017, up from $30.7 trillion at the end of 2016. Here is the definition of a Forward Exchange Contract by Investopedia:
Forward Exchange Contract: A forward exchange contract is a special type of foreign currency transaction. Forward contracts are agreements between two parties.
Forward contracts are not traded on exchanges, and standard amounts of currency are not traded in these agreements. They cannot be canceled except by the mutual agreement of both parties involved. The parties involved in the contract are generally interested in hedging a foreign exchange position or taking a speculative position.
The nature of forward exchange contracts protects both parties from unexpected or adverse movements in the currencies’ future spot rates.
So, these FX Contracts are hedges on different fiat currencies spot price movements. We don’t know what percentage is hedged in Gold or FX contracts. However, I would imagine the majority being in the FX Contracts that are hedging the different fiat currencies.
Now, what is also quite interesting about the huge increase in the FX & Gold contracts notional values, is that global GDP hasn’t really increased that much since 2013. According to the World Bank, here are the global GDP figures over the past four years:
Global GDP (current US Dollars)
2013 = $76.9 trillion
2014 = $78.9 trillion
2015 = $74.5 trillion
2016 = $75.5 trillion
If we divide the notional amount of FX & Gold Contracts by the global GDP, we can see a very interesting trend:
FX & Gold Contracts Notional Amount Divided By Global GDP
2013 = 28%
2014 = 32%
2015 = 40%
2016 = 41%
What we have here is a great deal more FX & Gold paper amounts trading versus the global GDP. In 2013, the FX & Gold notional amount by the U.S. banks accounted for only 28% of global GDP, however it jumped to 41% in 2016. I would imagine in 2017, it will be even higher.
While the notional amount of FX & Gold contracts has hit a record high, take a look at the next chart:
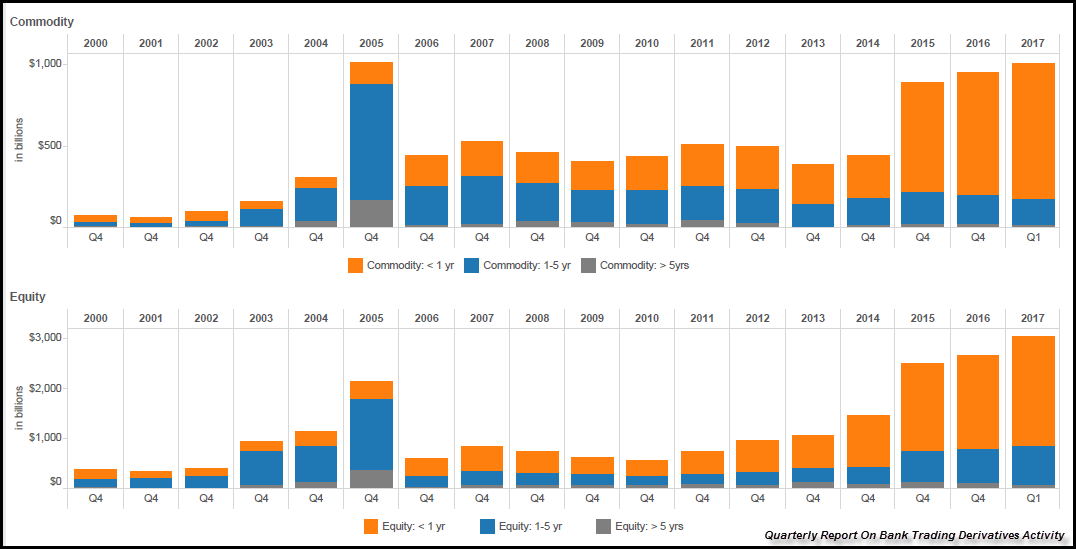
These two charts display the amount of “Commodity” and “Equity” contracts in notional dollar figures held by US banks. While there was a temporary blip in 2005 (mostly longer dated contracts – in BLUE), there was a pronounced increase in 2015, 2016, and 2017 in both of these derivative asset classes.
According to the data by the OCC, the U.S. banks held $1 trillion in commodity contracts and $3 trillion in equity contracts in the first quarter of 2017. While these figures are much less than the FX & Gold contracts, they have still increased substantially over the past three years.
For example, in 2014, the U.S. banks held $431 billion in commodity contracts and $745 billion in equity contracts. In just three years, the US banks exposure to commodity contracts has more than doubled to $1 trillion and their notional amount of equity derivatives has quadrupled to over $3 trillion.
Again…. the U.S. banks are holding onto a record amount of paper derivative contracts in these different asset classes. Yes, it makes some sense that the U.S. banks equity contracts are increasing right along with the rising highly-inflated stock market, but to see the commodity exposure double when the prices of most commodities are much lower than what they were before 2014, is quite interesting:
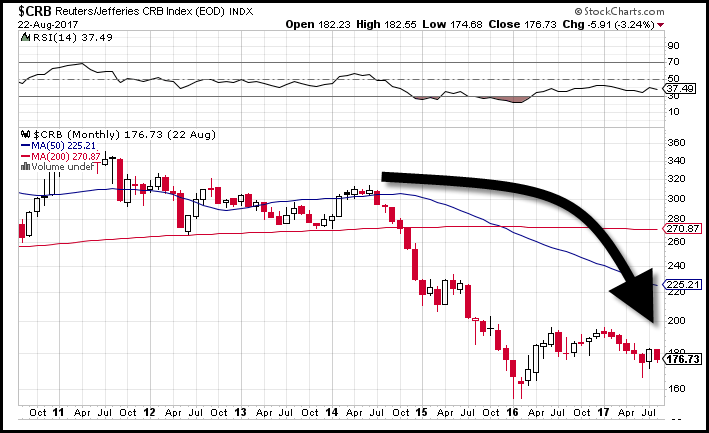
As the commodity index above fell from over 300 in 2014, to 176 currently, the amount of US banks exposure to the commodity market has more than doubled to $1 trillion. Unfortunately, I don’t know all the particulars as to why the U.S. banks have increased their exposure to such a large degree in these different asset classes. However, to see a record amount of paper trading in a market that is already highly leveraged… points to big trouble ahead.
Courtesy of SRSrocco Report.

Independent researcher Steve St. Angelo (SRSrocco) started to invest in precious metals in 2002. Later on in 2008, he began researching areas of the gold and silver market that, curiously, the majority of the precious metal analyst community have left unexplored. These areas include how energy and the falling EROI – Energy Returned On Invested – stand to impact the mining industry, precious metals, paper assets, and the overall economy. He has written scholarly articles in some of the top precious metals and financial websites. Visit his website SRSrocco Report.


