What Do The Charts Now Say About Gold And Silver?


What a difference in the gold and silver prices since yesterday, eh? On the last day of trading in June, both gold and silver hit important technical levels. Gold closed at $1,800, and silver closed at $18.64. And, during early Asian trading, both metals were up nicely.
However, that all changed this morning when the ADP Employment numbers showed a remarkable rebound along with positive news release of another “hopeful” pandemic vaccine. Thus, the stock markets turned around while the precious metals sold off—basically, business as usual.
It should be no surprise when the Fed and central banks are doing everything they can to save the Stock market, which has now replaced the economy. The U.S. and World Markets have become one GRAND CASINO. Nothing makes sense anymore if we look at the fundamentals. This should scare the hell out of investors into owning precious metals, but unfortunately, they are going to head over the financial cliff along with the Fed and central banks.
I wanted to provide an update on the gold and silver price charts as traders still pay attention to them. While traders are currently controlling the paper price of gold and silver, it will be taken over by forces of physical demand as global currencies and the financial system head into the crapper—mark my words.
If we look at the following gold and silver charts, we can see that both metals closed on the last trading day of the month a critical technical levels. According to Stockcharts, using the August Futures contract, gold closed at $1,800, RIGHT SMACK on the $1,800 resistance level:
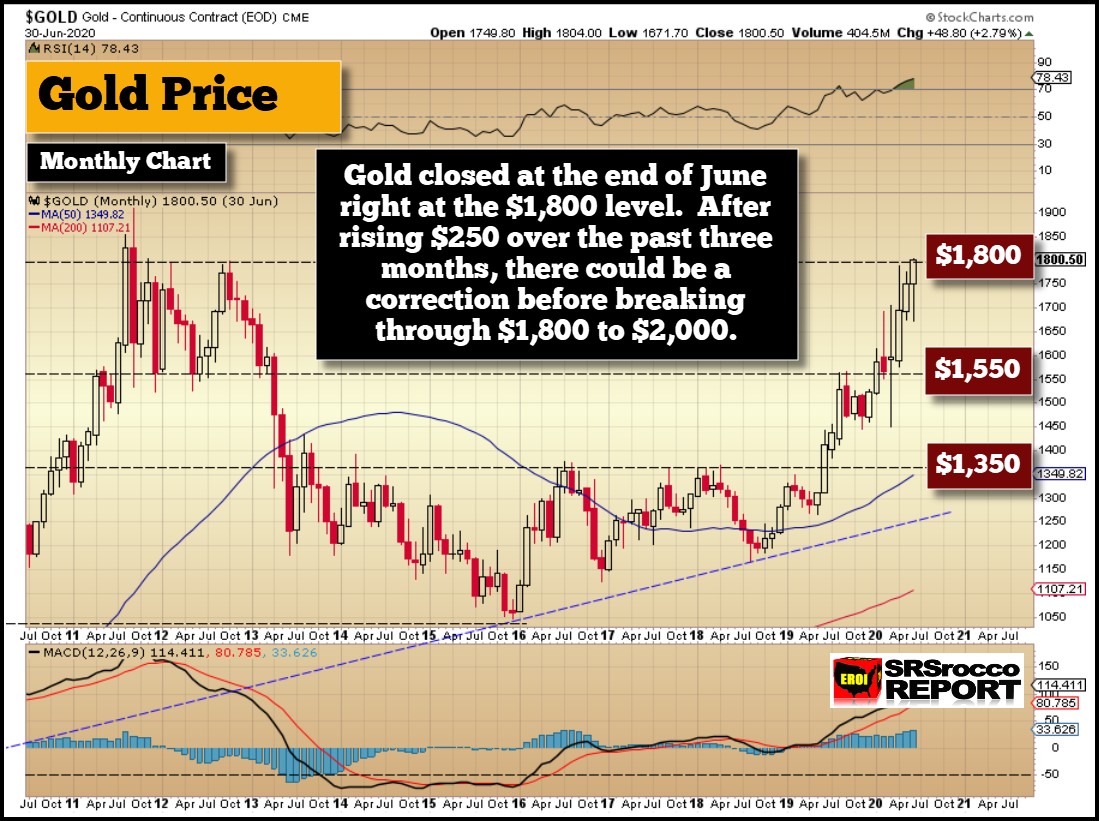
This is a monthly chart of gold, so each candlestick represents one month of trading. The RSI- Relative Strength Indicator shows that gold is now overbought at a 78 reading. So, we may see a correction-consolidation over the next month or two before gold attempts to BREAKTHROUGH that critical $1,800 level on its way to $2,000. Once gold breaks through that $1,800 level, it will likely hit $2,000 relatively quickly.
With the Fed and central banks continuing to prop up the markets with trillions of dollars in the second half of the year, it seems highly likely gold will reach a new record high of $2,000… for starters.
As for silver, it also closed on the last day of June right at the $18.50 level (September Futures Contract). Even though silver traded above $18.50, it hasn’t closed above it on a monthly basis.
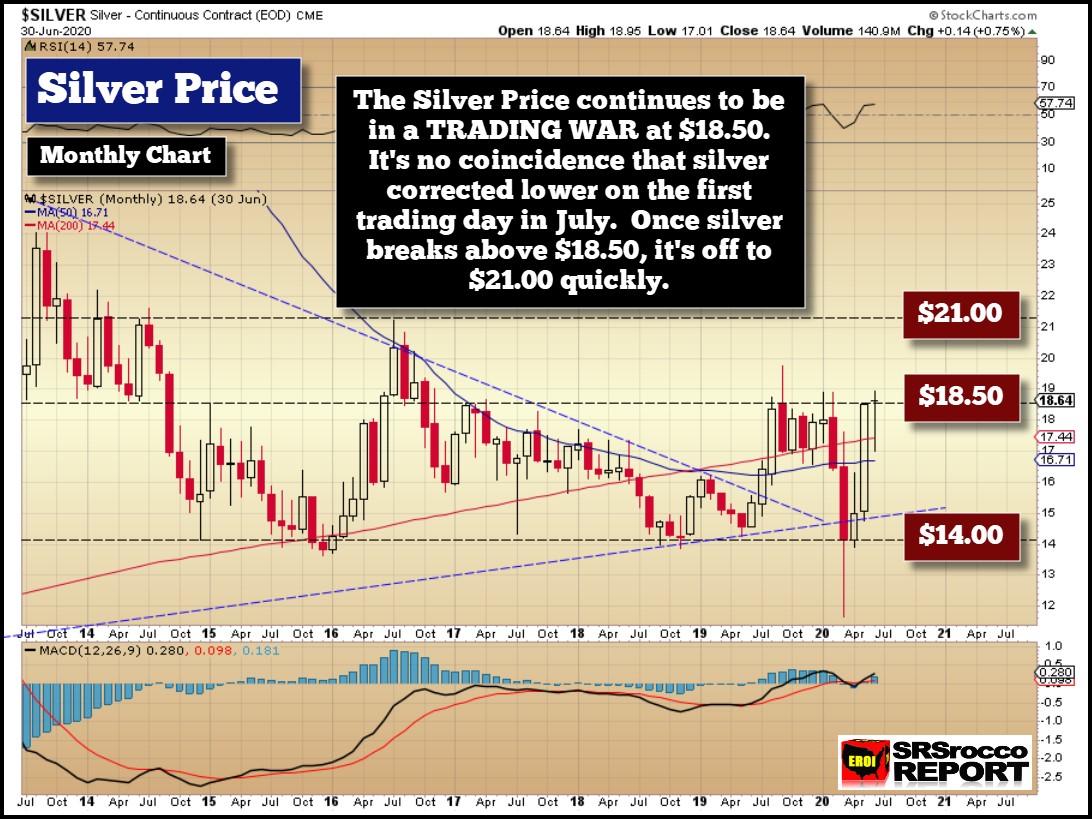
As you can see, the first attempt for silver to break above $18.50 was during September last year when the precious metals finally made a nice RUN higher. This marks the 12th month that silver has traded below $18.50 (again, on a monthly basis). It will be interesting to see how silver trades over the next few weeks. Furthermore, while the monthly gold RSI is overbought, silver is not. Silver’s RSI is only 57. An RSI of 70+ is overbought.
However, if the broader markets begin sell-off once again due to more lockdowns of the U.S. economy, we could see the paper silver price decline as well. Regardless, this is only a short-term price trend. I believe we are going to see another SURGE in physical silver bullion buying in the next few months, especially if we see lower paper silver prices.
Actually, if we experience either LOWER or HIGHER silver prices, we could see a surge in buying in both cases. It seems to me that investors are becoming increasingly worried about the financial system and stock markets. All it would take is just 1% of Americans to move into physical gold and silver to push their prices to unimaginable levels.
Pay Attention To The King Base Metal Price… COPPER
The indicator that reveals the health of the real economy is the COPPER price. Copper also closed at a significant technical level on the last trading day of June. Copper has been trading below the descending line (DASHED BLUE LINE) since the end of 2017. If copper does not close above this level, it could continue to be weaker for the remainder of the year.
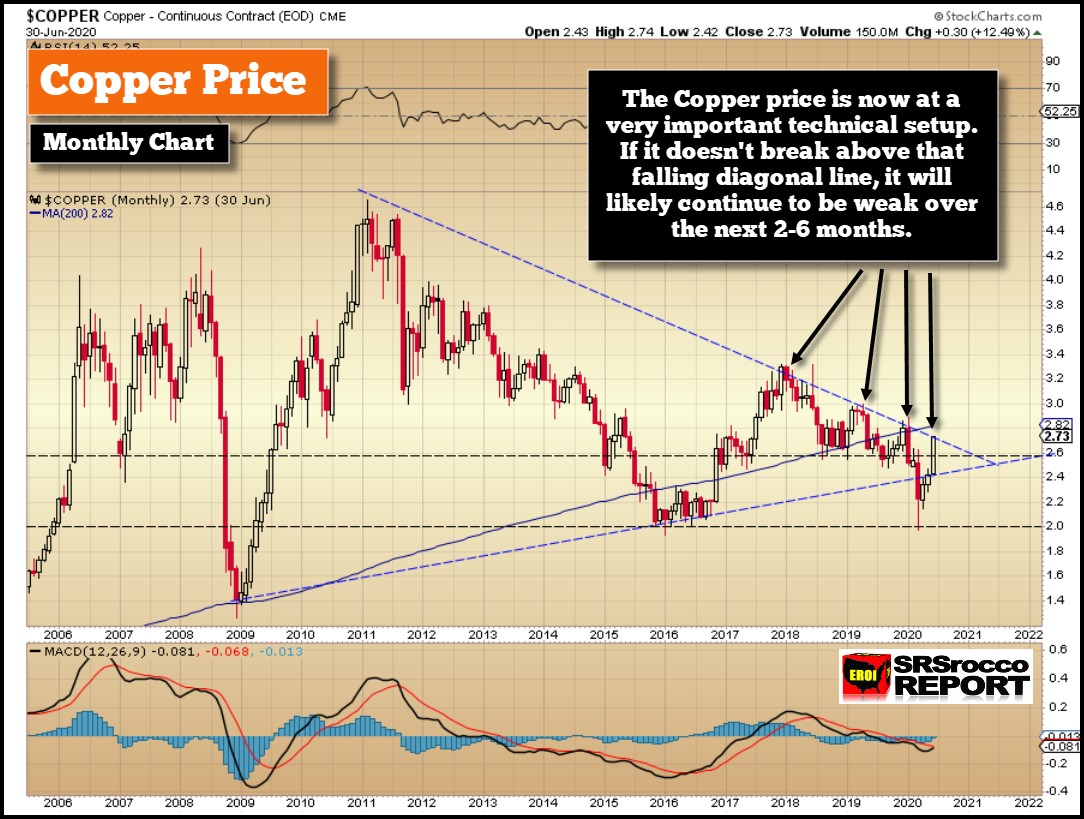
I see two possible scenarios. FIRST, If the Fed and central banks go HOG WILD with money printing, that would push the stock markets to new highs. This would also cause the copper price to rally. If copper breaks through this downward descending line, it could surge higher.
SECONDLY, if the global contagion continues to spread into a larger second wave, we could see countries initiate more lockdowns. If so, then I see continued weakness in the copper price for the remainder of 2020.
Lastly, because the stock markets have totally disconnected from the underlying economy, it has provided a golden opportunity for investors to get into precious metals on the cheap, especially silver. We must remember, global assets are valued over $450 trillion while physical gold and silver investment stocks are worth approximately $4.5 trillion… or 1%. When investors start to move out of STOCKS, BONDS, and REAL ESTATE to protect wealth in precious metals, there is only a limited amount of PHYSICAL GOLD & SILVER CHIPS.
*********

Independent researcher Steve St. Angelo (SRSrocco) started to invest in precious metals in 2002. Later on in 2008, he began researching areas of the gold and silver market that, curiously, the majority of the precious metal analyst community have left unexplored. These areas include how energy and the falling EROI – Energy Returned On Invested – stand to impact the mining industry, precious metals, paper assets, and the overall economy. He has written scholarly articles in some of the top precious metals and financial websites. Visit his website SRSrocco Report.


