Why Inflation Is 'Baked In The Cake' And Gold Is Moving Up


Driven by the need to decarbonize due to increasingly apparent climate change, governments around the world right now are choosing to de-invest from oil and gas, and instead are plowing funds into renewable energies even though they aren’t yet ready to take the place of standard fossil-fueled baseload power, i.e., coal, oil and natural gas.
We have seen this foolish endeavor playing out in Europe, where natural gas prices have hit records due to coal plants being shut down as well as nuclear plants shelved, such as in Germany and France. The skyrocketing cost of electricity is being borne by ordinary citizens who didn’t vote for this dumb policy of “premature decarbonization”.
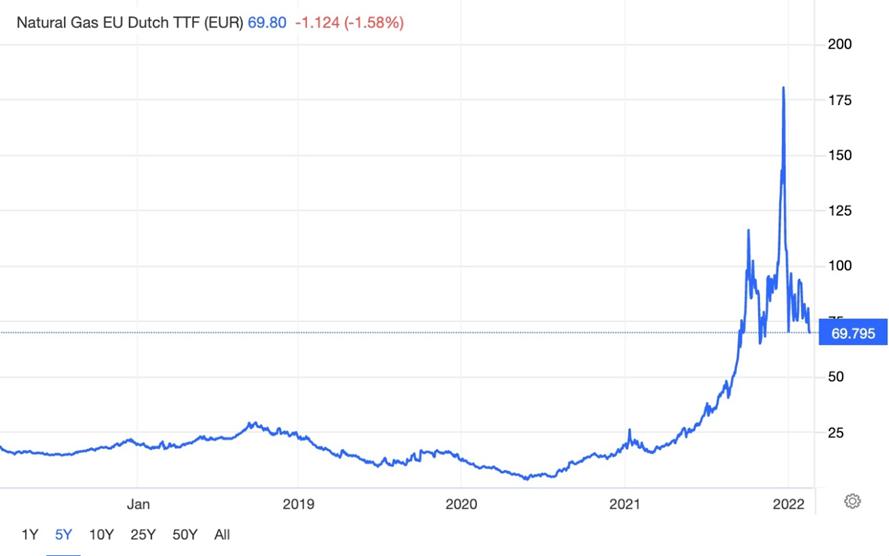
EU natural gas prices. Source: Trading Economics
Saudi Arabia has warned that, without re-investing in the oil industry to find more deposits, the world could be short 30 million barrels a day in eight years.
In the current under-supplied environment, high oil and natural gas prices will be with us for the foreseeable future, with a knock-on effect on inflation, more “sticky”/ long-lasting than transitory.
Oil and inflation
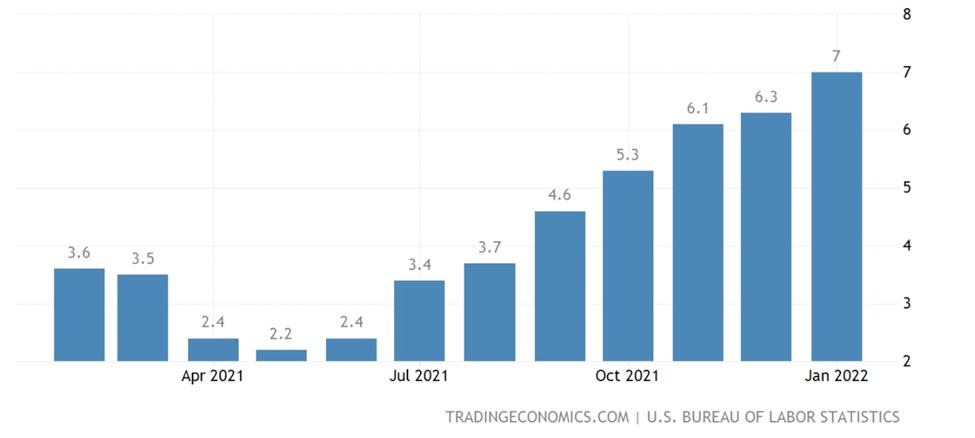
The latest inflation statistics show the US Consumer Price Index (CPI) up 7.5% in January — a 40-year high. Canada’s inflation rate hit 5.1% last month, the most since 1991.
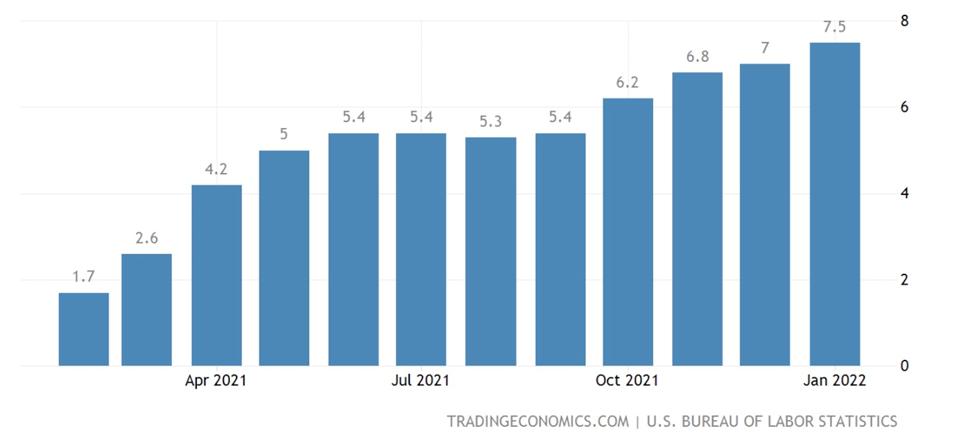
US inflation (CPI). Source: Trading Economics
To understand the current inflationary cycle, where prices are rising everywhere and in everything, including energy (home heating), transportation (gasoline), food, housing, wages, metals, and other raw-material inputs of manufactured goods, we need to talk about the oil market.
Energy remains the biggest contributor to CPI inflation, in January representing 27% compared to 29.3% in December.
Oil and inflation are linked because oil is such a major input of the global economy. Despite billions being spent on new solar and wind farms, the world still largely runs on fossil fuels.
If energy costs rise, so do the prices of end products. For example, plastic. A lot of manufacturers package and sell their products in plastic, but plastic is made from petroleum. When oil prices go up, plastic costs more, and this must be absorbed by companies that use it for packaging. To preserve their profit margins, they charge customers more for their products.
The same things happens with transportation costs. Most goods are shipped by ocean freighter, railed to large distribution centers, and trucked to their final destination. Intermodal transportation is fueled by oil and gas, so when oil goes up, companies that ship their products pay more for freight, then pass these costs onto their customers.
As energy prices rise, each stage of the supply chain ends up costing more, causing an inflationary spiral. Expectations of further inflation, when people rush out and buy goods before they go up, make the spiral even worse.
In the 1970s, when the price of oil rose from $3 a barrel before the 1973 oil embargo to over $30 after the 1979 oil crisis, the CPI more than doubled.
Although the correlation between oil prices and inflation is weaker now, due to more services versus goods in the US CPI “basket”, it is prevalent in the Producer Price Index (PPI), which measures the wholesale prices of goods. Here, the correlation between 1970 and 2017 was 0.71 (a perfect correlation being 1), according to the Federal Reserve Bank of St. Louis.
Tight oil market
The coronavirus caught the oil market off guard. Unlike in 2014, when a wave of supply swamped prices, in early 2020 a sudden demand shock due to the onset of covid-19 pushed crude as low as -$40/bbl. Briefly, and unthinkably, oil became like a waste product, something you had to pay people to take away.
Shell cut its dividend for the first time since the Second World War and tens of thousands of oil workers lost their jobs.
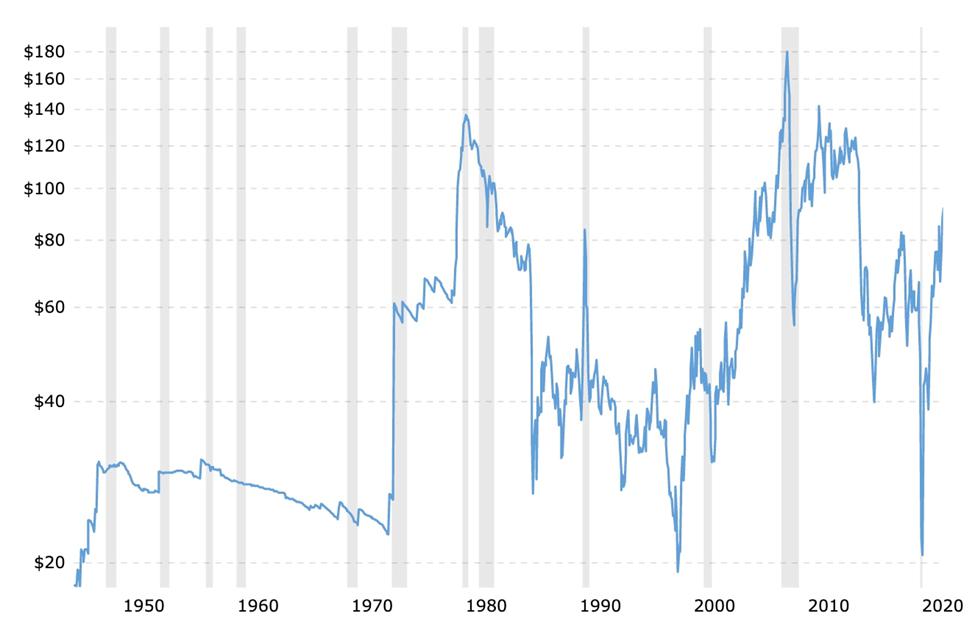
Historical West Texas Intermediate (WTI) price. Source: Macrotrends
Since that historic plunge, crude oil prices have more than quadrupled.
What oil producers didn’t expect was how fast demand would return. Despite repeated waves of infections and lingering restrictions on business activity and the aviation sector, the global economy has grown faster than expected. (the IMF’s World Economic Outlook expects 6% in 2021 and 4.9% in 2022)
Consumer and business spending has focused more on manufactured items, which as mentioned are oil-intensive to produce and transport, than in-person services, where infection risks are higher.
On the supply side, we are talking about some of the tightest global petroleum inventories in years. Commercial inventories held by OECD countries at the end of December were 2.68 billion barrels, compared to 3.21 billion in July, 2020. This was the lowest seasonal level since 2013, as the chart shows.
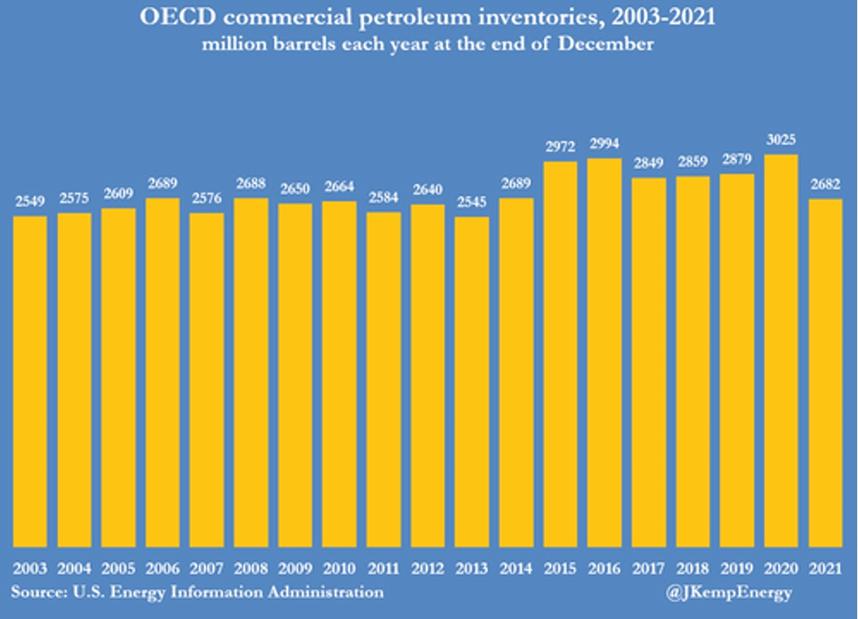
Source: US Energy Information Administration
The US Energy Information Administration’s (EIA) short-term energy outlook, dated Feb. 8, states There is no precedent for such rapid depletion of stocks in recent decades and the EIA estimates stocks have fallen further in January and February.
Concern over the availability of sufficient oil has pushed Brent crude futures about 25% higher in the last two months.
Whereas previously high oil consumption cycles were matched by increased production by some of the world’s top oil producers, including Saudi Arabia, Russia, the United States and Canada, this time is different.
The OPEC+ group of major oil exporters have refused to boost output faster, citing the risk to prices of another drop in oil consumption, should a new wave of infections materialize.
This has left the market chronically undersupplied, with prices ratcheting higher.
Outside the Middle East, oil producers in Africa, Latin America and Eurasia are struggling to increase output after decades of underinvestment, mismanagement, corruption and civil unrest, explains John Kemp, senior market analyst at Reuters.
A war between Russia and Ukraine would be a “black swan” event for oil & gas supplies.
There is the potential for Russian gas destined for Europe to be curbed or halted completely if Russia invades Ukraine. A conflict could also further delay the start of the Nord Stream 2 pipeline linking Russia and Germany. Restrictions on Russian gas exports would likely return European NG prices to record levels, seen last December.
Iran and Venezuela are still under US sanctions, impeding their ability to hike crude exports. In the United States, US shale producers are ignoring calls to increase production, preferring to channel revenues into higher dividends and share buybacks.
These companies will continue to frack away at their reserves, but by the end of this year, the United States is expected to be 760,000 barrels a day below its pre-pandemic production peak.
(At AOTH, we have already written the real story of fracked gas. The US ‘Sultans of Shale’ have had it good for a long time, but the party in the Permian and other US oil shale basins is coming to an end. Not right away, but at most, the fast-depleting shale oil fields which produce via hydraulic fracturing and horizontal directional drilling, are likely to last another few years.
This is because shale oil wells are gushers in their first year, then deplete rapidly. Shale companies are therefore money losers because they have to keep ploughing more money into production just to keep output flat, a phenomenon known as “The Red Queen Syndrome”. Shale wells typically bleed off 70 to 90% in their first three years, and drop by 20 to 40% a year without new drilling.)
A report by earth scientist David Hughes confirms these findings. His Shale Reality Check 2021 rejects forecasts made by the US Energy Information Administration’s forecasts counting on shale for 69% of US oil production from 2020-50 and 77% of all US natural gas production in the same period. Of the 13 major plays he evaluated, Hughes rated the EIA’s production forecast for five as “moderately optimistic,” five as “highly optimistic” and three as “extremely optimistic”.
Oil executives say that low global inventories and limited spare capacity, mean higher energy prices are here to stay.
For Big Oil in Europe, the way companies have dealt with growing pressure to reduce their carbon footprint is to cut production. Also, in early 2021, countries such as Angola, Nigeria and Equatorial Guinea began suffering steep production declines at their aging fields.
The problem is that demand keeps increasing.
The usual energy market dynamics are being overshadowed by the global transition from fossil-fueled energy generation to renewable power sources namely wind, solar and hydro.
As governments and institutional investors divest themselves of funds that traditionally flowed into fossil fuels, i.e. coal/ oil & gas producers, or pipeline infrastructure, they are trying to bring on renewables to replace the lost output. Read more here
The rush to electrification and decarbonization, supported by the likes of the International Energy Agency (IEA), which incredibly, said last year that oil and gas exploration was unnecessary, since we were firmly on the path to net-zero, has prompted Big Oil to reduce investments in exploration, supported by activist investors and environmentalists.
Investing in the oil & gas industry has indeed gone out of favor, with ESG headwinds posing a significant challenge for a sector that badly needs new investments, for production to keep up with demand.
Downstream, the supply-demand imbalance isn’t any better, in fact it’s worse. Prices of refined oil products like gasoline are climbing even faster than crude, driven by short supplies.
According to Vortexa, oil refining can’t keep up with demand. Despite inventories of refined products near historic lows, the London-based energy intelligence firm says that most refineries in Asia and Europe are not planning to ramp up production ahead of regular maintenance in the second quarter — meaning an already tight market may soon tighten further.
Why aren’t refineries upping their runs to capitalize on higher refined product prices? Oilprice.com notes that higher input costs due to soaring NG and oil prices, along with higher carbon tax costs in Europe,are shrinking profit margins for refiners.
Farming input costs mounting
Elevated natural gas prices are also impacting food prices. Food inflation is being driven by record-high fertilizer prices and climate change. Higher input prices are usually passed onto the buyer of meat, fruits and vegetables, for the rancher/ grower to preserve his profit margin.
The fertilizer market has been pummeled due to extreme weather, plant shutdowns and rising energy costs — in particular natural gas, the main feedstock for nitrogen fertilizer.
Modern farming simply cannot do without fertilizer; its higher cost must be borne by producers and so higher food prices are likely going to be “baked in the cake” for several years. Everyone from ranchers to farmers, greenhouse growers and orchardists will be affected.
Fertilizer prices that climbed steadily all last year, are now more expensive. Canpotex has reportedly agreed to supply China with potash fertilizer shipments at $590 per tonne through December, which is more than double last year’s price and the highest since 2013.
Fertilizers Price Index (January, 2022). Source: YCharts
In December the US slapped sanctions on a major potash supplier in Belarus, adding to concerns over global supplies.
“We are seeing a huge impact on global fertilizer markets. The process of making nitrogen fertilizer is very energy-intensive. And we already had supply disruptions. Plus, China has severely restricted the supply of urea, which is used as a nitrogen-rich fertilizer,” Goehring & Rozencwajg Associates managing partner Leigh Goehring said recently.
Founder of the Wall Street firm, Goehring is one of the leading authorities in commodities investing. We respect his research and have used it to explain copper supply dynamics.
Farmers are having to reduce their plantings due to urea shortages. Any reduction in nitrogen, which must be applied annually, will immediately impact crop yields, severely impacting food staples like corn and wheat.
As if farmers weren’t having enough problems coping with droughts, water shortages, and sky-high costs of feed, seeds and fertilizer, this week a major supplier of glyphosate, the active ingredient in Roundup weed killer, shut down production due to mechanical failures.
Roundup maker Bayer AG declared “force majeure” on Feb. 11. The German pharmaceutical company won’t be able to meet its sales agreements and the repairs could take three months.
Like other farming inputs, glyphosate prices have been on the rise, gaining 25% between January 2021 and November. A UK-based analysis company told Bloomberg the temporary closure of Bayer’s plant will likely lead to a supply crunch and even higher prices.
For most growers, they will have no choice to pass on the added costs to their customers.
Data from the United Nations shows global food prices in January hit their highest level since 2011. Between April 2020 and December 2021, the price of soybeans climbed 52%, and corn and wheat both grew 80%. Coffee prices increased 70% due mostly to droughts and frost in Brazil.
Food prices in the United States rose 7% in January, year on year, with five of the six major grocery store categories, posting increases. Cereals and bakery products climbed the most, at 1.8%, followed by dairy and related products at 1.1%. Grocery prices are up 7.4% for the year.
US food inflation. Source: Trading Economics
Oil demand to exceed pumped capacity by Q4
Goehring says the “potential big shock” this year is the energy crisis impacting oil, agriculture and food. Well maybe not that much of a surprise, now that we have explained how these elements are related. We mention him again, because what he says next is truly shocking. Goehring warns:
“Demand is running much higher in the oil market than people thought, and supply will be much less than projected. In the fourth quarter of this year, we might end up in a situation where demand could very well surpass total pumping capability. The reason why it’s important is that we’ve never been there before. Even if we go back to the great oil crisis in the 1970s, we never even got close to global pumping capability. However, we are very close today.”
Let that sink in for a few seconds. The amount of oil being pumped could, this year, for the first time ever, fail to meet the demand for it. Imagine what that could mean for energy prices.
Goehring sees oil prices trading in the low $100/bbl in the next couple of months and then surging toward $150, corresponding to “seasonality”, i.e., the end of the fourth quarter when oil demand for the year normally peaks.
“We should be building inventories right now, but we are still severely drawing inventories. The demand is much stronger than expected,” he says. No kidding.
Broad-based inflation
In March, the US Federal Reserve is expected to raise interest rates by 50 basis points (+0.50%), to quell inflation that is currently running at 7.5%. Another 25 basis points could follow, bringing the Federal Funds Rate to between 0.75 and 1%.
The problem we have with this plan, and other analysts agree, is it’s too little, too late.
As mentioned earlier, inflation is rising everywhere and in everything. If we take a broad-based measure of inflation, by combining the Consumer Price Index (CPI) with the Producer Price Index (PPI), then adding assets (real estate and equities) to the equation, we find that inflation over the past year is showing a double-digit increase (higher than 7.5% CPI and 9.7% PPI). In fact The Carson Report argues this current inflationary cycle is as big as the 1970s, the dot.com tech bubble and the 2007 housing bubble, combined.
Financial blogger Bill Blain dismisses the commonly held belief, repeated ad nauseum by mainstream media, that current inflation is covid-driven and temporary.
“My perception today is inflation is now thoroughly embedded in the economy,” he writes, making the point that “Inflation is driven not just by the prices of money, but by scarcity, wage demands, producer debt, and currency fluctuations.”
“All of these are unstable and will see inflation rattle and roll markets for years rather than months. On top of that, put a layer of expectations — which will get progressively worse — and they trigger a vicious negative feed-back loop of inflation reinforcement.”
Another point that is rarely raised about inflation, is the impact of climate change, particularly on agricultural commodities that are affected by droughts and flooding. Paraguay was hit by a drought late last year that has badly damaged crop yields and caused navigation problems in the Paraguay-Panama waterway, pushing up the costs of transporting grains for export. Neighboring Argentina, the world’s top exporter of processed soy, is also facing the risk of drought diminishing soy and corn harvests. Dry conditions often cause forest fires that can ruin crops and kill livestock.
Flooding and saltwater intrusion are also threats to farming, especially in coastal areas vulnerable to rising sea levels. The latest projections by the National Oceanic and Atmospheric Administration (NOAA) have levels increasing by a foot by 2050, threatening to inundate cities including Miami and New York.
Last fall’s “atmospheric rivers” in southern British Columbia caused nearly half a billion dollars in flood damage to one of the province’s most important regions for fruits, vegetables, eggs and dairy products. The B.C. Agriculture Council says the freak weather events will cost farmers “hundreds of millions of dollars”. The B.C. Dairy Association estimates 500 cattle died from Fraser Valley flooding.
Why interest rate hikes are different
History tells us that previous Fed rate hikes to deal with uncomfortably high inflation resulted in recessions.
Consider: during the 1970s consumer price inflation averaged 7% during the decade. To tackle it, then-Fed chair Paul Volcker dramatically raised interest rates. From 11.2% in 1979, Volcker and his board of governors through a series of rate hikes increased the Federal Funds Rate to 20% in June 1981. This led to a rise in the prime rate to 21.5%, which was the tipping point for the recession to follow, lasting two years.
In the 1980s inflation was running at 6% by the end of the decade. To break the price cycle, policymakers lifted interest rates to near 10%, causing a recession and a banking crisis in the early 1990s.
The 1990s saw the formation of a stock market bubble, during which the S&P 500 gained about 25% per year and the Nasdaq posted annual gains of nearly 60%. Upon the Fed reversing its easy money (low interest rates) policy, equities fell hard, causing a mild recession in 2001, and a stock market correction that lasted three years.
To cushion the plunge in equity prices, the Fed maintained an easy money policy, leading to a new inflation cycle in the 2000s that focused on real estate. Housing inflation was around 10% per year from 2001 to 2006, about five times the rise in general inflation. The housing bubble popped when monetary policy and credit conditions tightened, triggering the Great Recession of 2008-09.
Will his time be any different? It’s hard to say, because the current inflation cycle is unlike anything we’ve seen before. Not only do we have close to double-digit increases in consumer and producer prices, we also have a stock market bubble (although that has corrected somewhat) and a real estate bubble. In the United States, a mix of low interest rates and limited housing supply bid up the price of homes, 11.3% in 2020 and 16.9% in 2021, according to data from Freddie Mac. In January the Canadian Real Estate Association said average house prices increased 21% over the past year, to $784,450, the highest on record.
The Carson Report asks the question we all want to know the answer to: does the Fed engineer a Greenspan-type soft landing (1995) or a Volcker hard-landing? Odds favor a Volcker ending.
In 1995, then-Fed chair Alan Greenspan managed to land the US economy by raising interest rates gradually. He increased official rates 300 basis points over 12 months and the Federal Funds Rate from zero to 3%. Previously, Volcker’s Fed raised interest rates too much too fast, and crashed the economy.
Jerome Powell’s Fed doesn’t have the luxury of a gradual rate rise; if it is serious about quelling inflation that is running hotter than the 1970s, the dot-com tech bubble and the housing bubble combined, it must “go big”.
As Joe Carson states,
Policymakers have misread the full scope of the inflation cycle and need to play catch-up… Even if policymakers act soon and big, the scale and breadth of the inflation cycle still favor a Volcker-type ending.
The difference between now and then, and this is true for both Greenspan’s Fed and Volcker’s Fed, is they didn’t have the excruciatingly high levels of debt, that are threatening to throttle the current Fed’s planned interest rate hikes.
In 1982 the US debt to GDP ratio was around 35%. Today it is more than three and a half times higher, at 128%.
This severely limits how much and how quickly the Fed can raise interest rates, due to the amount of interest that the federal government will be forced to pay on its debt.
In the 2021 fiscal year that ended September 30, nearly $600 billion in interest was accumulated at interest rates close to 0%, and long-dated bond yields under 2%. But rates and yields are going up, and so will the interest payable to bondholders. The Fed is targeting at least three quarter-point interest rate hikes this year (3 X 0.25% = 0.75%).
Each interest rate rise means the federal government must spend more on interest. That increase is reflected in the annual budget deficit, which keeps getting added to the national debt, now standing at a gob-smacking $30 trillion.
Remember, historically, every time the Fed raises rates to attack inflation, a recession occurs.
The most recent example of the Fed attempting a serious interest rate hike was 2015-18. To wean the economy off of ultra-low interest rates, in 2015 the Fed gently increased the Federal Funds Rate a quarter percentage point, from 0.25 to 0.5%. In a series of subsequent raises, the Fed tightened from 0.5% in December 2015 to 2.5% in December 2018.
We all remember what happened to the economy. For three months the stock market plunged nearly 20%, before Powell relented, and began loosening again. A series of rate cuts saw the Federal Funds Rate fall from 2.25% on July 31, 2019 to 0.25% on March 15, 2020, which is where it remains.
Surely the Fed knows the history. If it decides to aggressively attack inflation, with rate hikes greater than 2% in 2018, which crashed the stock market, it risks killing the economy again, bankrupting businesses and worst of all, throwing the US consumer to the wolves, to deal with a double-whammy of higher interest payments on mortgages and other loans, plus credit card interest rates north of 20%; and inflation close to 10%, the worst in four decades. Consumer spending is worth 70% of the economy. The Fed, and the country, can’t afford to have them stop spending.
Conclusion
In the 1970s the Fed raised interest rates to 20% to fight inflation that was running about 10%. The ‘70s and ‘80s saw rampant consumer and producer price increases but not housing inflation nor equities inflation.
During the 1990s there was a stock market bubble culminating in the dot-com crash, but inflation was low, around 2-3%. The 2000s saw a real estate bubble forming, and bursting, following the sub-prime mortgage crisis and Fed tightening.
Each previous inflationary cycle had one, at most two, aspects of inflation, but never have there been all three, as currently. We are clearly sailing into uncharted waters.
Previous Fed attempts to control inflation with interest rate increases have resulted in a recession. The Fed is currently targeting a very mild raise, to 1% by the end of this year. Others are more hawkish. JP Morgan has joined Bank of America in calling for seven rate hikes in 2022. Even at 3-4%, this will not be enough to improve broad-based inflation that is currently nearing double digits or is already there.
(As we have pointed out, the government does not calculate inflation like it used to. John Williams’ Shadow Government Statistics shows actual inflation today using 1980’s methodology is 15%, not 7%.)
There is no way the Fed can hike interest rates to the same extent as previous Federal Reserves have.
The reason starts with the earlier discussed problem of energy inflation. High oil and natural gas prices are causing painful increases in farming inputs like fertilizer and weed killer. This in turn is hiking the price of food.
Governments have shirked investments in oil and gas exploration, preferring to put it all into renewable energy, but this foolish endeavor, combined with the closure of coal plants and nuclear plants, has raised natural gas prices to record levels. Crude oil is heading to $100/bbl and could be $150 by year’s end. For the first time ever, pumped oil supplies could fail to meet demand.
The situation we are heading into is dire. The Fed needs to act boldly to arrest inflation that is already high and moving higher. Yet the central bank is severely constrained in how much it can raise interest rates, due to the $30 trillion national debt. Each interest rate rise will mean much higher interest payments, which are already at nearly $600 billion.
At a projected annual deficit of $1.3 trillion, by 2032 we could be looking at a national debt of $43 trillion. That would push interest payments on the debt well past $1 trillion, we believe, equivalent to one-quarter of annual US government revenues.
The Fed’s dual mandate is to control inflation, keeping it under 2%, and to keep the economy humming along at near full employment. Cynics will argue that in fact, what the Fed has done over the past 13 years is to create hyperinflation among financial assets (we have long argued that quantitative easing has kept inflation at bay because it stayed within the financial system), while doing everything it can to keep “real world” inflation subdued.
There is a line of thinking out there that the Powell Fed’s intention is to go hostile, that the only way it is able to fight the level of inflation that has permeated the economy, is to “crash the market”. If you think about it, this is precisely what Paul Volcker’s Fed did in the early 1980s and it is what Powell tried to do, but failed to, in 2018, beyond a three-month stock market pullback. Here is Zero Hedge on the topic:
Citigroup’s finance guru, Matt King, has suggested that the Fed can only bring down inflation by curbing demand, in which case it will need to slow growth in order to ease inflation pressures… although King also warns that while the economy needs many more rate hikes to remove the inflationary overheating, stocks will crash long before this terminal rate is hit, writing that “neutral rates for markets [are] likely well below neutral for the economy.”
The publication also quotes former New York Fed official Zoltan Pozsar saying that “the Fed needs to crash the market to contain stocks.”
And while most market observers believe we are far from a market crash, there are signs that US growth is slowing after enjoying a rip-roaring pandemic recovery. (CNN reports the US economy expanded 5.7% last year, the fastest pace since 1984)
On Monday, Feb. 14, Goldman Sachs put out a note saying that the sharp drop in risk assets (i.e. stocks) may not only be due to increasing geopolitical concerns over Ukraine, but also “the potential the economy may be slowing more than expected.”
Quoting in full, the note states:
The combination of increasing geopolitical concerns and the potential the economy may be slowing more than expected sent the VIX [the Chicago Board Options Exchange’s (CBOE) Volatility Index] back up to 24, and drove a decline in equities as investors turned to bonds and gold — both traditional investor perceived ‘safe havens’.
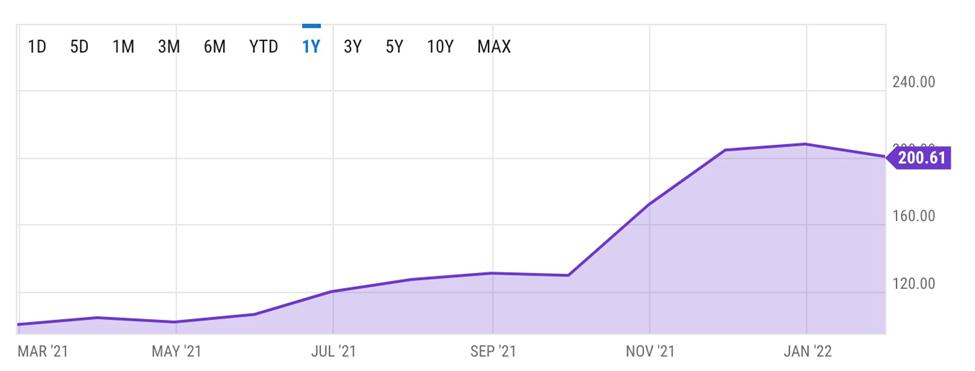
As if on cue, spot gold rose about $50 between Feb. 11 and Feb 15, and jumped again on Thursday, Feb. 17, soaring past $1,900, for the best performance in eight months.
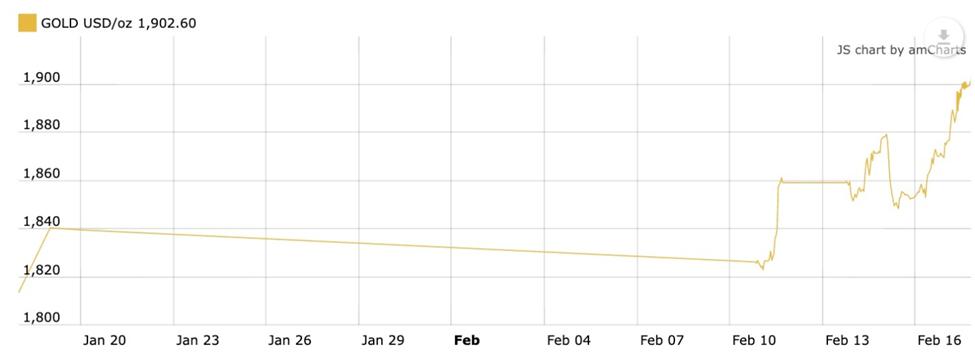
1-month spot gold price. Source: Kitco
What impact will the expected Fed rate hikes have on gold? Well, initially they will be negative. Because gold does not pay a dividend or a yield, some investors will shift funds over to government bonds whose yields are already going up in anticipation of rate hikes.
But remember what happened when the Fed tried this in 2018. They only got to 2% when the stock market tanked, prompting them to reverse course, and re-instate low interest rates.
We predict the same thing will happen this time. When it does, get ready for the next big move up for gold.
It’s interesting to note that gold has in fact performed quite well despite recent increases in US 10-year Treasury yields and the US dollar index DXY, both of which are strong determinants of the gold price, from multi-month lows. Why? According to Bank of America strategists, “There are significant dislocations buried beneath headline inflation, interest rates and currency moves, raising the appeal of holding the yellow metal in a portfolio and supporting our $1,925/oz average gold price forecast for 2022.”
Analysts at UBS, a Swiss bank, think the gold price is being supported by “elevated demand for portfolio hedges,” noting that gold has done better than other portfolio diversifiers including bitcoin, whose value lately is more closely correlated to stocks than previously.
As for what could propel gold even higher, the loss of faith in central banks’ policies to fight inflation is one potential demand driver. Of course a recession, either Fed-driven or through other means, would also be very bullish for the precious metal.
A couple of other fun facts in favor of gold right now: 1/ Russia has made some big moves out of US dollars and this may be emboldening Putin on a potential invasion of Ukraine. Consider: in 2013 Russia received dollars for 95% of its exports to Brazil, India, South Africa and China. After a decade of de-dollarization, only 10% of that trade is in greenbacks. Russia has also built its own payment settlement system outside of SWIFT, that enables it to circumvent US sanctions.
2/ A number of US states have removed sales taxes on precious metals purchases. Ohio and Texas have gone so far as to diversify their public pension funds with gold investments. Read more at Birch Gold Group
However you look at, the outlook for gold looks extremely positive, which is why we continue to hold physical gold and invest in quality junior gold explorers that can offer outstanding leverage to rising gold prices.
Richard (Rick) Mills
aheadoftheherd.com
Legal Notice / Disclaimer
Ahead of the Herd newsletter, aheadoftheherd.com, hereafter known as AOTH.
Please read the entire Disclaimer carefully before you use this website or read the newsletter. If you do not agree to all the AOTH/Richard Mills Disclaimer, do not access/read this website/newsletter/article, or any of its pages. By reading/using this AOTH/Richard Mills website/newsletter/article, and whether you actually read this Disclaimer, you are deemed to have accepted it.
Any AOTH/Richard Mills document is not, and should not be, construed as an offer to sell or the solicitation of an offer to purchase or subscribe for any investment.
AOTH/Richard Mills has based this document on information obtained from sources he believes to be reliable, but which has not been independently verified.
AOTH/Richard Mills makes no guarantee, representation or warranty and accepts no responsibility or liability as to its accuracy or completeness.
Expressions of opinion are those of AOTH/Richard Mills only and are subject to change without notice.
AOTH/Richard Mills assumes no warranty, liability or guarantee for the current relevance, correctness or completeness of any information provided within this Report and will not be held liable for the consequence of reliance upon any opinion or statement contained herein or any omission.
Furthermore, AOTH/Richard Mills assumes no liability for any direct or indirect loss or damage for lost profit, which you may incur as a result of the use and existence of the information provided within this AOTH/Richard Mills Report.
You agree that by reading AOTH/Richard Mills articles, you are acting at your OWN RISK. In no event should AOTH/Richard Mills liable for any direct or indirect trading losses caused by any information contained in AOTH/Richard Mills articles. Information in AOTH/Richard Mills articles is not an offer to sell or a solicitation of an offer to buy any security. AOTH/Richard Mills is not suggesting the transacting of any financial instruments.
Our publications are not a recommendation to buy or sell a security – no information posted on this site is to be considered investment advice or a recommendation to do anything involving finance or money aside from performing your own due diligence and consulting with your personal registered broker/financial advisor.
AOTH/Richard Mills recommends that before investing in any securities, you consult with a professional financial planner or advisor, and that you should conduct a complete and independent investigation before investing in any security after prudent consideration of all pertinent risks. Ahead of the Herd is not a registered broker, dealer, analyst, or advisor. We hold no investment licenses and may not sell, offer to sell, or offer to buy any security.
************


