Will Gold Mining Stocks Look Past Q3?


Gold mining stock charts have not yet confirmed a sustainable rally, and Q3 fundamentals may be a headwind
We have used this daily chart of the gold stock ETF, GDX in written and video updates to keep NFTRH subscribers apprised of the progress of the bounce from the early October low (after previously using the chart to manage the long correction that began with the May double top).
Let’s update the daily technical situation by noting that the GDX rally has halted where it should have halted, as we’ve expected resistance at or below the 200 day moving average (30.49) and/or clear visual resistance at 30. The pullback is in progress and has done a good thing by filling the upper gap as it grinds and tests the 50 day moving average. All normal.
Also normal would be a further drop to fill the lower gap and test the 26.60 area to either confirm that the October 2nd breakdown was a false one (bear trap) or a scout for perhaps one final drop to make a bottom. Technically, it was a violation of the March low, which implies bearish, but that is exactly why it could have been a bear trap. False breakdowns are a ‘thing’ in TA.
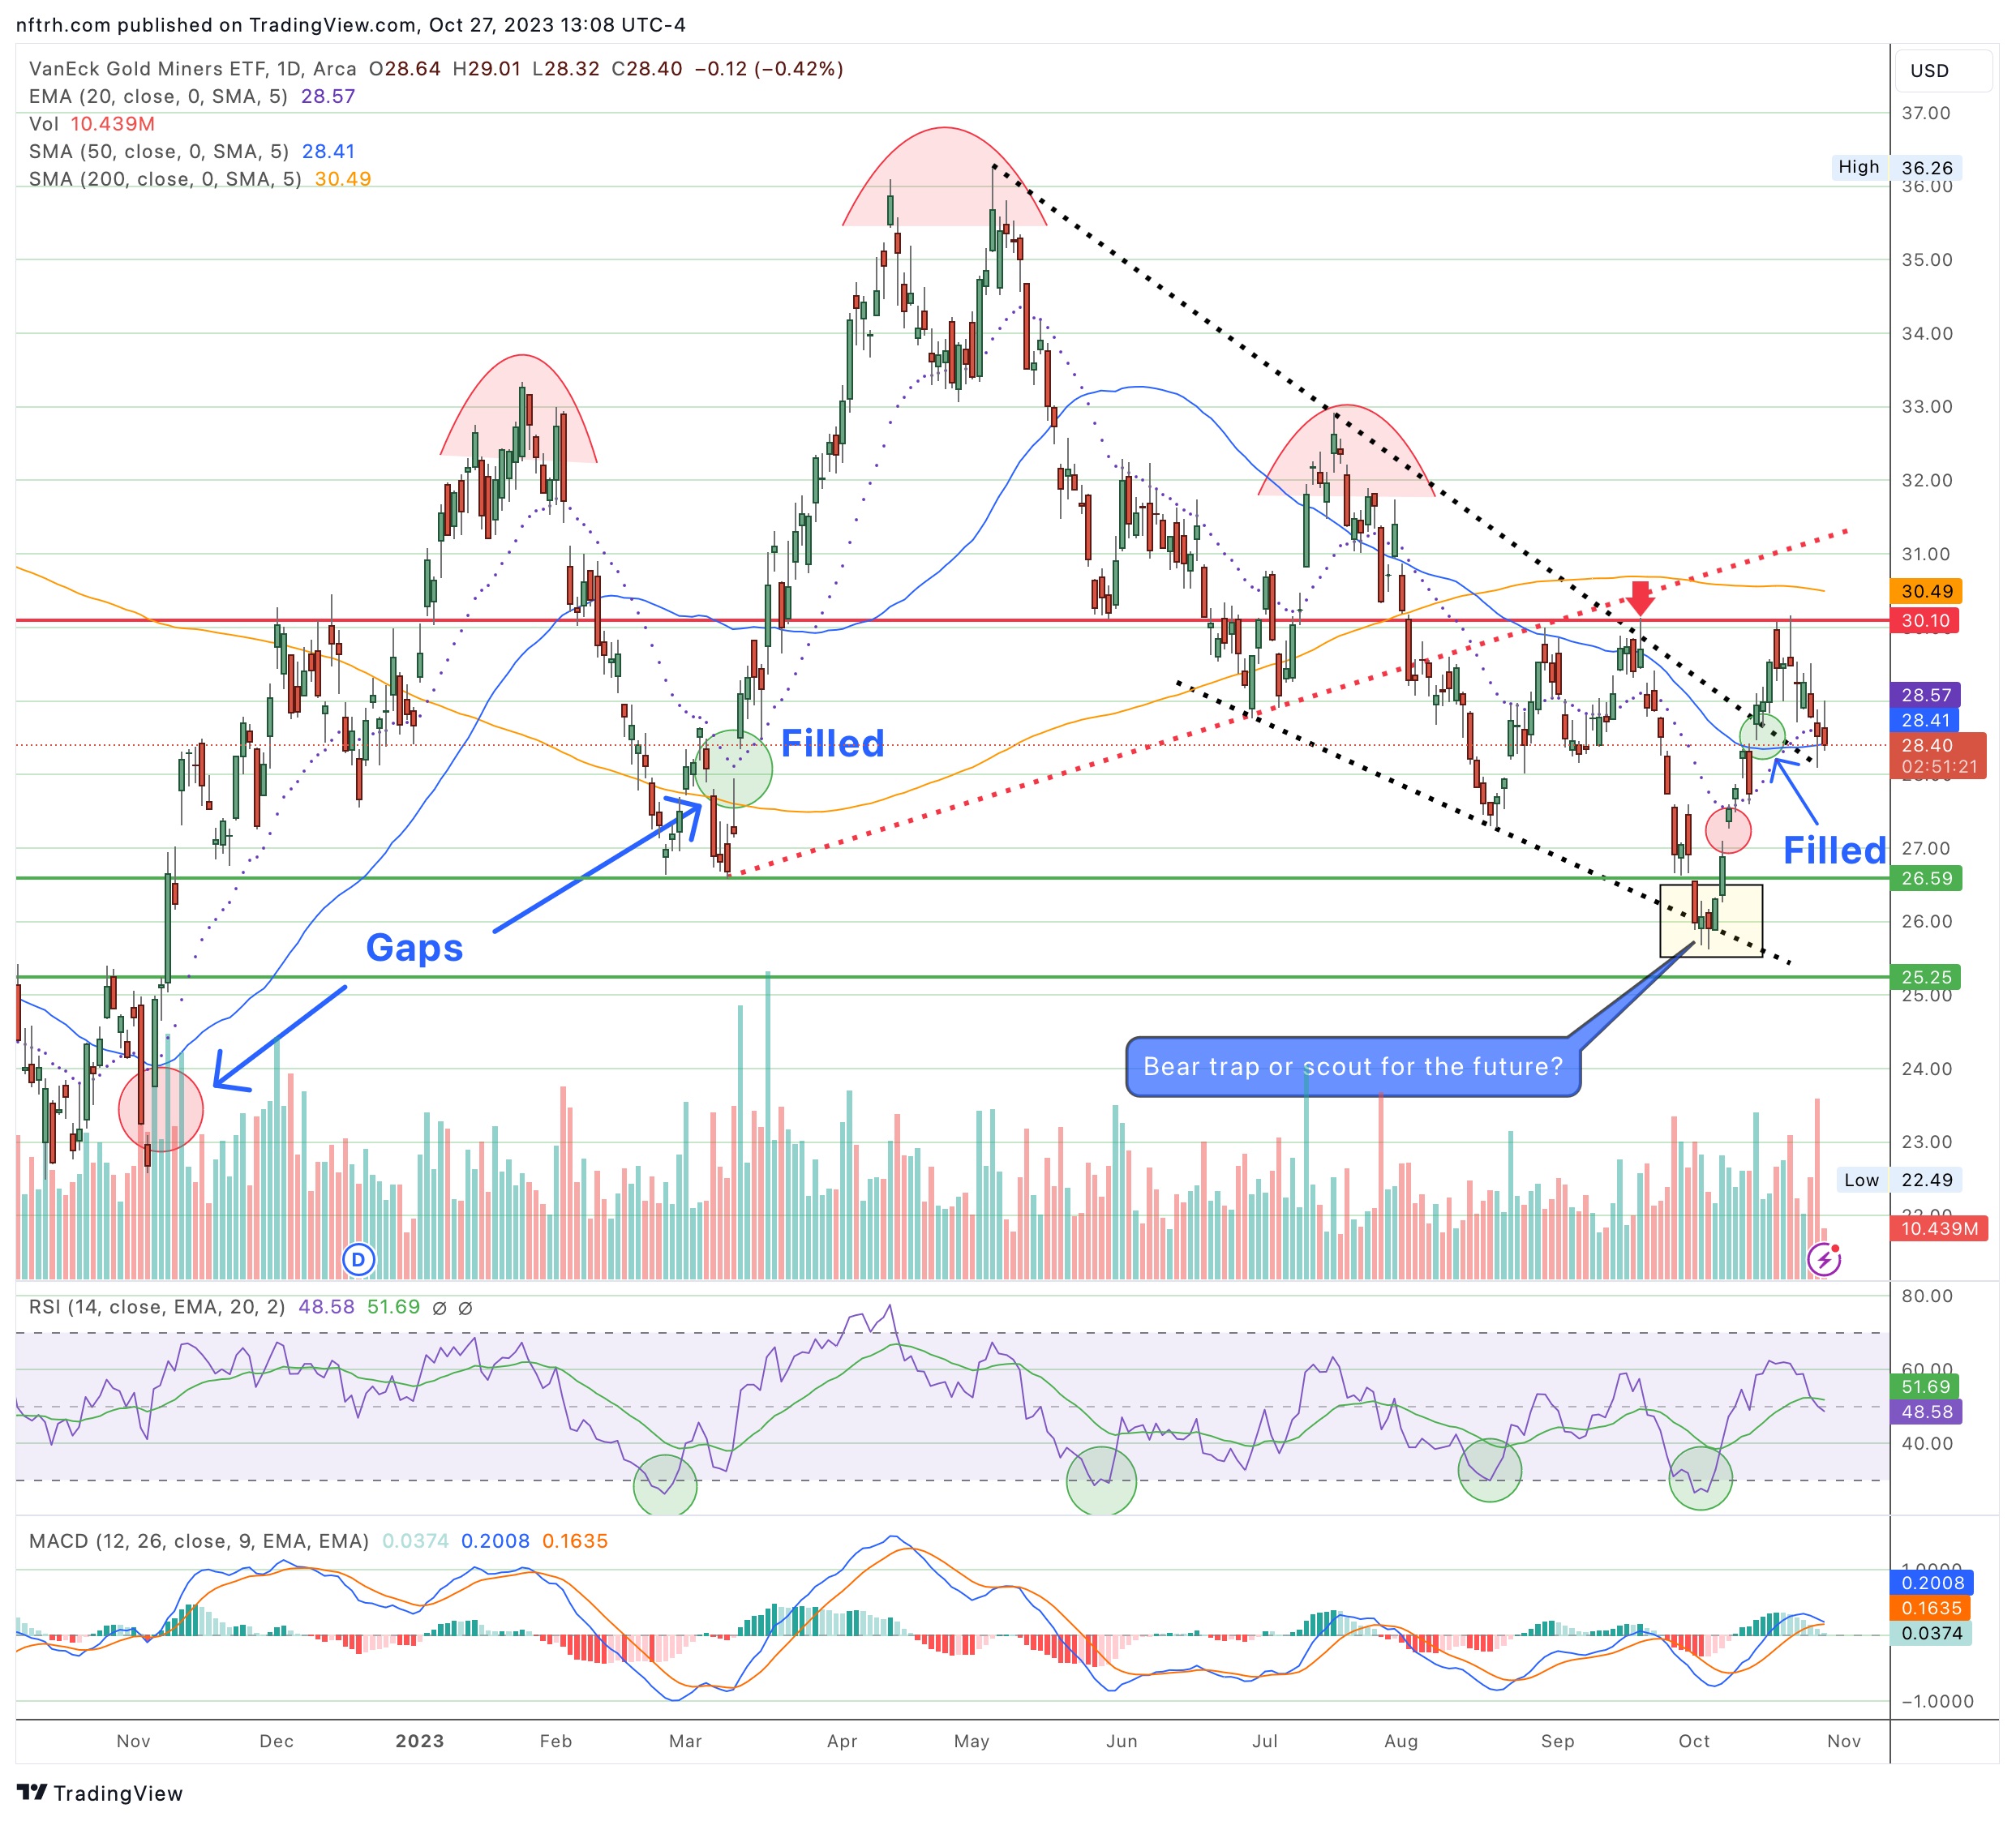
The sentiment and oversold conditions at the early October low were powerful enough to spring a strong rebound or even to end the bear phase in force since May. The break above the top of the falling wedge on the chart above was a positive, as a falling wedge in this case is a massive bull flag. However, I regard falling and rising wedges among the less reliable patterns in TA. So there’s your caveat.
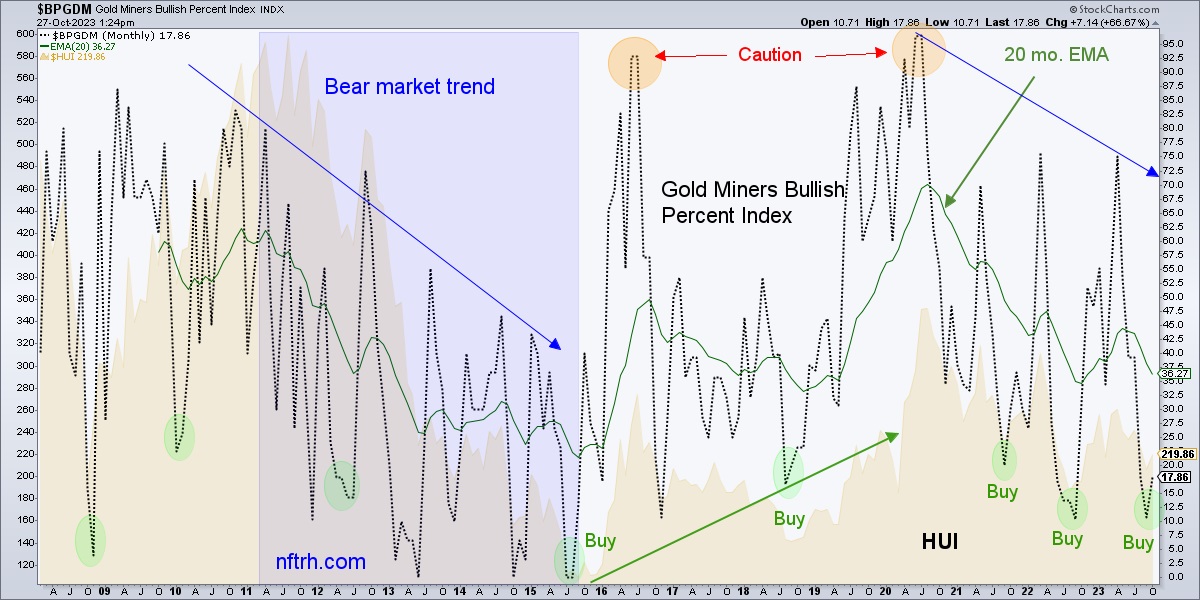
On the plus side, the Gold Miners Bullish Percent Index shows a still deeply oversold condition. When the BPGDM 20 month EMA hits lows as it did a few weeks ago it tends to spring back much harder than it has currently. This implies that there is more fuel to the rally from this perspective.
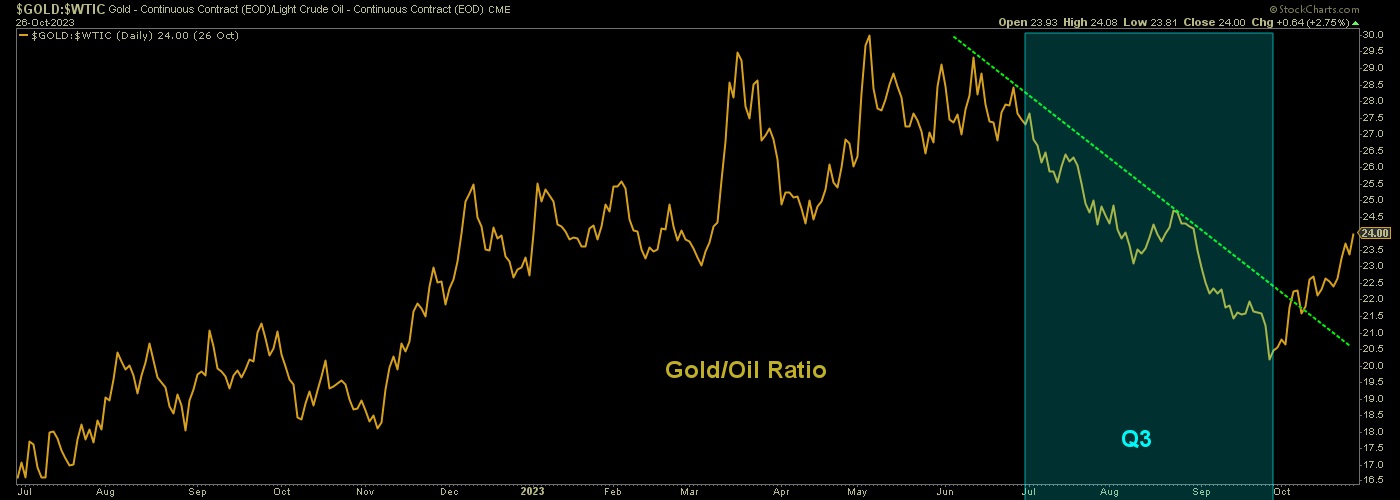
There are a couple concerning signals in play that will remain proprietary to NFTRH for review this weekend. But here is one that conventional gold mining analysts should be considering. We first noted this in NFTRH a few weeks ago. The Gold/Oil ratio (GOR) was negative for the entirety of the Q3 period that is about to be reported this earnings season. Crude Oil/Energy is a large factor in mining costs and the miners’ product under-performed in Q3. The questions now are…
- To what degree does the ratio impact the miners’ bottom lines and has the impact been factored?
- Will the market be smart enough to look ahead, rather than react to what is already behind?
If the market is looking ahead it sees the GOR breaking the downtrend and turning up. The GOR is not nearly a comprehensive fundamental indicator for gold mining stocks. But it is a very primary one, and if this breakout continues mining operational fundamentals will improve nicely.
Bottom Line
As the technical situation stalls where it is supposed to stall, a still deeply depressed sector is not carrying much froth, which is contrary positive. The short-term technical situation is stalled after all, not broken.
However, the sector has been fairly ‘anti-USD’ and painted more often than not with the brush that paints commodities. Again, we are managing signals in play that are concerning for the anti-USD/inflation trades. But for the purposes of this article, note that the techncials are at a decision point while the fundamentals (including and beyond the GOR) make moves to improve. When viewing the macro funda, there is a whole range of items that need to be considered and factored, which we do in weekly reports and NFTRH+ updates.
That said, watch this earnings season closely. If the sector bulls (first objective: take out the SMA 200 on GDX) it could be looking ahead to the improving macro I see for 2024, and if it puts on a final decline – and the fundamentals continue to improve – we’ll have a table pounder of a buying opportunity. That opportunity would come at the expense of those who’ve been guided by, and acted upon improper fundamental analysis not only since 2020, but on the long inflationary phase from 2003 to 2023.
To the surprise of most, the gold mining sector will become something special only when the Inflation > Disinflation/Goldilocks progression we are currently experiencing morphs to a deflation scare. And if the Fed’s hands are still tied and it cannot or will not effectively commit inflationary bailouts of bubble assets once again, so much the better for the long-term health of the gold mining sector.
For “best of breed” top down analysis of all major markets, subscribe to NFTRH Premium, which includes an in-depth weekly market report, detailed market updates and NFTRH+ dynamic updates and chart/trade setup ideas. Subscribe by Credit Card or PayPal using a link on the right sidebar (if using a mobile device you may need to scroll down) or see all options and more info. Keep up to date with actionable public content at NFTRH.com by using the email form on the right sidebar. Follow via Twitter@NFTRHgt.
*********
More from Gold-Eagle


