Yield Curve Inverted Again. Will Gold Shine Now?


The U.S. yield curve has inverted again, and it has done so to the widest level since 2007. How much of a reason to worry is that actually? A sky-is-falling moment lurking ahead? If so, what chance of saving us does gold have?
Another Yield Curve Inversion Occurs
It’s really getting more serious. Another yield curve inversion… And a much deeper one – that’s frightening!
As you probably remember, the yield curve inverted for the first time in the post-crisis era in March 2019. The inversion was mild and short-lived. And it occurred after the Fed sent a dovish signal, not a hawkish one, as it announced a longer pause in further tightening of monetary policyand the end of shrinking its balance sheet as early as this September.
Hence, we concluded in the Gold News Monitor that the March inversion did not fit the classical story when the Fed raises the short-term interest rates to combat inflation, so it did not signal the upcoming recession, especially that the unemployment rate (and other indicators, as well) did not confirm the warning. We were right, the sky did not fall, and the gold prices did not start to rally.
But maybe we will have to change our minds. You can blame the chart below, which is really worrisome. It shows the difference between 10-year and 3-month Treasuries. Just take a look!
Chart 1: Spread between 10-Year Treasuries and 3-Month Treasuries from January 2019 to May 2019.
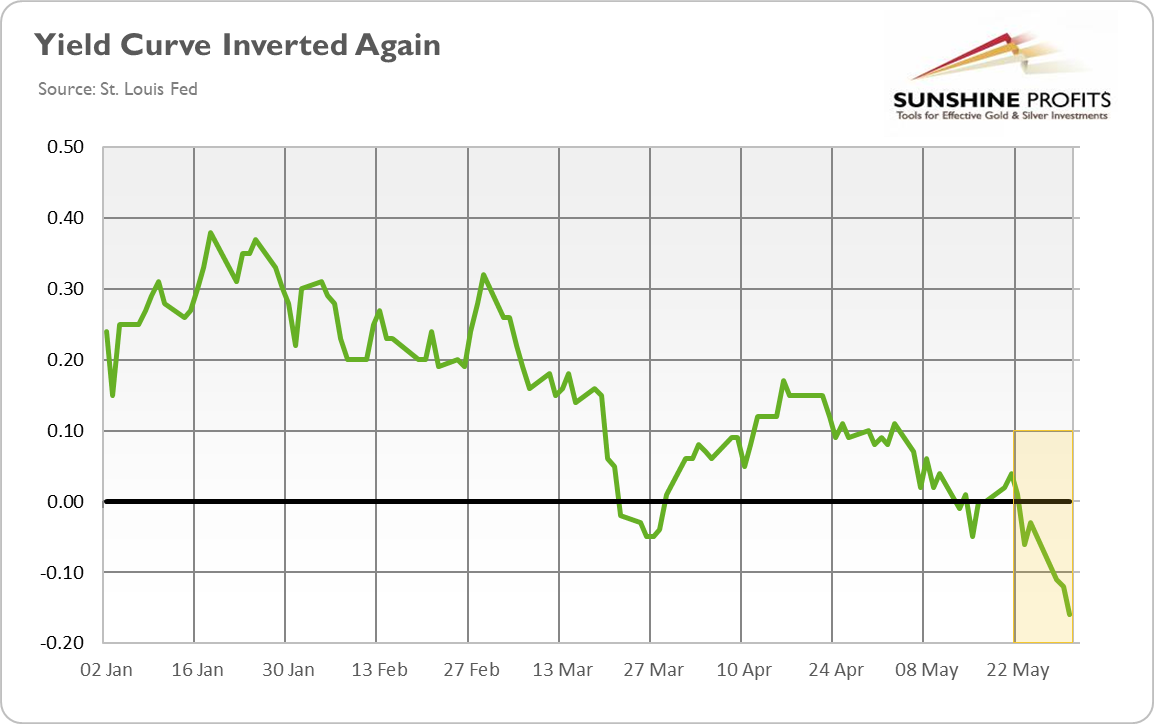
As one can see, after short inversion in March, the yield curve returned to the positive zone and stayed there for the whole April. However, in the mid-May, the yield curve found itself again in the negative territory. On May 13, the spread fell to -0.01, but the inversion ended the next day. On May 15, however, the yield curve inverted again, to -0.05, but it terminated the next day. But since May 23, the yield curve has been inverted once more. And this time, the inversion is much deeper, as the spread dropped to -0.16.
So, this is the fourth inversion since March, which indicates that the negative spreads might be not so short-lived after all. And not so mild either. Previously, the spreads did not fall below -0.05, while the current difference plunged below -0.15. Hence, the situation might be more serious than we previously though, despite the fact that economic data seems to be solid overall as other recession warning signs simply are not there.
Indeed, the alarm bells are ringing louder not only in the US bond market, but around the world. Germany’s 10-year rates plunged to a new record low well below zero. The UK yield curve is around its flattest level since the Great Rececession, while Canada’s yield curve has already reached 2007’s level of inversion.
Implications for Gold
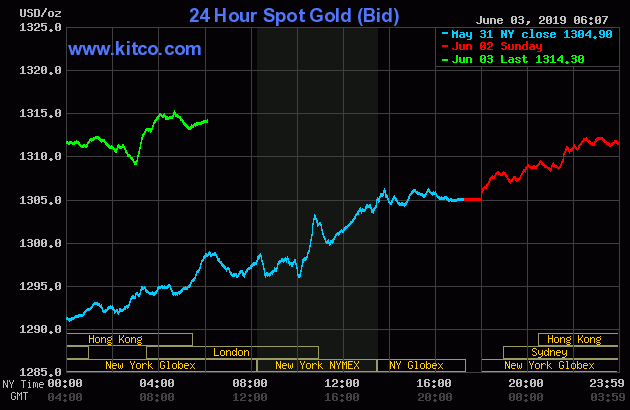
The bottom line is that the yield curve has inverted again. It should add to the fears of recession, which be a tailwind for the yellow metal in the near future. Indeed, as the chart below shows, the gold prices rose on Monday to their highest in more than two months. It seems that worries about a global recession – fueled partially by the trade wars– pushed investors into the safe-haven assets such as gold.
Chart 2: Gold prices from May 31 to June 3, 2019.
Should we press the panic button? On the one hand, an inverted yield curve has preceded every U.S. recession since WWII, so we should not assume that this time will be different. On the other hand, the quantitative easing and other central banks’ interventions in the bond markets could really diminish somewhat the predictive power of the yield curve. Other recession indicators (including differently measured yield curves) do not blink red, at least not yet. And the inversion is caused by the 10-year yield falling rather than the 3-month yield rising.
So we do not send a Red Alert yet. We will examine thoroughly the newest inversion of the yield curve in the next edition of the Market Overview and let you know our verdict on the issue! As for now, the precious metals investors should become more cautious, that’s for sure (but they should not panic!). If the yield curve is still an indicator to be trusted in our age of expanded monetary policy toolbox, we are likely about four – six quarters from the US recession. If we are on that gloomy path, that helps explain gold’s increasing appeal. The important word here is – if…
If you enjoyed the above analysis, we invite you to check out our other services. We provide detailed fundamental analyses of the gold market in our monthly reports and we provide daily Gold & Silver Trading Alerts with clear buy and sell signals. If you’re not ready to subscribe yet and are not on our gold mailing list yet, we urge you to sign up. It’s free and if you don’t like it, you can easily unsubscribe. Sign up today!
Disclaimer: Please note that the aim of the above analysis is to discuss the likely long-term impact of the featured phenomenon on the price of gold and this analysis does not indicate (nor does it aim to do so) whether gold is likely to move higher or lower in the short- or medium term. In order to determine the latter, many additional factors need to be considered (i.e. sentiment, chart patterns, cycles, indicators, ratios, self-similar patterns and more) and we are taking them into account (and discussing the short- and medium-term outlook) in our trading alerts.
Arkadiusz Sieron
Sunshine Profits‘ Gold News Monitor and Market Overview Editor
* * * * *
All essays, research and information found above represent analyses and opinions of Przemyslaw Radomski, CFA and Sunshine Profits' associates only. As such, it may prove wrong and be a subject to change without notice. Opinions and analyses were based on data available to authors of respective essays at the time of writing. Although the information provided above is based on careful research and sources that are believed to be accurate, Przemyslaw Radomski, CFA and his associates do not guarantee the accuracy or thoroughness of the data or information reported. The opinions published above are neither an offer nor a recommendation to purchase or sell any securities. Mr. Radomski is not a Registered Securities Advisor. By reading Przemyslaw Radomski's, CFA reports you fully agree that he will not be held responsible or liable for any decisions you make regarding any information provided in these reports. Investing, trading and speculation in any financial markets may involve high risk of loss. Przemyslaw Radomski, CFA, Sunshine Profits' employees and affiliates as well as members of their families may have a short or long position in any securities, including those mentioned in any of the reports or essays, and may make additional purchases and/or sales of those securities without notice.
********
********

Arkadiusz Sieroń received his Ph.D. in economics in 2016 (his doctoral thesis was about Cantillon effects), and has been an assistant professor at the Institute of Economic Sciences at the University of Wrocław since 2017. He is a board member of the Polish Mises Institute of Economic Education, author of several dozen scientific publications (including in such periodicals as the Journal of Risk Research, Prague Economic Papers, Quarterly Journal of Austrian Economics, and Research in Economics), and a regular contributor to GoldPriceForecast.com and SilverPriceForecast.com. His two books, Money, Inflation and Business Cycles and Monetary Policy after the Great Recession, are both published by Routledge. Arkadiusz is also a certified Investment Adviser, a long-time precious metals market enthusiast, and a free market advocate who believes in the power of peaceful and voluntary cooperation of people.


