ZAR Gold Price Signals A September 2001 Type Event In The Financial Markets


The gold price in South African Rand (ZAR) is often a leading indicator for a USD gold price rally, as well as major trouble in the financial markets. A good example of this was around August/September 2001, just before the September 2001 crash (which turned out to be a major turning point in the markets – not just for the events of September 11).
Below is a comparison of the ZAR gold chart and the USD gold chart (all charts generated at tradingview.com):
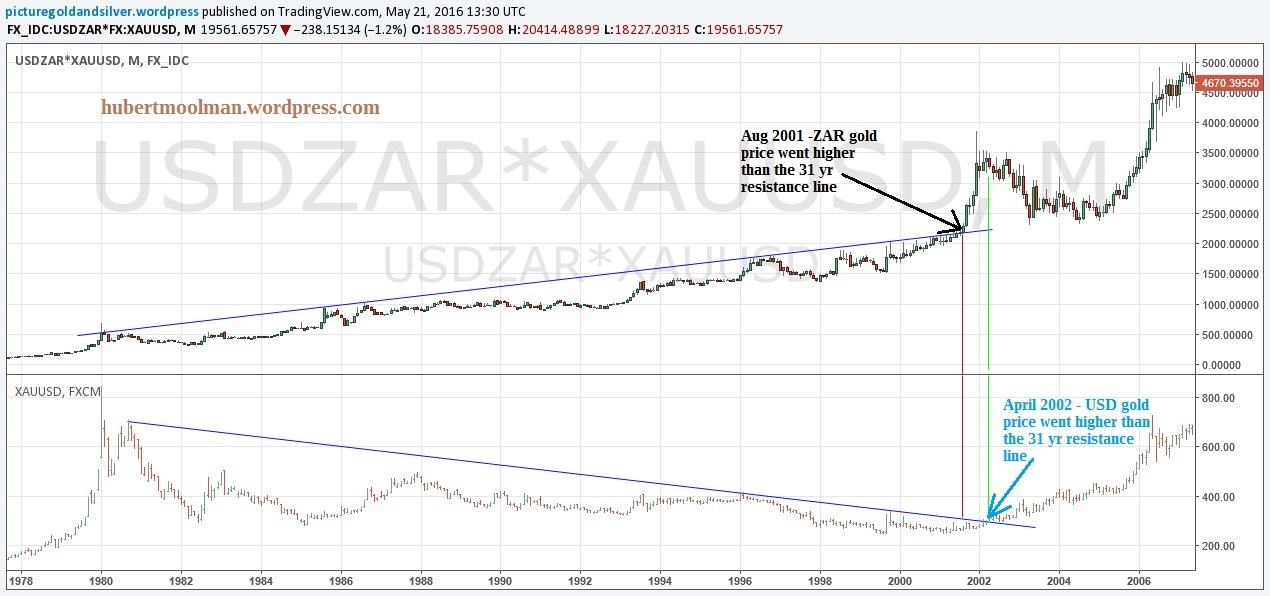
On both charts, I have drawn a resistance line (blue) from just after the important 1980 highs. The ZAR gold price managed to go higher than the resistance line by about August 2001 – just before the September 2001 events). From there, it went on a very strong rally.
The USD gold price went higher than its equivalent (or similar) line, about 8 months later, and continued to rise. The ZAR gold price was a very good leading indicator of the market crash, as well as the USD gold rally.
The red and green line; therefore, represent important turning points for gold in ZAR and USD, respectively. Since then, both charts have gone higher at a steeper angle – see the following chart:
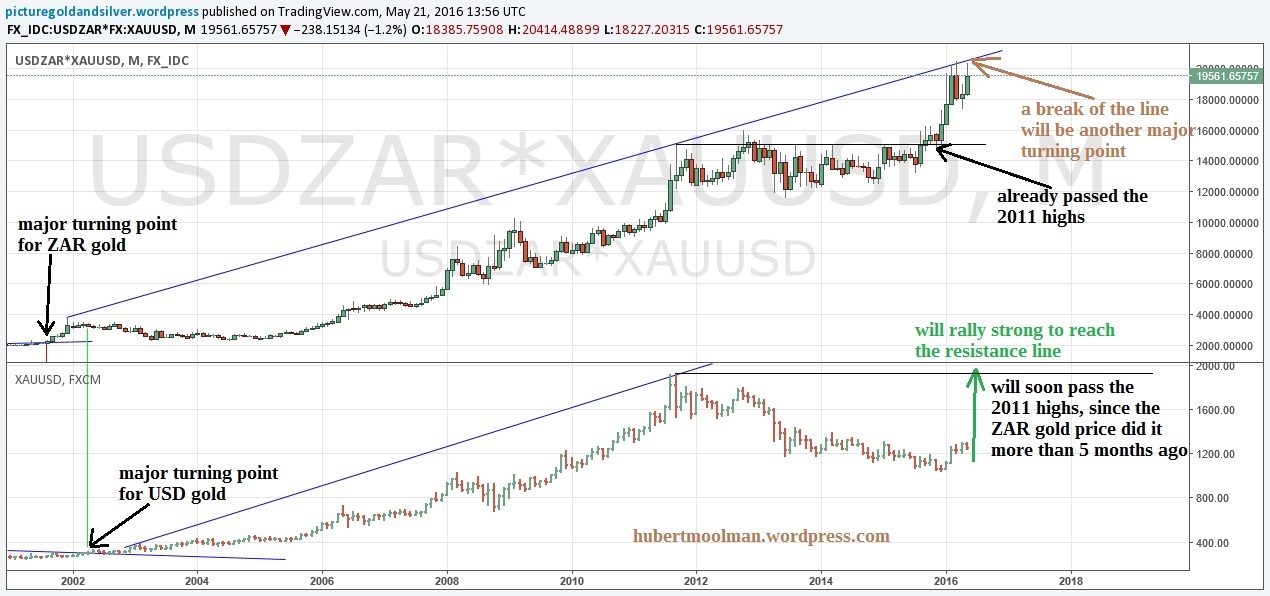
On both charts, I have indicated where the major turning points are, as well as drawn a new upper resistance line from the first peak after the turning point (steeper angle than the previous lines). Notice how the ZAR gold price has already passed the 2011 highs. Based on past behaviour, this almost guarantees that the USD gold price will pass its 2011 high (very soon).
Furthermore, the ZAR gold price has already touched the resistance line. If the USD gold price was today at its resistance line, it would be at $2 750. The USD gold price will move much faster over the coming months, in order to catch up with the ZAR gold price – this is consistent with a collapse of the USD Index.
Below is a ZAR gold price chart with fractals that indicate that price could move higher than the resistance line over the coming months:
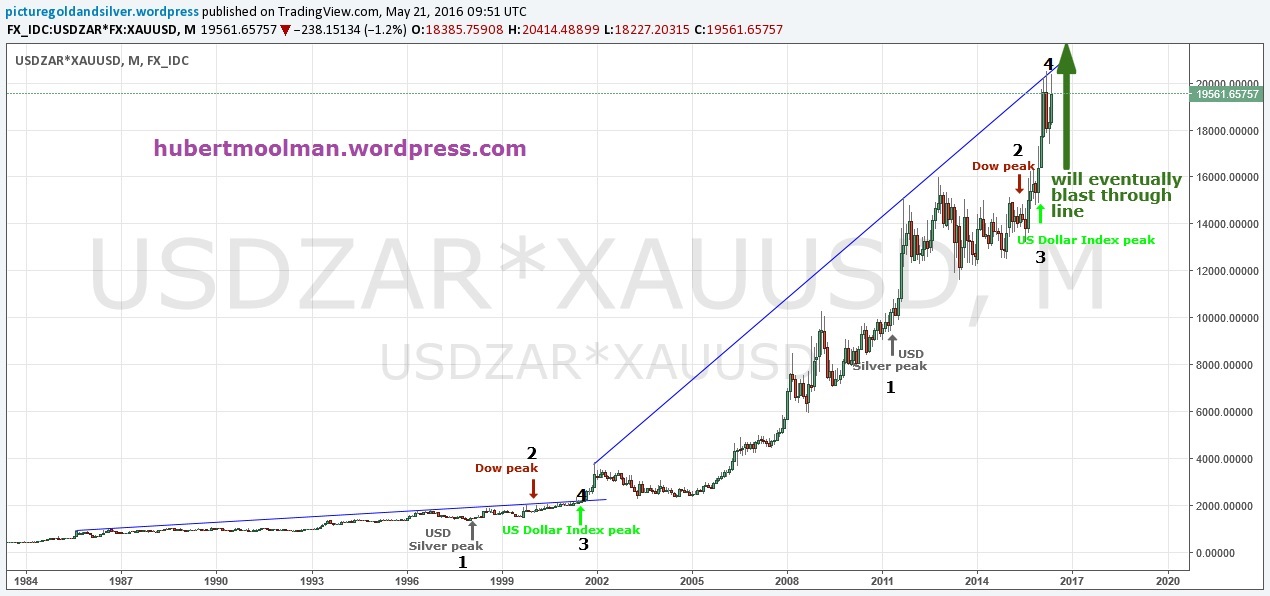
On the chart, I have marked the two fractals (1 to 4). The fractals exist in similar conditions, relative to the key market points (USD silver peaks, Dow peaks and USD Index peaks) indicated. The price is very close to breaking the line, with current support at the R16 000 level.
When this happens, it signals the soon coming major pain in the financial markets, as well as the mania-phase in the gold market.
********
For more of this kind of fractal analysis, you are welcome to subscribe to my premium service. I have also recently completed a Silver Fractal Analysis Report as well as a Gold Fractal Analysis Report.


