Gold Continues With Strong Upward Momentum and the Potential to Move Higher
NEW YORK (Oct 4) Over the last five trading days, gold hit a bottom at approximately $1621 and gained well over $100 in a short time. As of 5:21 PM, EDT gold futures basis the most active December contract is currently trading at $1734.70 after factoring in today’s gain of $32.70 or 1.92%.
In the same way that gold bottomed five trading days ago on Wednesday, September 28, concurrently the dollar peaked on the same day hitting its highest value in 20 years. Today the dollar continues to fall dropping by 1.42% with the dollar index currently fixed at 110.065.
Over our last two reports, we have been focusing on the key reversal last Wednesday. By Friday of last week, that assumption was confirmed and the dollar had experienced a key reversal from bullish to bearish, just as gold experience a bottom at precisely the same time as market sentiment shifted from bearish to bullish.
To come up with this conclusion we use two types of Japanese charts that differ from the standard candlestick chart that many are familiar with. The studies we used are based on both a three-line break chart and the Heinkin-Ashi chart.
Both chart types were developed by Japanese traders and are primarily used to determine the strength of the trend as well as pivot points or key reversals. In yesterday’s letter, we looked at both the dollar and gold through the eyes of these charts and conveyed why we derived that gold had entered a rally just as the dollar began a correction.
Have We Properly Identified Key Reversals in Gold and U.S. Dollar?
In today’s letter, we want to answer a much more important question. The question is if we properly identified key reversals in both gold and the dollar where can we expect to find resistance in gold, and support in the dollar? To that end, we are utilizing two basic techniques which are Fibonacci retracements and the identification of past tops and bottoms to indicate potential support or resistance areas.
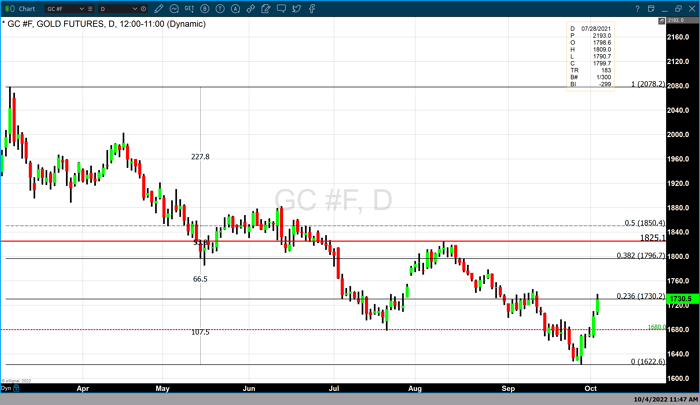
Chart 1 – Daily gold with potencial resistance
The chart above is a daily candlestick chart of gold futures. We have labeled potential areas of resistance based on a Fibonacci retracement and the identification of key tops in the market that could also be markers that could indicate resistance.
The Fibonacci retracement data set begins at this year’s high of $2078 and ends at the low of $1621 that occurred five trading days ago. Currently gold is trading at $1734.70 and our technical studies indicate that the first potential level of resistance has just been passed at $1730.20 which is based on the 23.6% Fibonacci retracement.
Above that price point, the first potential point of resistance should gold continues to move higher occurs at $1796.70. That is based upon the 38.2% Fibonacci retracement from the same data set. Lastly, there is potential resistance at $1825.10 which is the top that occurred in mid-August.
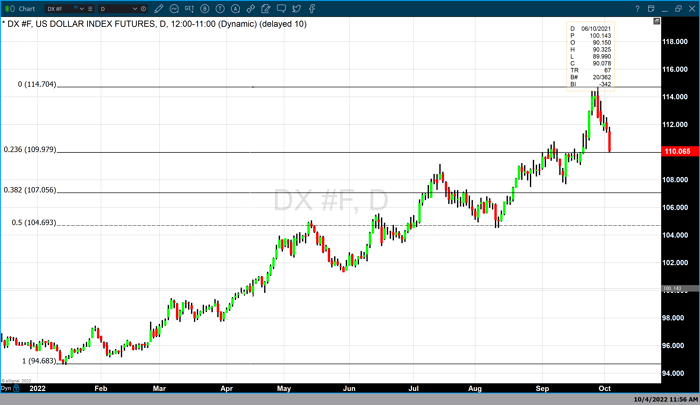
Chart 2 Daily USDX with Fibonacci retracement
The chart above is a daily candlestick chart of the dollar index and a Fibonacci retracement data set. The data set begins in January of this year when the dollar index was trading at 94.683 and concludes at the recent high that occurred last Wednesday when the dollar index hit its highest value in the last 20 years at 114.704.
Bottom Line
Based on our studies the dollar index is currently at the first potential price point where support could be found at 109.979 which is the 23.6% Fibonacci retracement. Currently, the dollar index is at 110.065 just above that price point. Below that is the 38.2% Fibonacci retracement that occurs at 107.056. Finally, there is the potential to find support at the 50% retracement which is at 104.693.
FXEmpire


