Gold Price Set for Pullback as $6.8B Rebalancing Begins Jan 9
LONDON (January 8) Gold (XAUUSD) is lower on Thursday as traders prepared for heavy futures selling aligned to commodity index rebalancing. A relatively firm U.S. Dollar also weighed on demand for the dollar-denominated asset.
$6.8 Billion in Gold Futures Liquidation Expected
From January 9 to January 15, gold futures liquidation is expected to be roughly $6.8 billion, according to Citigroup, basing its estimate on funds tracking the Bloomberg Commodity Index and the S&P Goldman Sachs Commodity Index.
Unprecedented Rebalancing Event After Historic 2025 Rally
This year’s rebalancing is expected to be a significant event because of the size of last year’s gains. In 2025, gold was up over 60%. By comparison, over the past decade, gold’s 10-year average return has been around 9-14% annually. So yes, this is a big deal over the near-term so investors should brace for a significant pullback. “I’ve been running this process for many years, and we haven’t seen any outsized flow like this one,” said Kenny Hu, a strategist at Citigroup.
Core Fundamentals Remain Intact Despite Near-Term Pressure
Despite the short-term bearish expectations, this is not a bull market killing event. If anything, it could help drive the market back into support and value areas. The core fundamental drivers of last year’s rally are expected to remain intact: central bank buying, Federal Reserve rate cuts and a weaker U.S. Dollar.
Position-Squaring and NFP Uncertainty Add to Weakness
In addition to the upcoming rebalancing, some traders are squaring positions and booking profits because of diminishing concerns over geopolitical risks tied to Venezuela. Uncertainty ahead of Friday’s Non-Farm Payrolls report and its potential impact on Fed policy is also weighing on prices.
Technical Picture Shows Weakening Momentum
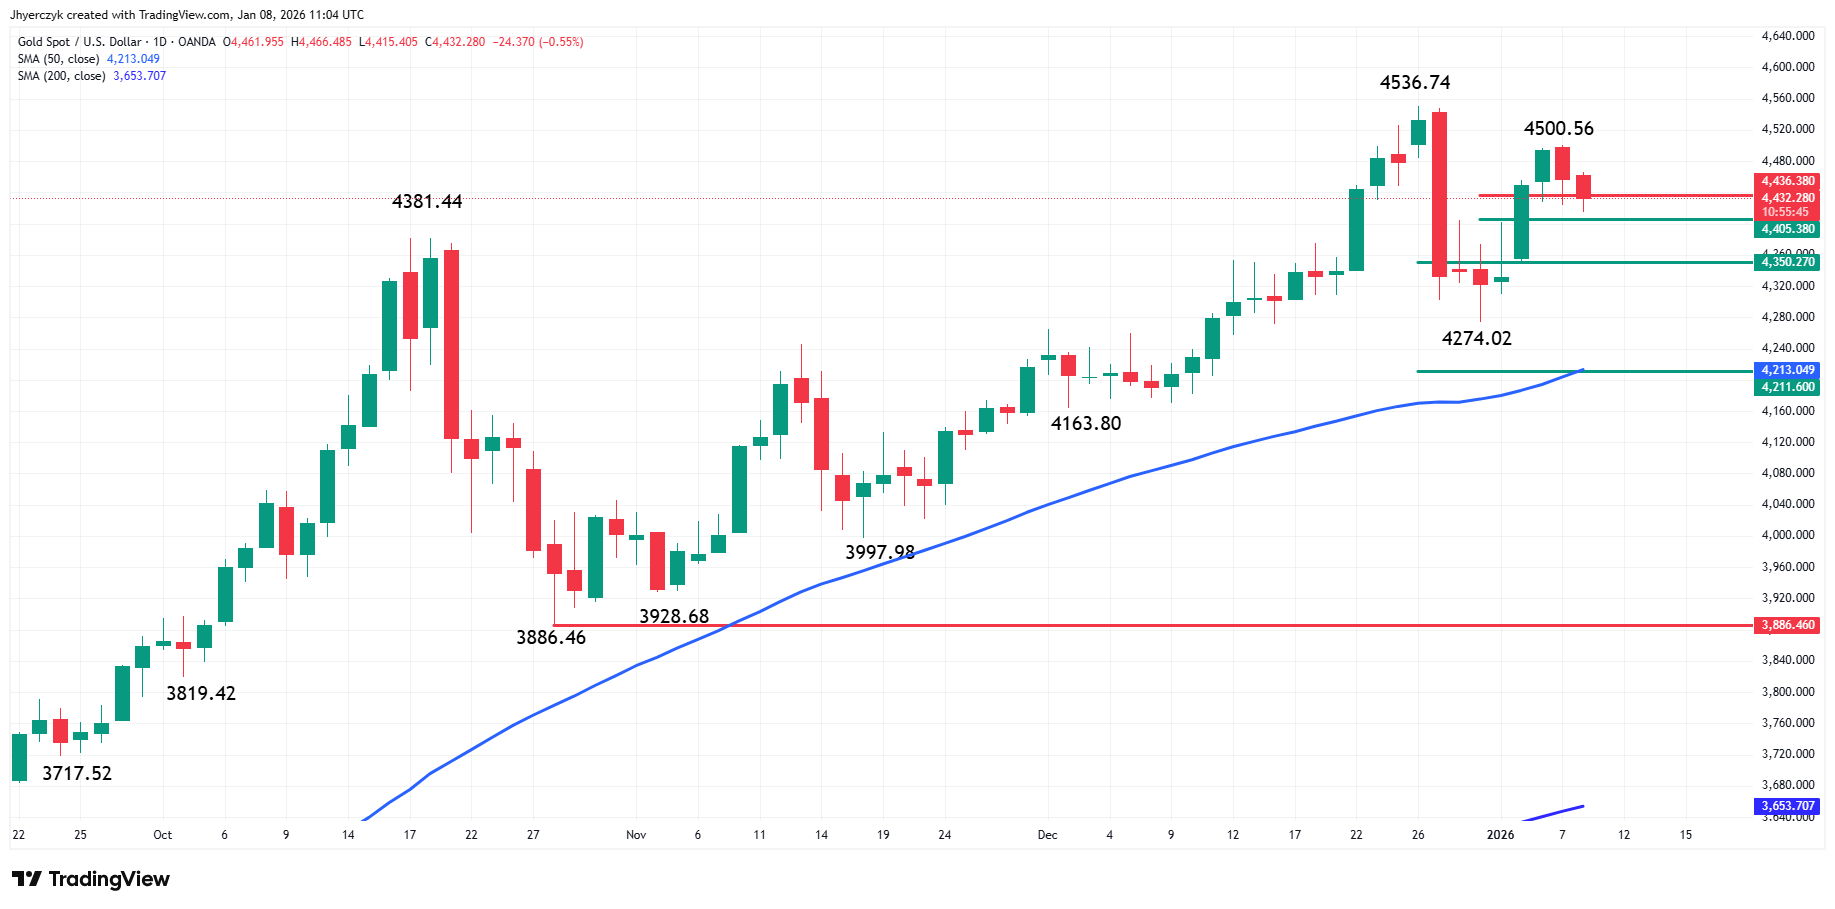
Daily Gold (XAU/USD)
Technically, the daily chart pattern isn’t looking as bullish as it did earlier in the week. Not only did we see a potentially bearish closing price reversal top on Wednesday, but the market has also formed a secondary lower top, which tends to reflect not just selling pressure, but new short positions.
The trend is still up, but a little weaker than it was earlier in the week so let’s just call it a shift in momentum or investor sentiment. A trade through $4500.56 will indicate the return of buyers, while a clear breakout over $4536.74 will signal a resumption of the uptrend.
Key Support Levels to Watch
We have two key trend indicators to watch on the downside. The first is the swing bottom at $4274.02. A trade through this level will change the trend to down on the main swing chart. It will also mark the first lower-top, lower-bottom chart pattern since May.
The second trend indicator to watch is the 50-day moving average at $4212.94. This market hasn’t been on the weak side of this indicator since August 22 so it is a significant trading tool to watch. To some, it represents value especially when it’s combined with a 50% level at $4212.93.
Critical Retracement Zone Holds the Key
Short-term, the key area to pay close attention to is the retracement zone at $4436.38 and $4405.38. Since we’re leaning to the downside, we’re going to call $4405.38 the trigger point for an acceleration to the downside.
Outlook: Prepare for Volatility and Potential Value Entry
Looking ahead, traders should brace for the rebalancing, which is likely to lead to increased volatility and a bias to the downside because of futures contract liquidation. If you’re not flipping to the short-side during the upcoming bearish event then prepare for a test of value at possibly the 50-day moving average at $4212.94 today.
FXEmpire


