Forecast: Gold's Key Dividing Line


 Last week's trading saw Gold forming its high in early-week trading, here doing so with Tuesday's tag of the 1825.90 figure. From there, weakness was seen into Friday's session, with the metal dropping down to a low of 1789.10 - before bouncing slightly off the same into the weekly close.
Gold Market, Short-Term
For the near-term picture, Gold is in a short-term downward phase, coming as a result of the 10 and 20-day cycles, with the smaller 10-day wave shown on the chart below:
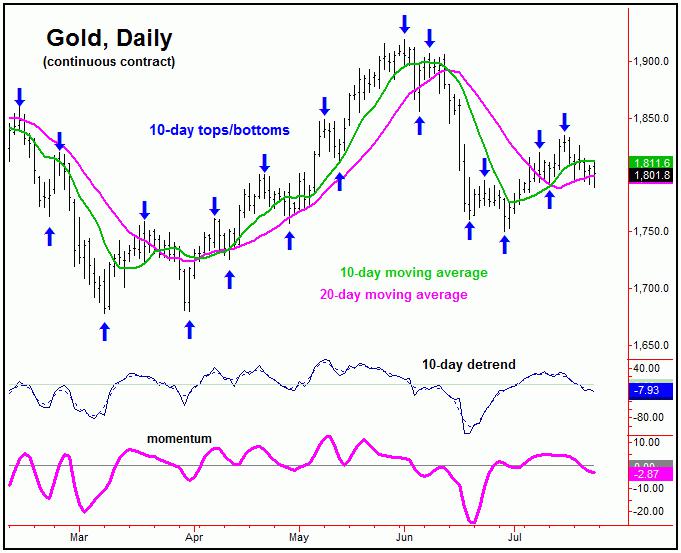
In terms of time, the 10-day wave is now 9 trading days along from its last labeled low, which puts it at or into its normal bottoming range. It is too early to suggest this wave has actually troughed, which would require a break above the next upside ‘reversal point’ for this wave - a number which has yet to actually materialize.
In terms of patterns, due to the position of a larger 34-day wave, the probabilities tend to favor the downward phase of the smaller 10 and 20-day cycles to end up as a countertrend affair - which simply means Gold should remain above the late-June bottom of 1750.10. If correct, the next short-term rally phase is likely to make another attempt at our key dividing line of 1835.00.
From the comments made in past articles, the most dominant short-term cycle for the Gold market is the 34-day wave, which is shown again on the chart below:
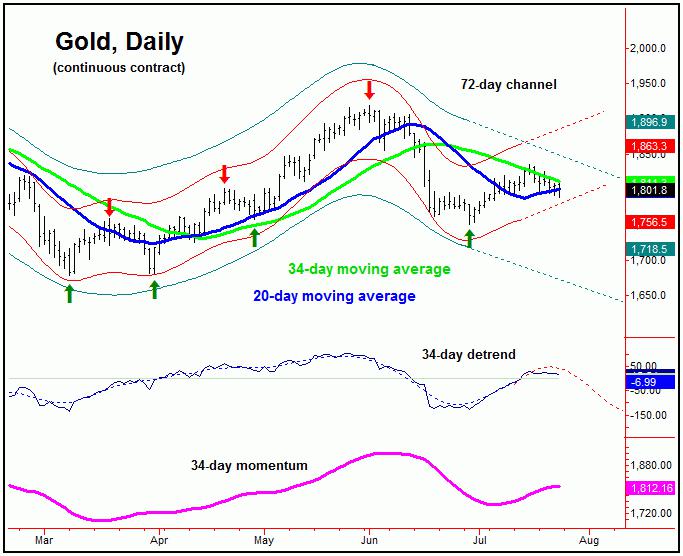
In terms of price, our assumption back in late-June/early-July was that Gold would rally back to its 34-day moving average - something which is seen approximately 85-90% of the time on the upward phases of this wave. We did get that with the action that followed, with the same also providing resistance to the move.
As mentioned earlier, the current assumption is that the upward phase of the 34-day cycle is still in force. More key again is the 1835.00 figure on a daily closing basis, which is the key dividing line for the larger 72-day component. In other words, in order to really trigger in the next good short-term rally for the metal, a close above this number has to be seen.
Going further with the above, a daily close above the 1835.00 figure - if seen at any point going forward - would confirm the June trough as our last bottom for the larger 72-day cycle, shown below:
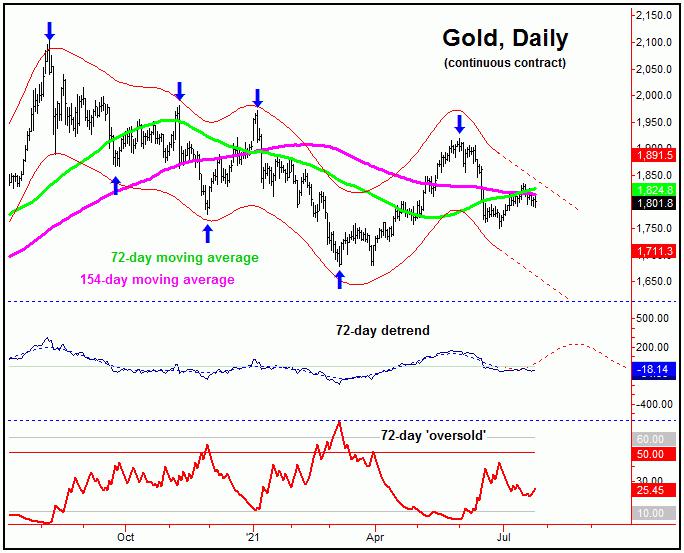
Taking out 1835.00 on a closing basis would trigger in the next upward phase of this 72-day wave to be back in force. In terms of time, that action would then be expected to give way to additional strength into mid-to-late August. Obviously, if Gold can't get above the 1835.00 figure on a close, then it will remain vulnerable.
Stepping back further, if Gold does manage to push higher into the mid-to-late August region, that move will be the odds-on favorite to peak the larger 154-day component, which is shown on the next chart:
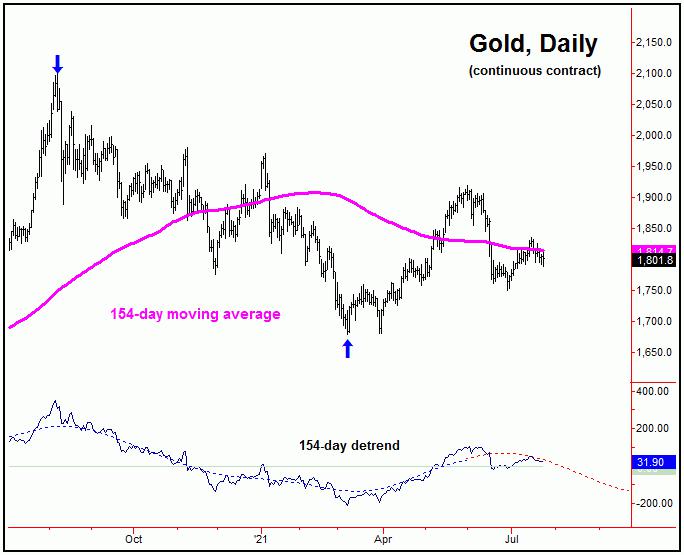
Until a higher level materializes, it would currently take a reversal back below the 1750.10 figure (August, 2021 contract) to confirm this 154-day cycle to have topped, a number which could start to move up in the days/weeks ahead, but for now remains locked in place.
U.S. Stock Market Update
As mentioned in past articles, the U.S. stock market - as measured by the S&P 500 index, (or 'SPX') - is in the range for a mid-term price top, expected to come from the combination of the 180 and 360-day cycles, with the larger 360-day component shown on the chart below:
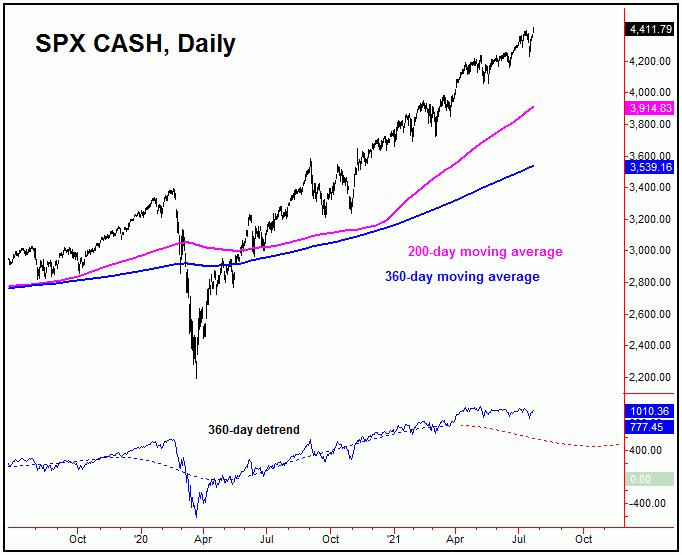
With the action seen since June, we have had two decent declines in the U.S. stock market, with the first being the drop into mid-June - and the most recent bottoming with last week's tag of the 4233.13 SPX CASH figure. Each of these declines we called correctly in our daily Market Turns report, with our last flip to short-term bearish occurring with a breadth 'T' expiration on July 13th (i.e., SPX 4369.21)
Having said the above, neither of the June or July declines were able to confirm a peak in place with this 360-day cycle. For the most recent decline, that would have required a daily close below the 4225.37 SPX CASH figure. In other words, while a hard test of that number came into early last week, the SPX was able to remain above it - thus keeping the upward phase of this 360-day cycle intact. This ‘reversal point’ should start to move up again soon, but for now remains locked in place.
For the very short-term, the recent low will end up as a contracted bottom for a smaller 20-day cycle that we track, which is also our dominant trading cycle - and which is shown on the chart below:
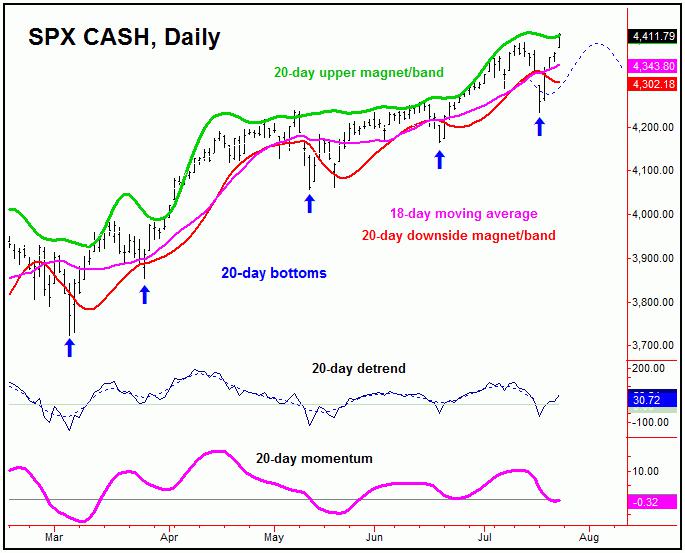
With the position of this 20-day cycle - and with the late-day reversal seen last Monday - we were able to move back to a short-term bullish position in U.S. stocks (i.e., 4258.49) - which we are still holding. With that, we are obviously looking for a continued push to higher highs in the next week or two, where we will be once again on the alert for the next larger cycle peak forming.
For the mid-term picture, once the bigger 360-day cycle does confirm a top, its next correction phase is expected to be the largest of this year, with the 200-day moving average being an ideal downside magnet. In terms of patterns, that decline is favored to end up as a countertrend affair, inside a larger four-year cycle upward phase - one which is projected to remain intact into the late-2022 to Spring of 2023 timeframe or later.
Jim Curry
The Gold Wave Trader
http://goldwavetrader.com/
http://cyclewave.homestead.com/
********


