Gold Update: Pullback Dust In A Bull Era Wind


As my metals market April to October cycle inversion reaches its potential crescendo today, I invite savvy investors to consider joining me…
As I book some great fiat money profits… with an eye to eventually parlaying them into more supreme money gold.
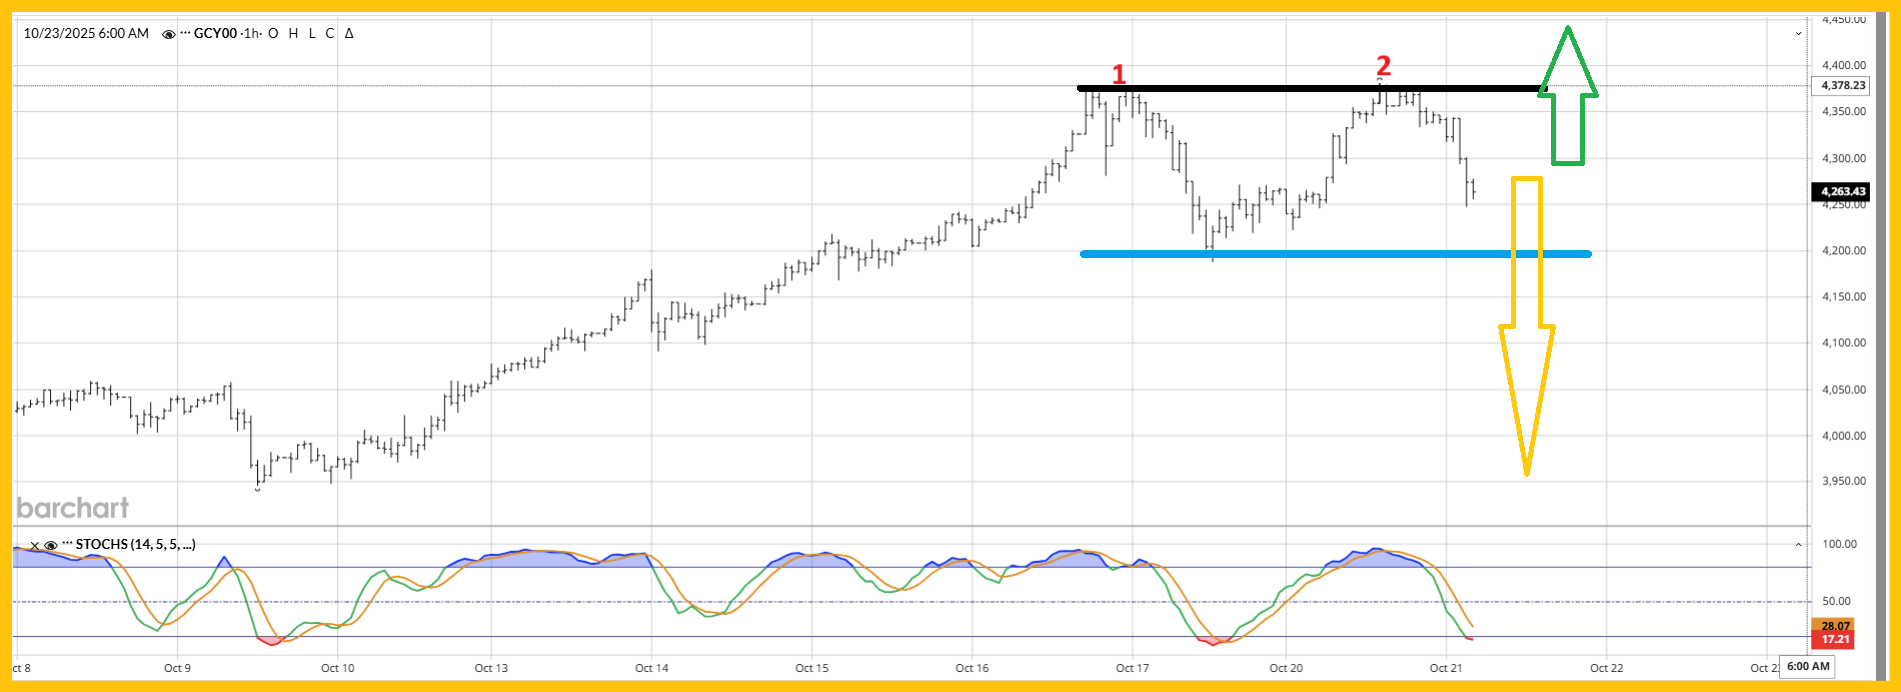
On the short-term chart, gold has an interesting pattern. It could be a double top that targets the $4060-$3960 zone.
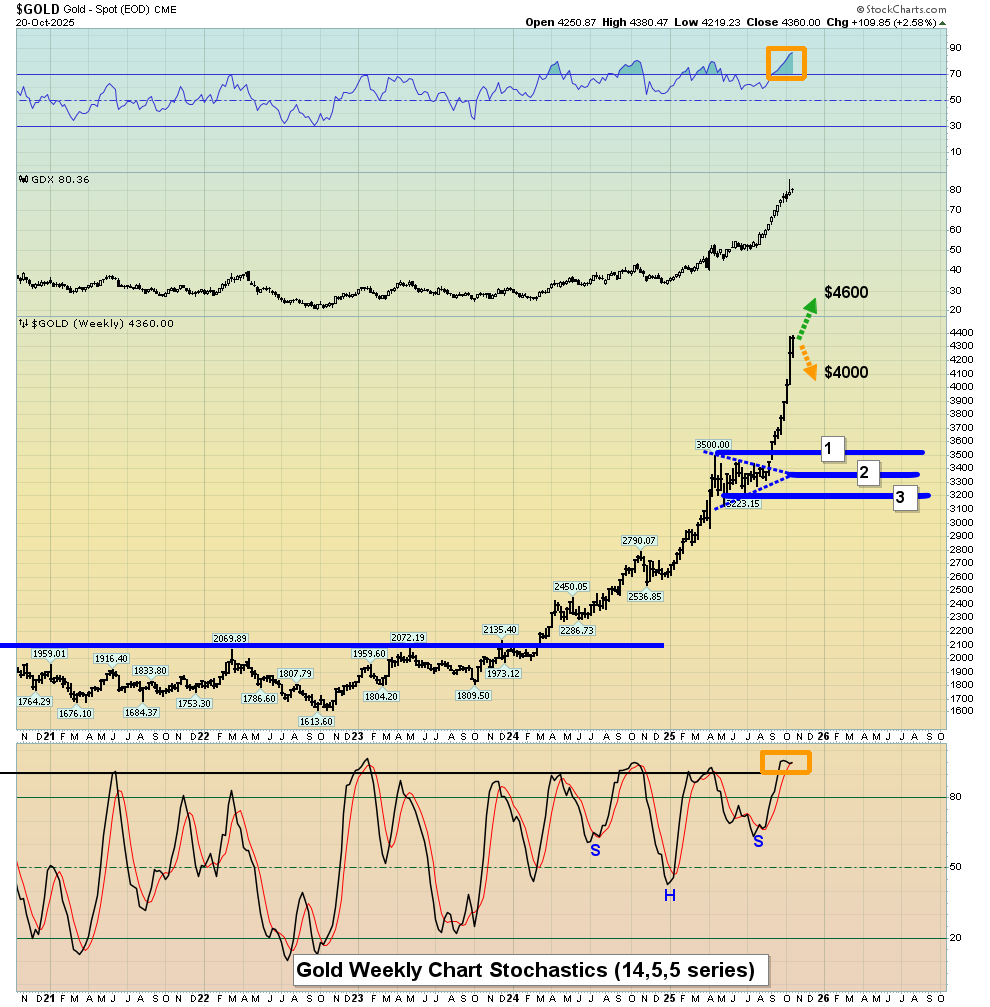
It could also be a bullish rectangle that targets $4600.
For further insight into the matter, the silver chart can be of assistance.
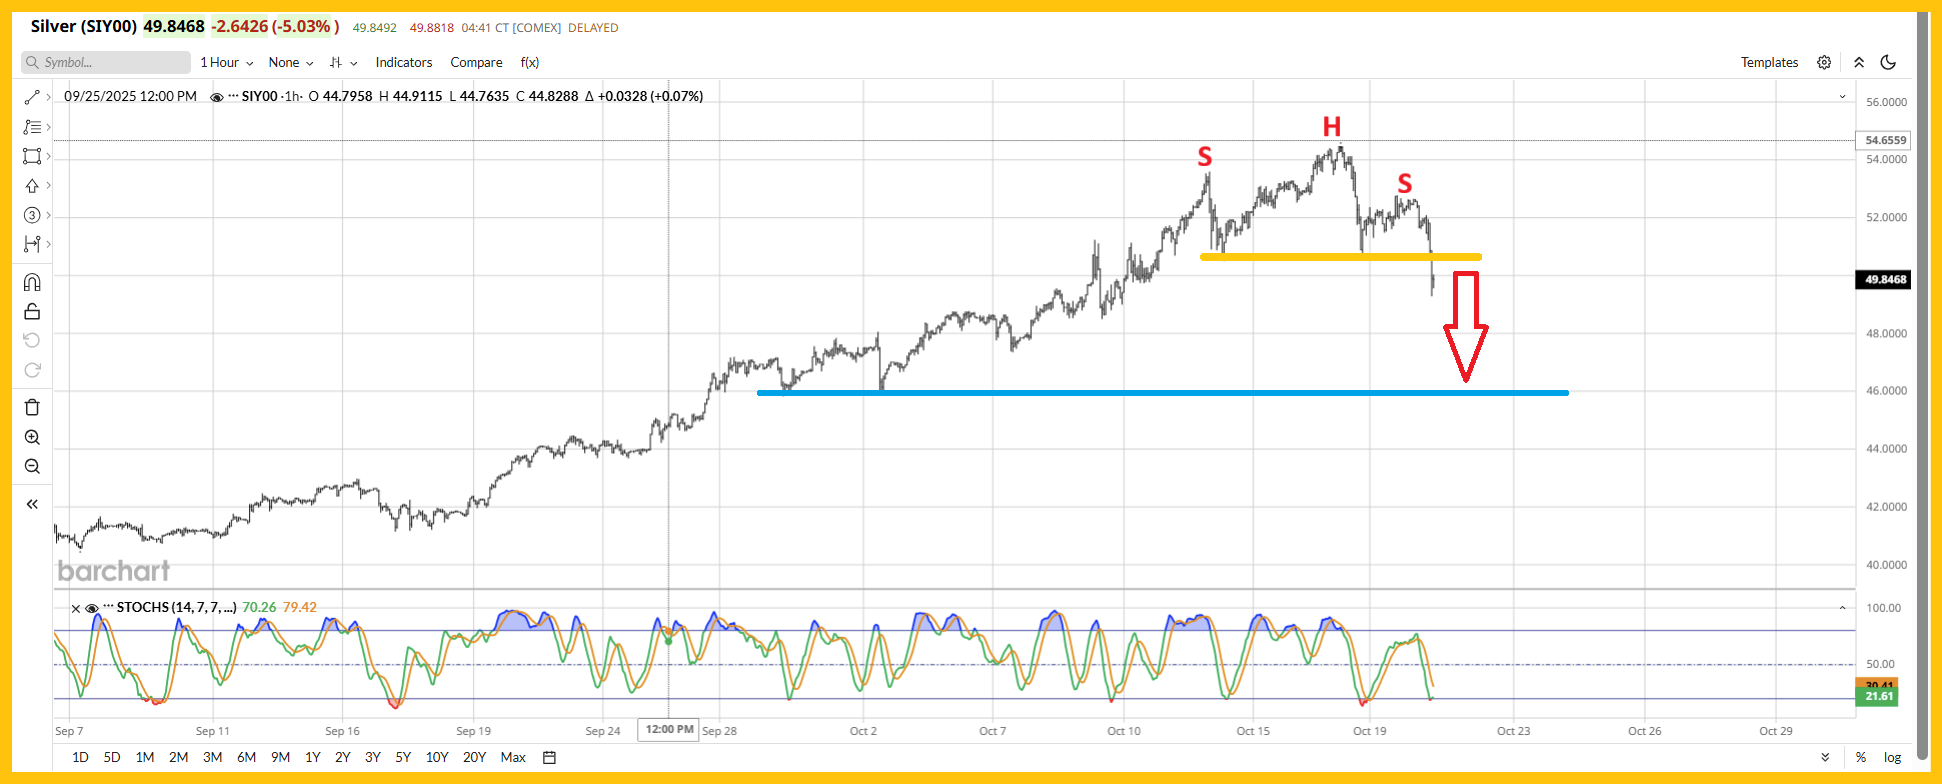
The bears take charge! A H&S top is evident, and the neckline has been broken. The technical target is about $46.
For further clarity:
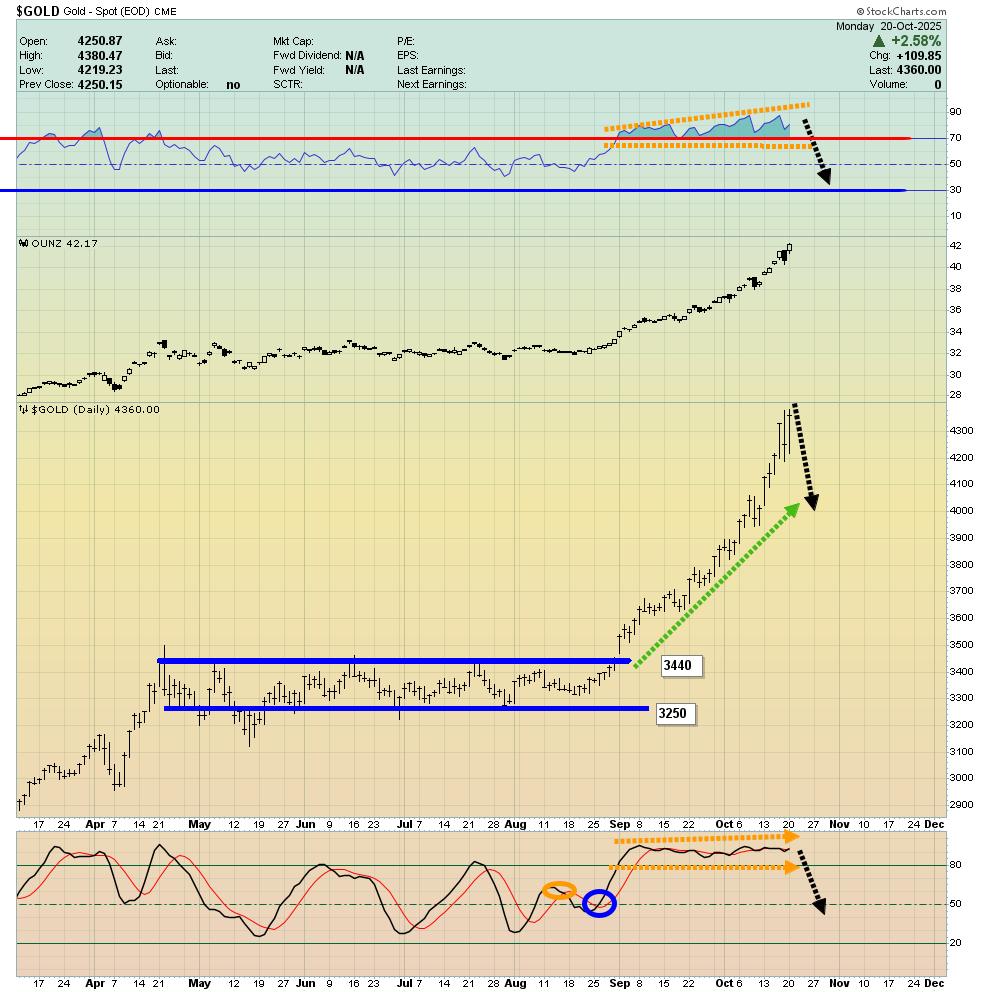
This is the stunning daily chart for gold. A rare broadening top has formed on the RSI oscillator and like Stochastics, it’s been overbought for seven incredible weeks.
To view the weekly chart:
Gamblers and investors with no gold at all can buy the $4000 area or a breakout over $4380.
Everyone else may want to consider focusing on the big congestion zone between $3500 and $3200 as the area to buy.
How much profit should be booked? That depends on the individual investor, but a rough rule of thumb is that hardcore gold bullion bugs could book fiat profits for up to 30% of their position, while fiat bugs using gold to get more fiat could sell as much as 70% of their holdings.
Gamblers can buy or sell any amount at any time, because, simply put, there aren’t many rules in a casino.
Investors who are leveraged should consider significantly reducing or eliminating the use of borrowed funds, at least for now.
What about Elliott Wave?
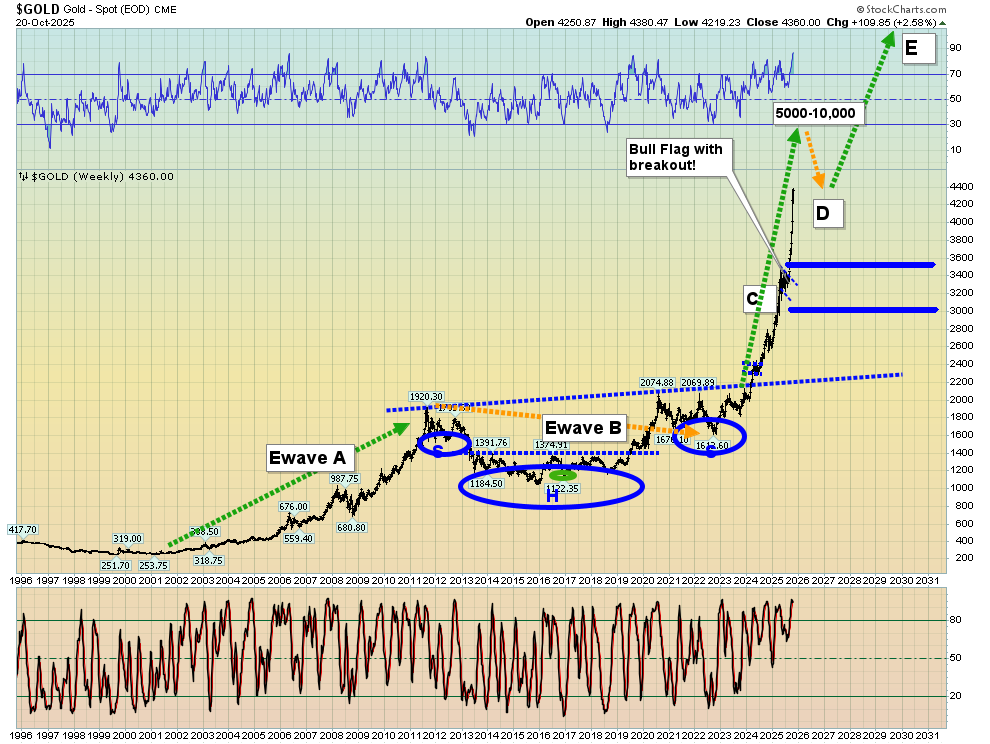
The huge C wave surge has been glorious, but all great parties do have to stop at some point, even if only temporarily.
The good news is that the current tumble is unlikely to mark the end of that big wave… and in fact the strongest part of it may lie ahead, carrying the gold price to $5000 or even $10,000.
What about the end of “final” Wave E? Well, I’ve suggested a very ominous US stock market 100year anniversary event could occur in October of 2029. That’s a full four years away and I expect it to play out something like the 2008 crash did for gold…
Meaning it could end in just months rather than drag on years like the declines (gulags?) of 2013-2023 and 1980-2000 did.
The miners?
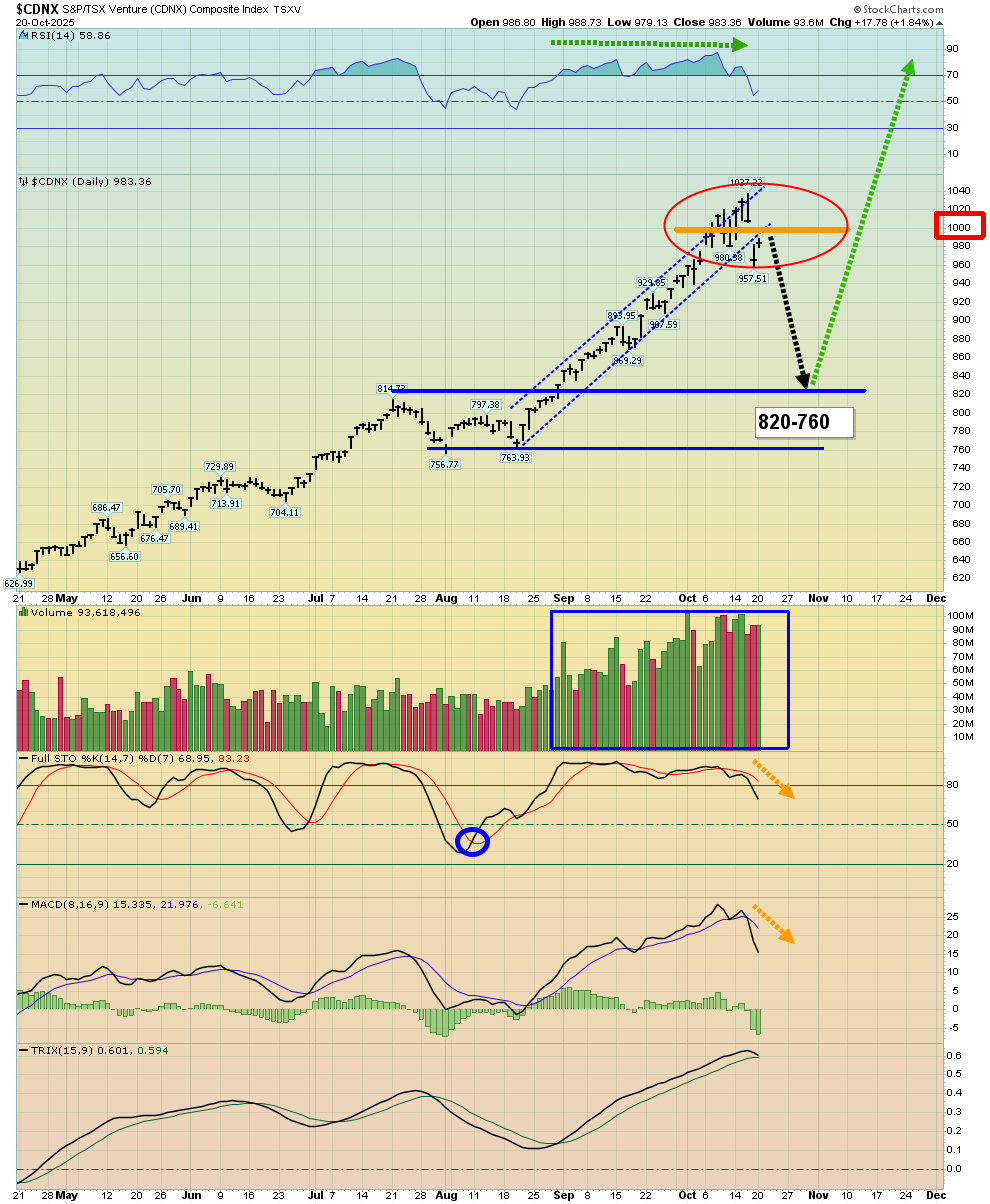
This is the CDNX daily chart. Like gold and silver bullion, the miners rallied and held a technically overbought position for almost two months.
Some pullback now is healthy and normal, and for the juniors that pullback could end in the 820-760 CDNX congestion zone.
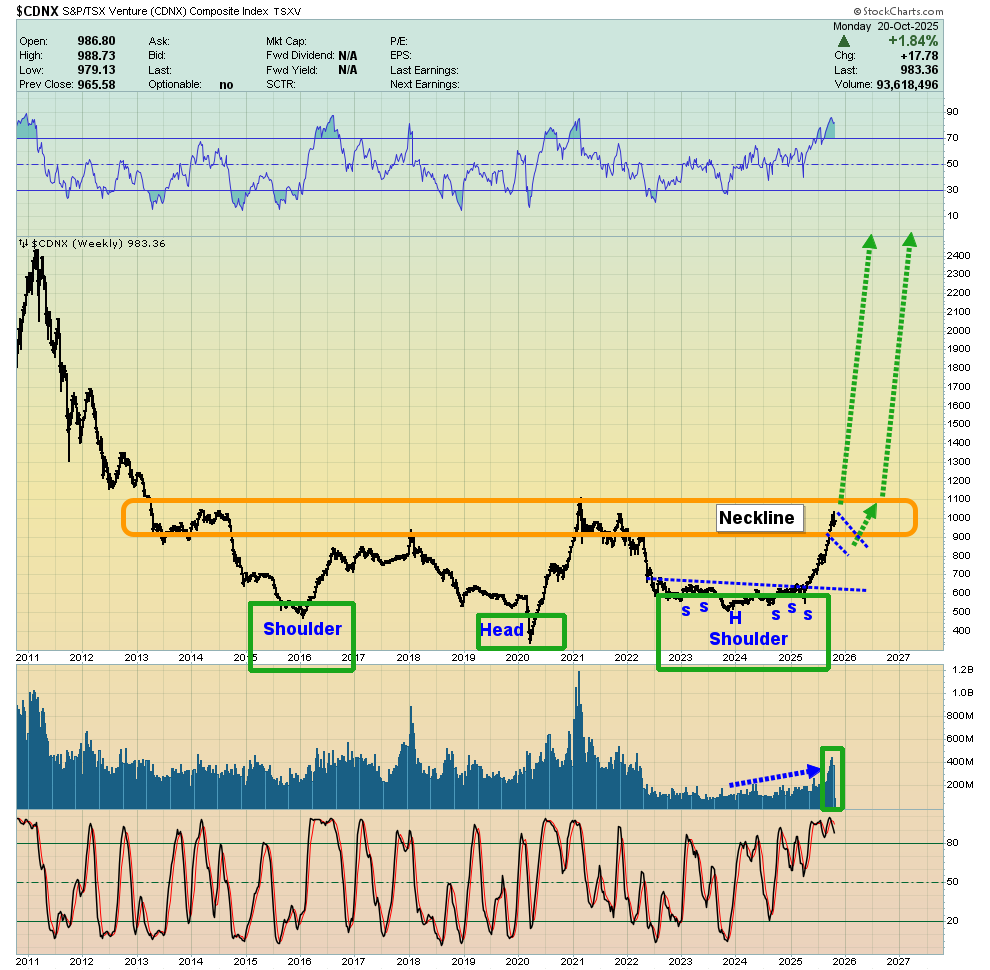
On the weekly chart that pullback would likely create a bull flag, and it could be followed by a thunderous surge… as the biggest part of the Elliott C Wave carries gold towards previously unimaginable heights!
Junior mine stock investing isn’t for everyone, especially with size, but as this gargantuan gold bull era rollout continues, these miners look set to outperform everything! At $199/year, my junior resource stocks newsletter is an investor favourite, and I’m doing a special pricing this week of $169 for 14mths! Send me an email or click this link if you want the special offer and I’ll get you onboard. Thanks!
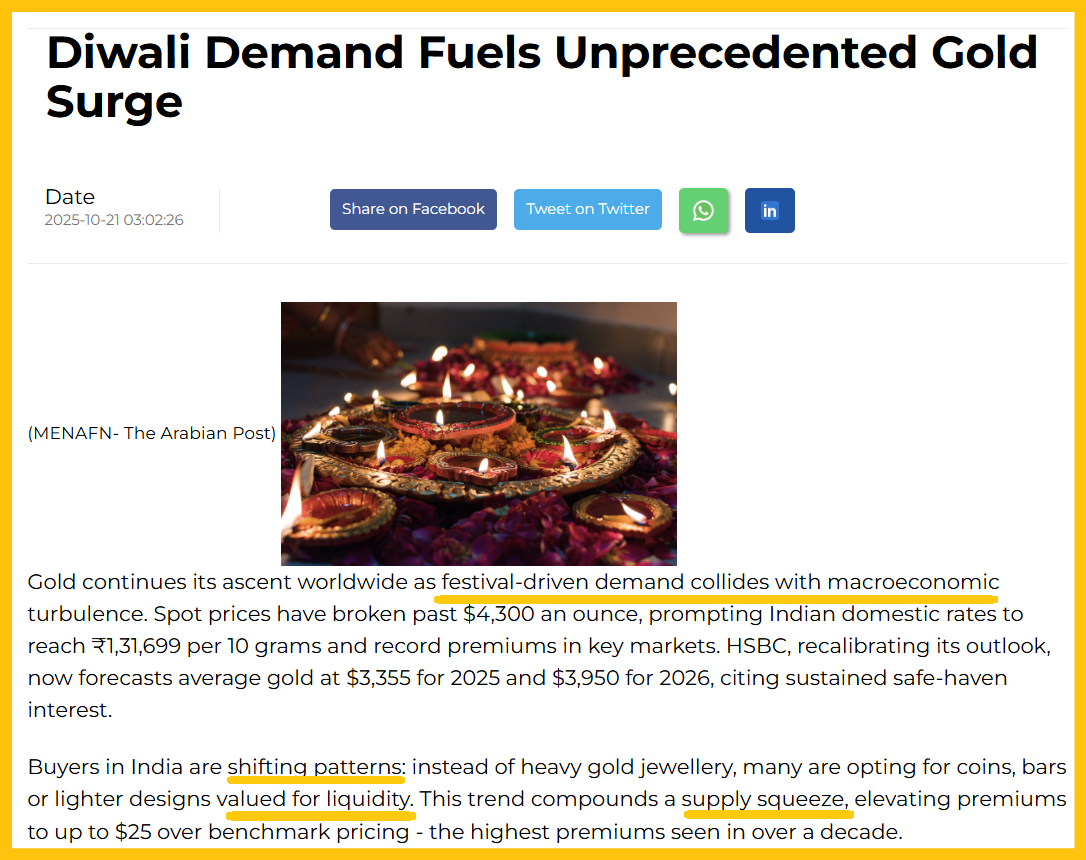
A wondrous love trade and fear trade collision is in play. In time, the coming (or already underway?) pullback will be little more than dust in a bull era wind.
In the West gold stocks are like ornamental jewellery in the East. There’s more volatility than with gold, for even the mightiest miners, but they are on the cusp of a new era that could see them stage the greatest bull run in the history of markets.
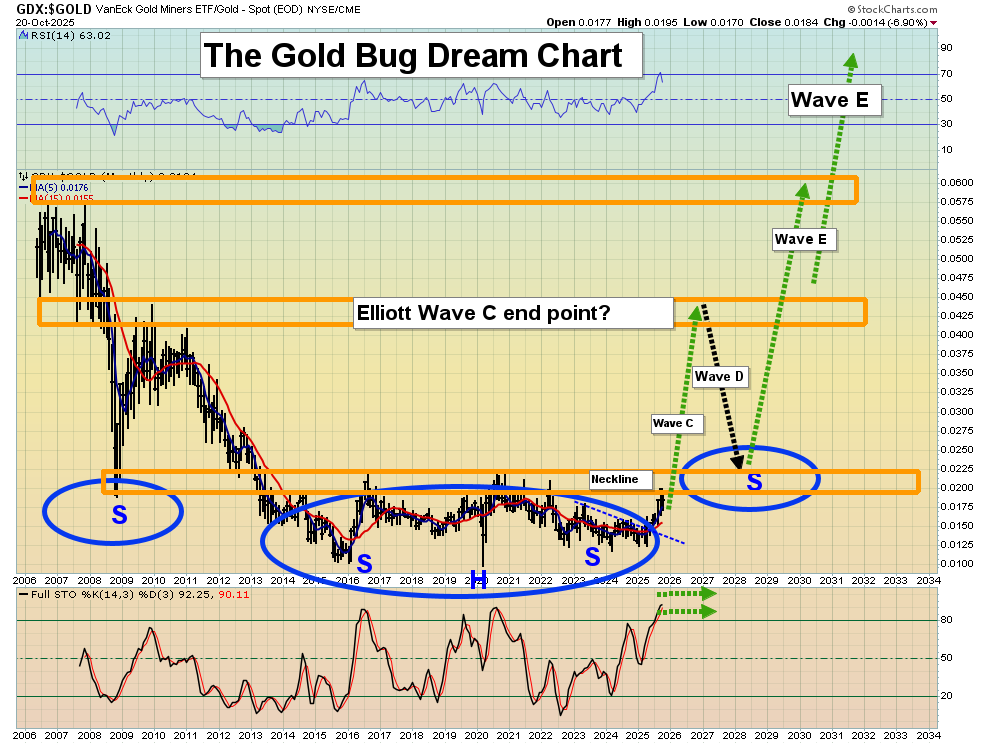
This is the fabulous GDX versus gold chart. The current pullback is likely simply setting up the launch of a massive Elliott C Wave that, until now, has lagged gold.
For a look at GDX priced in vile US fiat:
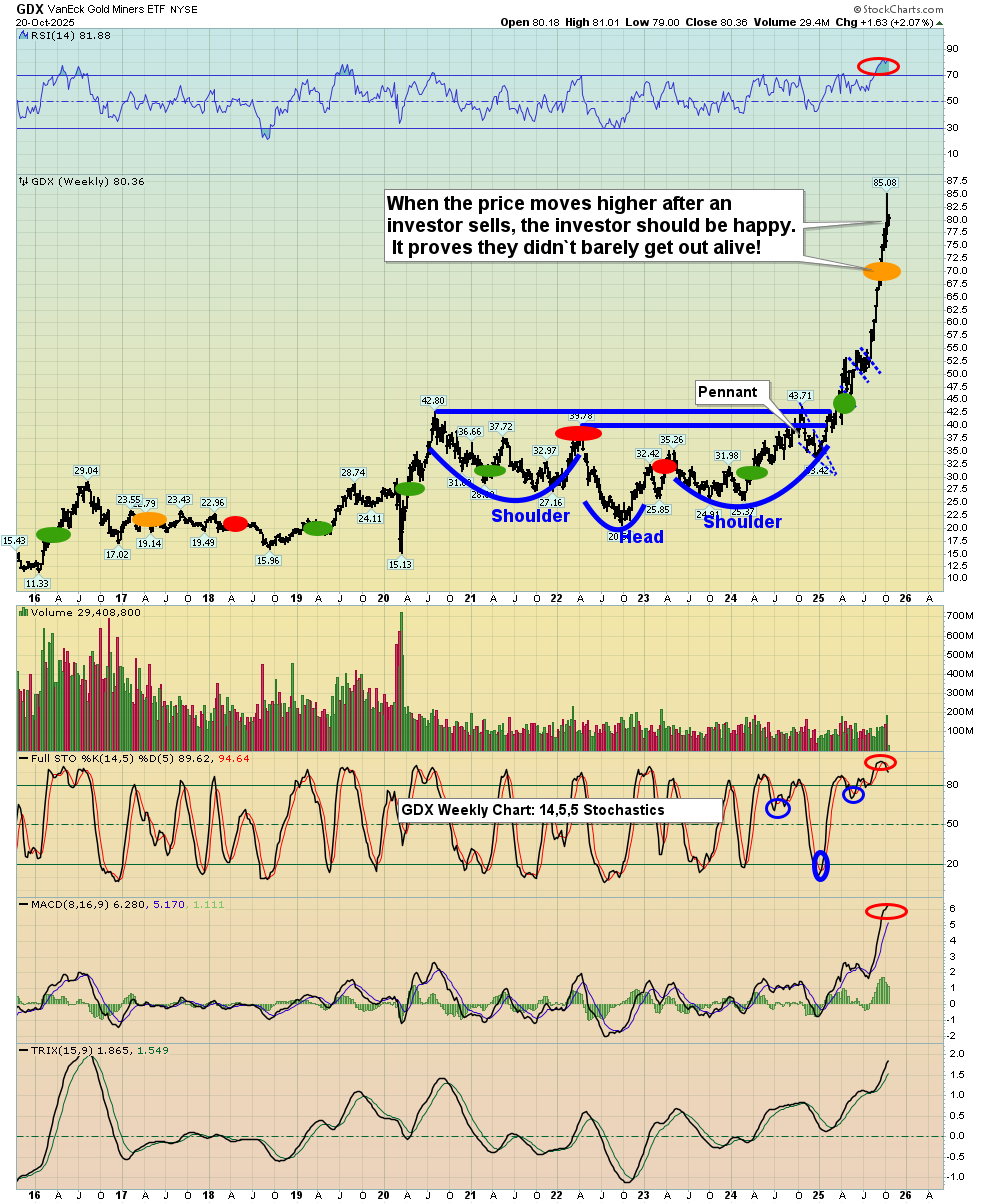
I suggested that gold stock enthusiasts could begin booking light profits at $70 and steadily intensify their action if the price continued to rise, which it did.
For a look at the daily chart:
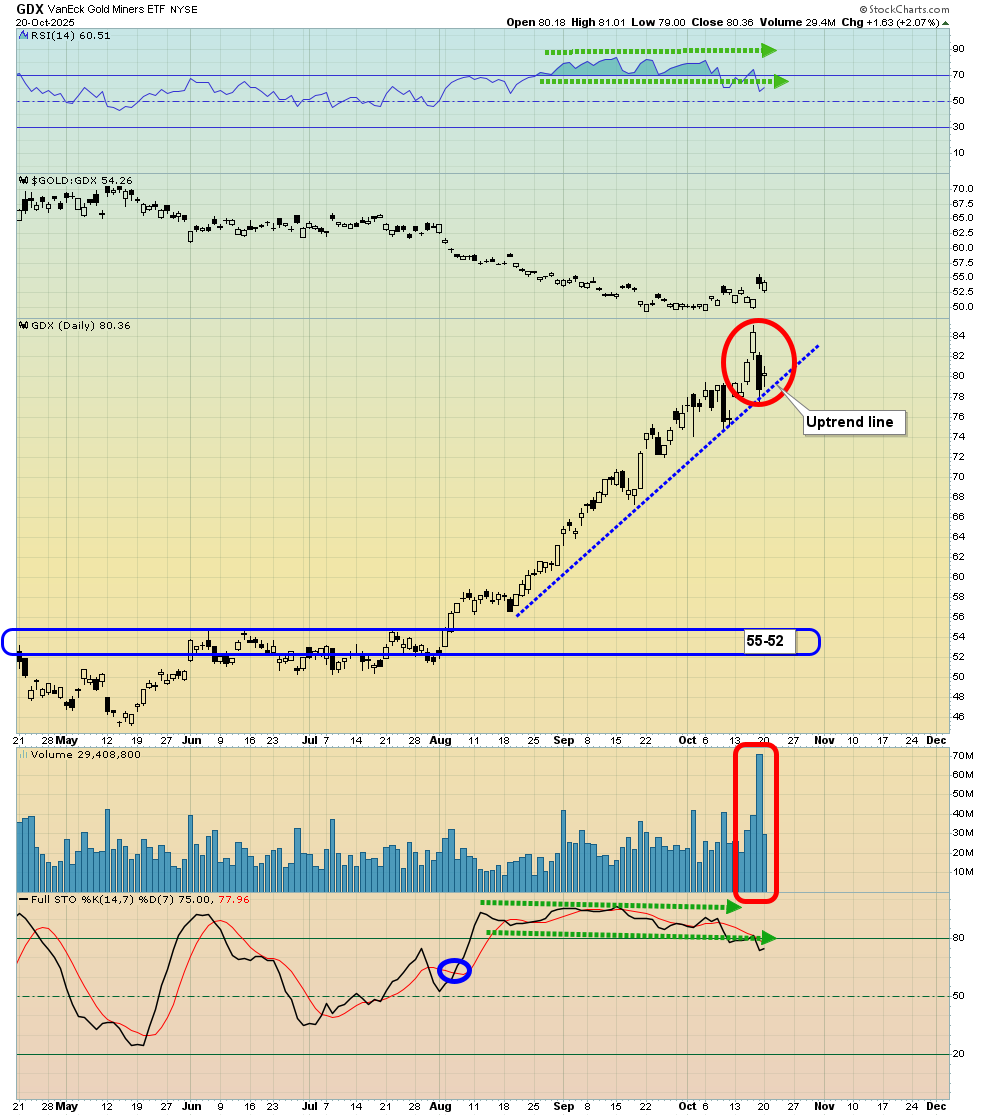
The huge volume bar needs to be respected, at least in the short-term. The uptrend line likely breaks today, getting the pullback “officially underway”. From there, gamblers could look to buy the miners in the $4060-$3960 zone for gold, and investors could focus on $3500-$3200… which may or may not occur. In a nutshell, it’s been a magnificent ride, and an even more magnificent one should follow this needed pause.
Thanks!
Cheers
St
Special Offer For Gold-Eagle Readers: Please send me an Email to [email protected] and I’ll send you my free “Get Jacked With J!” report. I highlight key GDXJ stocks that could surge after Fed man Jay’s speech this week! Both core and trading position tactics are included in the report.
Stewart Thomson
Galactic Updates
Note: We are privacy oriented. We accept cheques, credit card, and if needed, PayPal.
Written between 4am-7am. 5-6 issues per week. Emailed at aprox 9am dailyhttps://www.gracelandupdates.com/
Email:
Rate Sheet (us funds):
Lifetime: $1299
2yr: $299 (over 500 issues)
1yr: $199 (over 250 issues)
6 mths: $129 (over 125 issues)
To pay by credit card/paypal, please click this link:
https://gracelandupdates.com/subscribe-pp/
To pay by cheque, make cheque payable to “Stewart Thomson”
Mail to:
Stewart Thomson / 1276 Lakeview Drive / Oakville, Ontario L6H 2M8 Canada
Stewart Thomson is a retired Merrill Lynch broker. Stewart writes the Graceland Updates daily between 4am-7am. They are sent out around 8am-9am. The newsletter is attractively priced and the format is a unique numbered point form. Giving clarity of each point and saving valuable reading time.
Risks, Disclaimers, Legal
Stewart Thomson is no longer an investment advisor. The information provided by Stewart and Graceland Updates is for general information purposes only. Before taking any action on any investment, it is imperative that you consult with multiple properly licensed, experienced and qualified investment advisors and get numerous opinions before taking any action. Your minimum risk on any investment in the world is: 100% loss of all your money. You may be taking or preparing to take leveraged positions in investments and not know it, exposing yourself to unlimited risks. This is highly concerning if you are an investor in any derivatives products. There is an approx $700 trillion OTC Derivatives Iceberg with a tiny portion written off officially. The bottom line:
Are You Prepared?
********
 Stewart Thomson is president of Graceland Investment Management (Cayman) Ltd. Stewart was a very good English literature student, which helped him develop a unique way of communicating his investment ideas. He developed the “PGEN”, which is a unique capital allocation program. It is designed to allow investors of any size to mimic the action of the banks. Stewart owns GU Trader, which is a unique gold futures/ETF trading service, which closes out all trades by 5pm each day. High net worth individuals around the world follow Stewart on a daily basis. Website: www.gracelandupdates.com.


