Gold Flies, Silver Highs … Both Into End-of-Week Demise


Recall from last week’s piece our notion of the prices for both Gold and Silver “basing” rather then succumbing to indications of further downside?
“Right, mmb, ’cause your ‘Baby Blues’ of trend consistency were still dropping, but prices were holding…”
Spot-on as ever you are, Squire. And following such “basing”, this past week saw the precious metals soar to the sky, notably so Silver which on Thursday recorded another All-Time High at 54.42 … only to then fall on Friday from the blue. To be sure, come that record high, Silver was up as much as +12.8% in just four trading days, then settling yesterday (Friday) at 50.40 with still a welcome +4.5% gain for the week. Gold also come Thursday saw its price fly, reaching as high as 4250 (+6.0% then week-to-date) only to also suffer demise with a comparatively weaker weekly gain of +1.9% in closing at 4084.
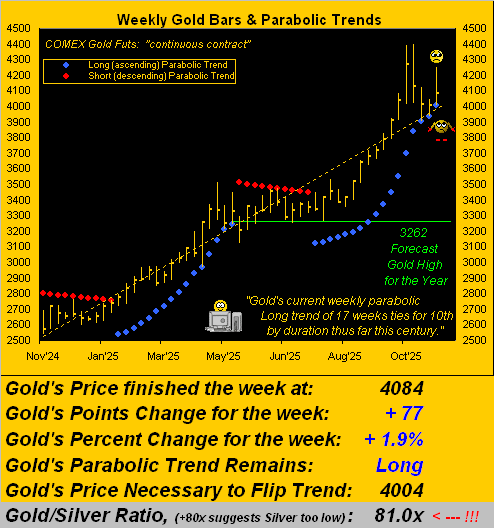
Specific to Gold, its recent weekly losing streak was held to three. However, this past up week has left little room for the parabolic Long trend to continue, (barring price shooting higher come Monday). Gold’s expected daily trading range is now 103 points and the weekly 178 points. But as we turn to Gold’s weekly bars from a year ago-to-date, from the current 4084 price to the “flip-to-Short” level at 4004 is just -80 points from here, and thus is well within reach of a single day’s trading session. Too, during Friday’s demise, Gold high-to-low fell -183 points (-4.3%), i.e. its present trading momentum is negative:
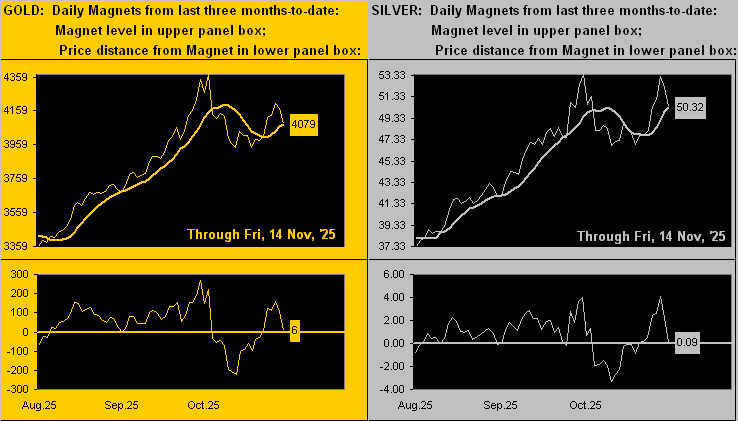
As well, this is a fine opportunity to share from the website the Market Magnets for Gold below on the left with Silver on the right. Derived from the Market Profiles, a Market Magnet is essentially the volume-weighted consensus price across the past fortnight. We refer to it as a “Magnet” as ’tis difficult for price to stray too far away before snapping back to the Magnet, (which itself, of course, doesn’t stay static). Both panels show the last three months-to-date, price being the thin line and the Magnet — as labeled at right — the thick line. The oscillator at the foot of each panel is the difference of price less Magnet. And when price penetrates the Magnet, ’tis the near-term direction in which to trade, (although as we regularly caution: “Shorting Gold is a bad idea.”) That nonetheless stated, both metals now look poised to pierce their respective Magnets to the downside:
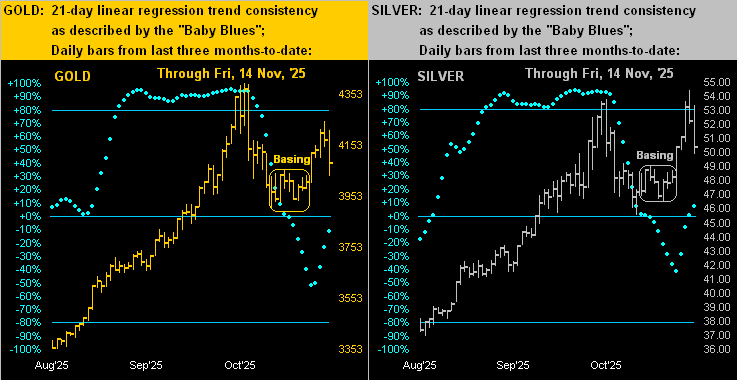
In staying with the three months-to-date theme, here next we’ve the daily bars and (as Squire referenced) “Baby Blues”, the dots which depict the consistency of trend. Below for both Gold at left and Silver at right we’ve encircled the aforementioned “basing” period prior to last week’s rallies. And for both metals, such price climbs have been sufficient to reverse the “Baby Blues” from their respective declines. That however noted, the rightmost bar in each case shows the bulk of Friday’s gains having evaporated:
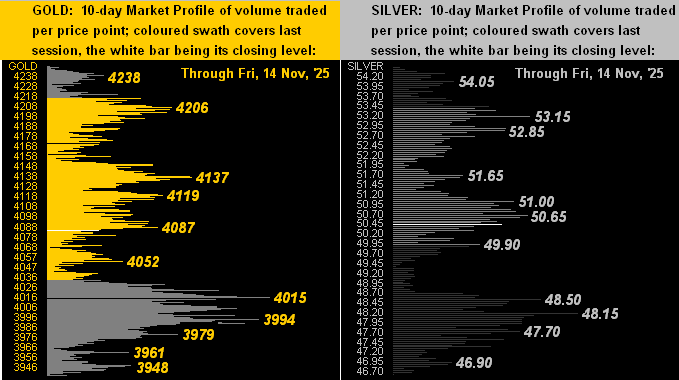
In turn, such price pullback is well-reflected in the 10-day Market Profiles for Gold (below left) and Silver (below right). The single white bars (present prices) in each panel are currently at the midpoints of these last two weeks, with a bevy of labeled support and resistance levels all ’round:
Still, what need be rounded up is all the missing data for the Economic Barometer. Through the concluded (for now) StateSide government “shutdown” — plus these initial days beyond — 54 of 75 incoming Econ Baro metrics have gone unreported, if even calculated. (Wednesday’s White House expectedly-biased presser included: “…The Democrats may have permanently damaged the federal statistical system, with October CPI and jobs reports likely never being released, and all of that economic data released will be permanently impaired, leaving our policymakers at the Fed flying blind at a critical period…”)
Politics aside, the Federal Open Market Committee’s next meeting (09-10 December) shall have a dearth of data with which not to deal, in turn affecting in the Policy Statement their otherwise boilerplate phrase “…the Committee will continue to monitor the implications of incoming information for the economic outlook…” ‘Course, a good three weeks of data comes due between now and then … to the extent it can be pieced together as the government reporting bureaus come back on line.
As for the 21 metrics privately reported during the “shutdown”, period-over-period saw nine improve and 12 worsen; (we’ll do our part to try to fax that fact over to the FOMC). Either way at the end of it all, here’s the Baro on balance still standing tall, but sans so many metrics that it could well fall:
And per the above graphic, is the S&P 500 (“live” price/earnings ratio 54.4x) wisely waving the white flag? Our preference is instead the Gold flag as we go to the Stack:
The Gold Stack (continuous contract pricing):
Gold’s All-Time Intra-Day High: 4392 (20 October 2025)
2025’s High: 4392 (20 October 2025)
Gold’s All-Time Closing High: 4374 (20 October 2025)
10-Session directional range: up to 4248 (from 3938) = +310 points or +7.9%
Trading Resistance: Profile notables 4087 / 4119 / 4137 / 4206 / 4238
Gold Currently: 4084, (expected daily trading range [“EDTR”]: 103 points)
10-Session “volume-weighted” average price magnet: 4079
Trading Support: Profile notables 4052 / 4015 / 3994 / 3979 / 3961 / 3948
The Weekly Parabolic Price to flip Short: 4004
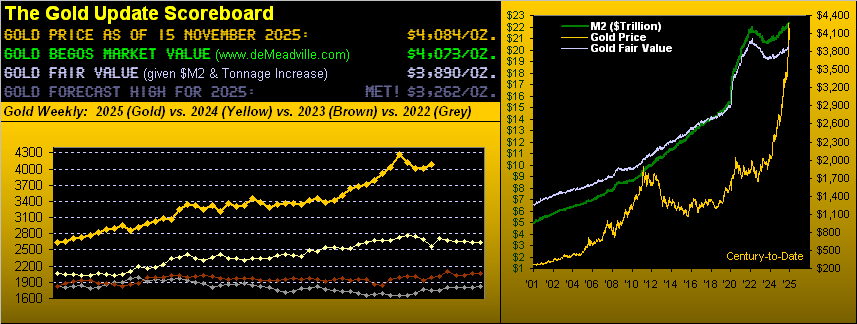
Gold’s Fair Value per Dollar Debasement, (from our opening “Scoreboard”): 3890
The 300-Day Moving Average: 3168 and rising
2025’s Low: 2625 (06 January)
The 2000’s Triple-Top: 2089 (07 Aug ’20); 2079 (08 Mar’22); 2085 (04 May ’23)
The Gateway to 2000: 1900+
The Final Frontier: 1800-1900
The Northern Front: 1800-1750
On Maneuvers: 1750-1579
The Floor: 1579-1466
Le Sous-sol: Sub-1466
The Support Shelf: 1454-1434
Base Camp: 1377
The 1360s Double-Top: 1369 in Apr ’18 preceded by 1362 in Sep ’17
Neverland: The Whiny 1290s
The Box: 1280-1240
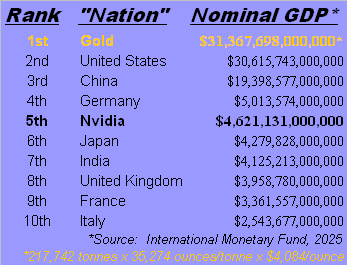
Let’s wind it up here with a brief revisit of Nvidia about which we mused in last 12 July’s missive. At today’s writing, NVDA again is at the top of the S&P pops, sporting a spritely market capitalization of $4.6T, which would make it the fourth-largest nation by nominal Gross Domestic Product in the world! However, (for those of you scoring at home), that compares to its present balance sheet net worth of “only” $100B.
Now: imagine you are buying in the States a new house, the median value for which in August was $413,500. Query: would you instead pay $19,108,377 for that house? Obviously no. Yet if NVDA today was that house, that’s how much you’d pay for it, (were you a wealthy, albeit daft, WestPalmBeacher down there).
“But, mmb, the price of NVDA is discounting its future earnings.”
Squire, a word to the wise is sufficient: the future is now.
Indeed as to “The Now”, in ranking the market caps of both the yellow metal and NVDA amongst the largest nominal GDP countries in the world, near-term demise or otherwise, proudly we say for Gold Nation: “We’re Number One!”
Cheers!
…m…
www.TheGoldUpdate.com
www.deMeadville.com
and now on “X”: @deMeadvillePro
********

Mark Mead Baillie has had an extensive business career beginning in banking and financial services for two years with Banque Nationale de Paris to corporate research for three years at Barclays Bank and then for six years as an analyst and corporate lender with Société Générale.
For the last 22 years he has expanded his financial expertise by creating his own financial services company, de Meadville International, which comprehensively follows his BEGOS complex of markets (Bond/Euro/Gold/Oil/S&P) and the trading of the futures therein. He is recognized within the financial community of demonstrating creative technical skills that surpass industry standards toward making highly informed market assessments and his work is featured in Merrill Lynch Wealth Management client presentations. He has adapted such skills into becoming the popular author each week of the prolific “The Gold Update” and is known in the financial website community as “mmb” and “deMeadville”.
Mr. Baillie holds a BS in Business from the University of Southern California and an MBA in Finance from Golden Gate University.


