The “150 Billion Dollar Baby” No More


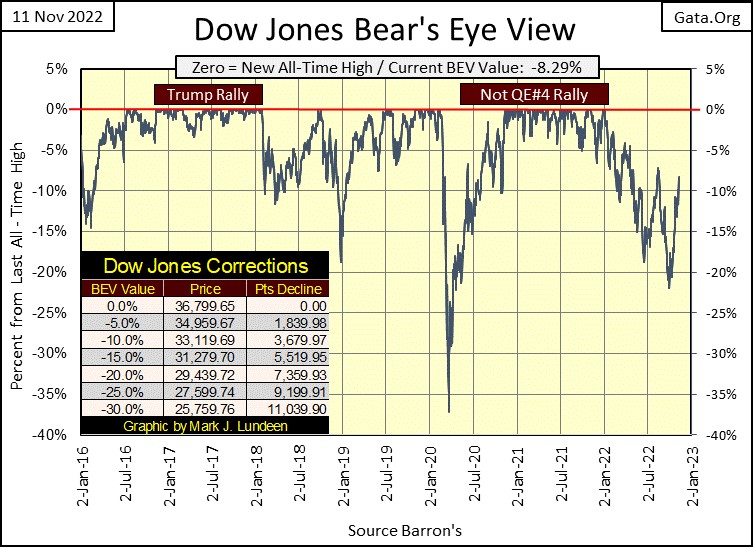
Look at the Dow Jones in the BEV chart below. Since its BEV -21.94% low of September 30th, it’s advanced to a BEV -8.29% in the past thirty NYSE trading sessions. In dollar terms this is an advance of 5022 points; a nice advance indeed. So, what’s next? I’m thinking we’ll see more of the same, until it starts going back down again, as I’m still thinking we’re only seeing a correction within a greater bear market.
The Dow Jones may break above its BEV -5% line, and maybe even make some new BEV Zeros (0.0% = new all-time high). But I don’t like the way it’s going up; the stench of Mr Bear gives this advance a bad smell.
How’s that? Look at Mr Bear’s Report Cards below, for March 2020 and then for this week too. If the history of the Dow Jones, going all the way back to February 1885 tells us anything, it’s that bull market advances are quiet affairs. Walking, not running into market history, in little tiny baby steps, one day at a time.
It’s during bear markets when the Dow Jones sees its Days of Extreme Volatility, aka Dow Jones 2% days, days where the Dow Jones closes up or down 2% or more from a previous day’s closing price. The same is true for days of extreme market breadth, or NYSE 70% A-D days.
Here’s Mr Bear’s report card from late March 2020, and what a wild and volatile four weeks we see below! Not since the Great Depression have we seen market action like this. It was in this market chaos that the FOMC began flooding the system with “liquidity” in March 2020, with its massive Not QE#4.
Look at the Dow Jones’ 8- & 200-day counts. On March 18th the 8-count saw eight consecutive Dow Jones 2% days in a row, for a count of 8. The only other time that happened was in October 1933, during the Great Depression.
Then the 200-day count went from a 9 to a 25 IN ONLY TWENTY TRADING DAYS! It looked like the end of the world in late March 2020! Which proved to be a good time to buy.
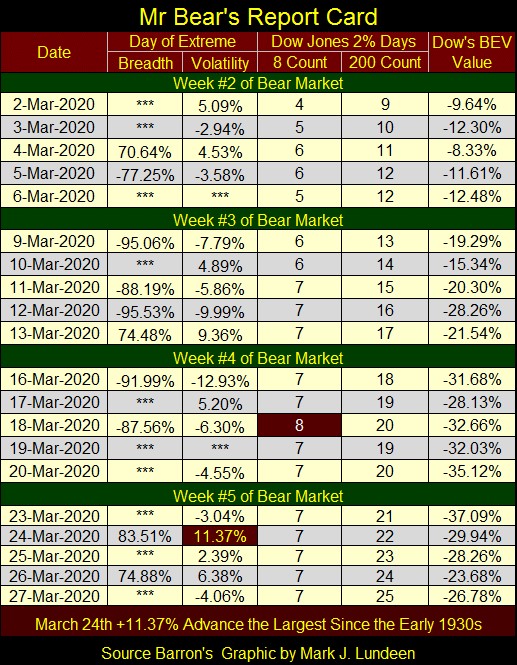
Back to November 2022 (below); that these 2% days are positive means nothing. During the Great Depression Crash, and the Sub-Prime Mortgage Crash (the #1&2 deepest bear market percentage declines for the Dow Jones) both saw daily ADVANCES above 10% from one day to the next. Look at March 24th in the table above. Big bear market also sees big down days, but usually not as big as their daily advances. Sure, a bull market can see a Dow Jones 2% day, but typically you’ll have to wait a year or more before it sees another.
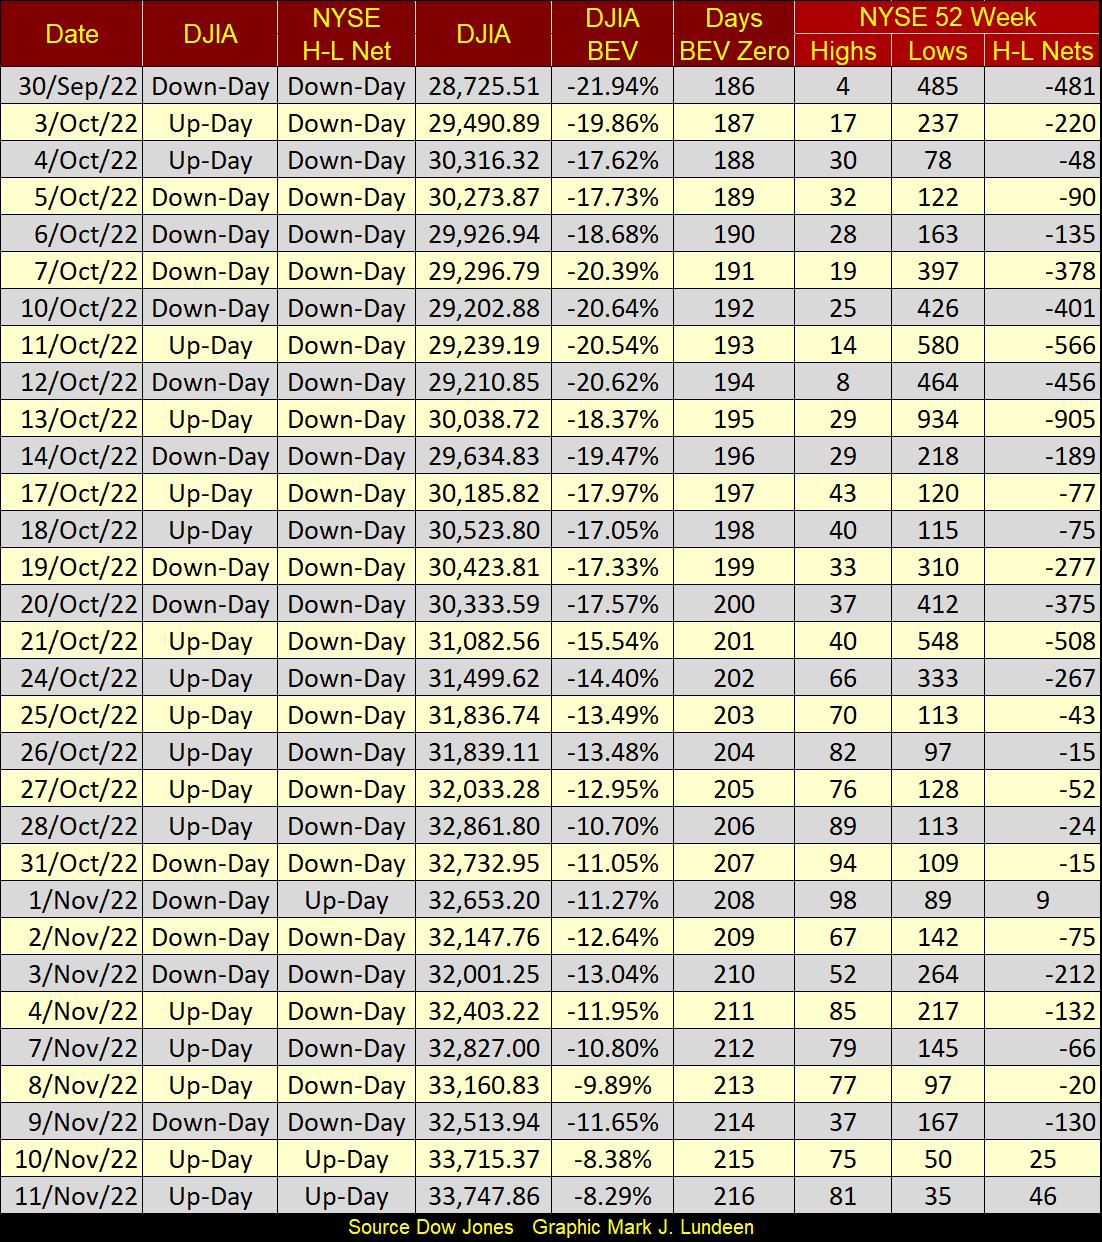
Look at Mr Bear’s Report Card below. Since October 21st the Dow Jones has seen three days of extreme volatility, each a BIG DAILY ADVANCE. Since the beginning of 2022, when the Dow Jones saw its last all-time high, the Dow Jones has seen twenty-five Dow Jones 2% days in total. Something isn’t right here!
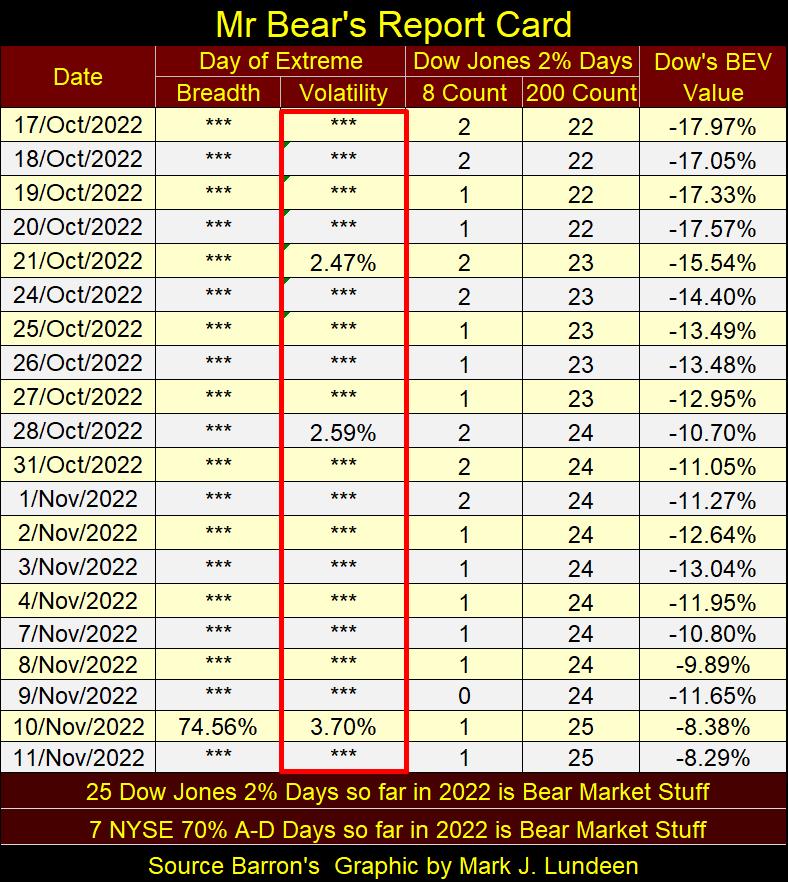
Then over at the NYSE; it has seen seven 70% A-D days since 2022 began. NYSE 70% A-D days are even rarer market events than are Dow Jones 2% days. But like multiple 2% days for the Dow Jones, these multiple NYSE 70% A-D days are bear market events.
If you’re making some money right now being bullish on the market, good for you, and you may just as well let your profits run. Just remember it’s a bear market, so don’t become married to your positions. No matter how attractive she may appear to you tonight, tomorrow the saucy little tart will betray you.
Me? I’m out and I’m staying out until the Dow Jones breaks below its BEV -40% line. I may just wait until the Dow Jones breaks below its BEV -70% before I find anything interesting in the stock market, other than a gold and silver miner.
Moving down to my Major Market Index BEV Table below, we see a BEV Zero in the NASDAQ Insurance index on Thursday’s close. We haven’t seen a BEV Zero for months, and that was for the Dow Jones Utilities last April and March. With the current bear market in bonds and mortgages, I don’t understand why it’s an insurance index that’s seeing new all-time highs, but it is what it is.
Don’t see any indexes in scoring position; BEVs of less than -5%. Maybe we’ll see some next week, but I’m not holding my breath. But maybe I should; look at the advances these indexes made from Wednesday to Thursday’s close. Big advances; many 4% BEV advances. A couple of days like that next week and this table will change a lot. But if so, it will only be Mr Bear making a sucker’s rally to draw in the unwary to their doom.
This is something that happens early in bear markets; investors still believe it’s a bull market, and so are eager to jump back in on a market rally. Except this market is seeing way too many days of extreme volatility and breadth (Dow Jones 2% days & NYSE 70% A-D) for me to believe buying in this market is advisable.
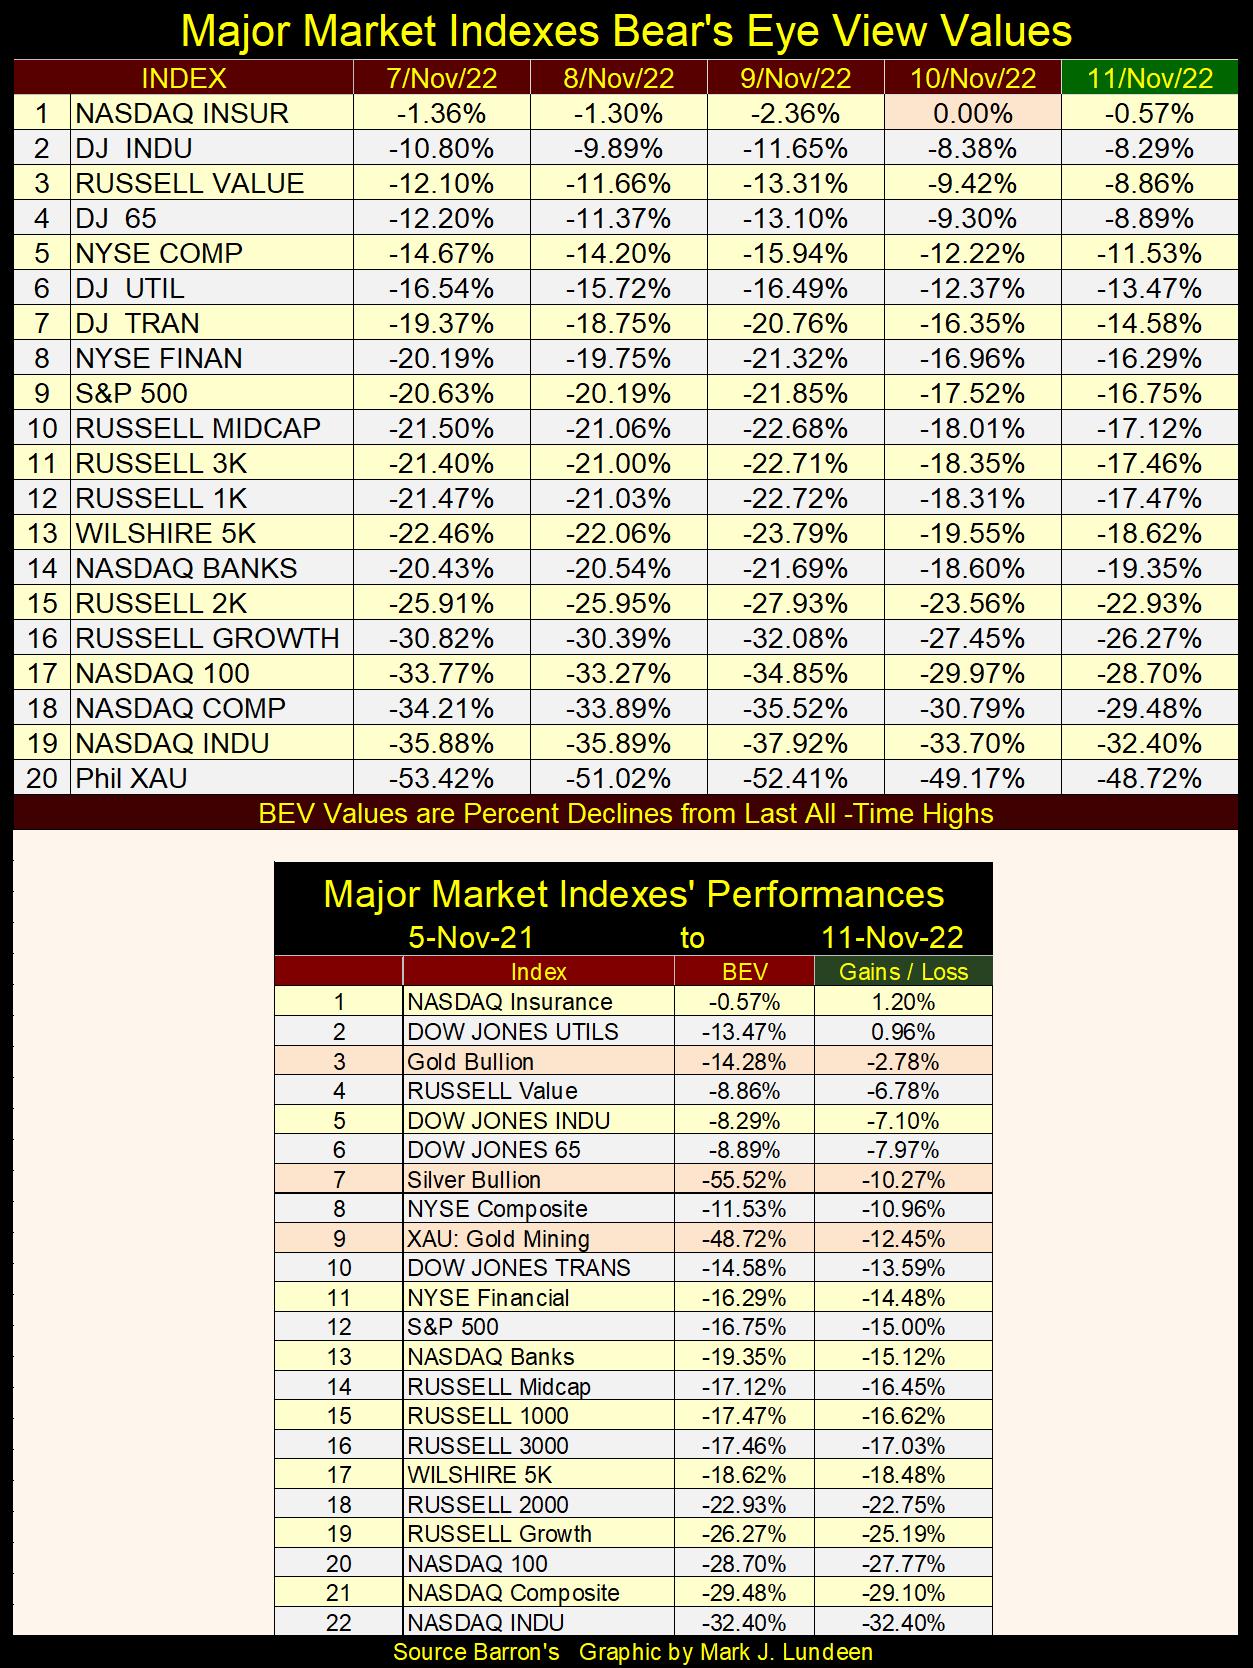
Again, at the end of this week in the table above, gold, silver and the XAU are all within the top 10 in performance since last November 2021. That everyone is still looking towards the stock market for their next move, while almost no one is looking at precious metal investments, strongly suggests the real action to come will be in the precious metals.
Here are two facts of life in the market;
- Early in bear markets, people continue thinking it’s a bull market, like now with the stock market.
- Early in bull markets, people continue thinking it’s a bear market, like now with precious metal assets.
Seeing almost no coverage of gold and silver’s superior performance, as seen in the table above, gives me confidence the place to be is in gold and silver bullion, as well as investing in the gold and silver miners.
The stock market’s major indexes seen above may be coming back. But over at the NYSE, its having difficulty in generating new 52Wk highs in the table below. This could change in the coming months. The stock market sometimes sees a Santa Claus rally at the end of the year. But I’m a Big-Bad Bear on this market. I’m thinking before we see a H-L Net of +150 in the table below, we’ll see a H-L net of -500. Time will tell all.
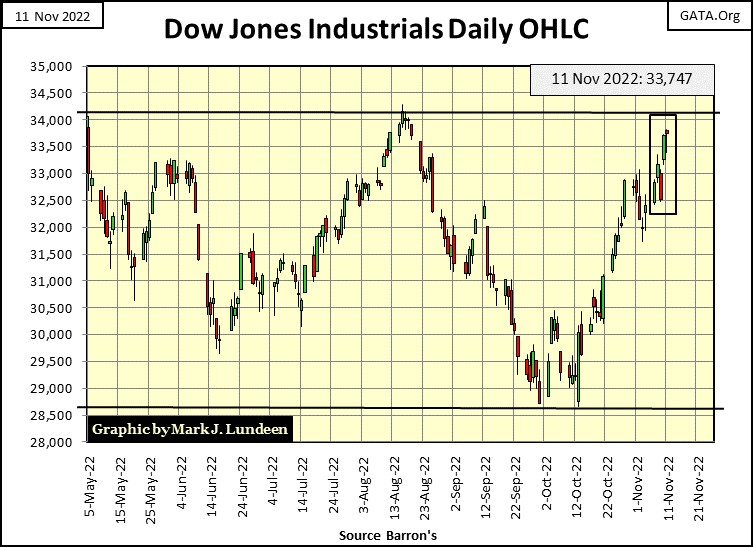
Well, damn the NYSE and its lack of 52Wk highs. The Dow Jones in its daily bar chart below is looking really good. No, it really does.
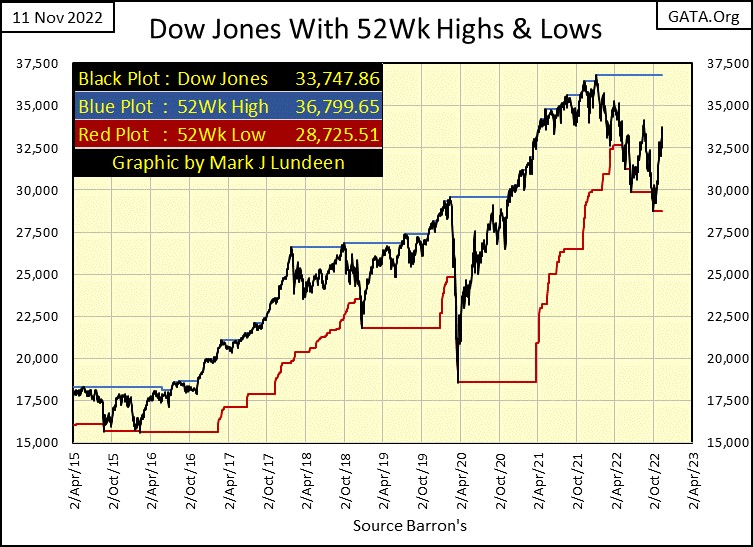
So does the Dow Jones plotted with its 52Wk High and Low lines below. Since its lows of September 30th (28,725.51), the Dow Jones has advanced 5,022 points. I’m not going to argue with success; the stock market is headed higher. I just believe this is a very dangerous market to risk one’s money in, so I’m out.
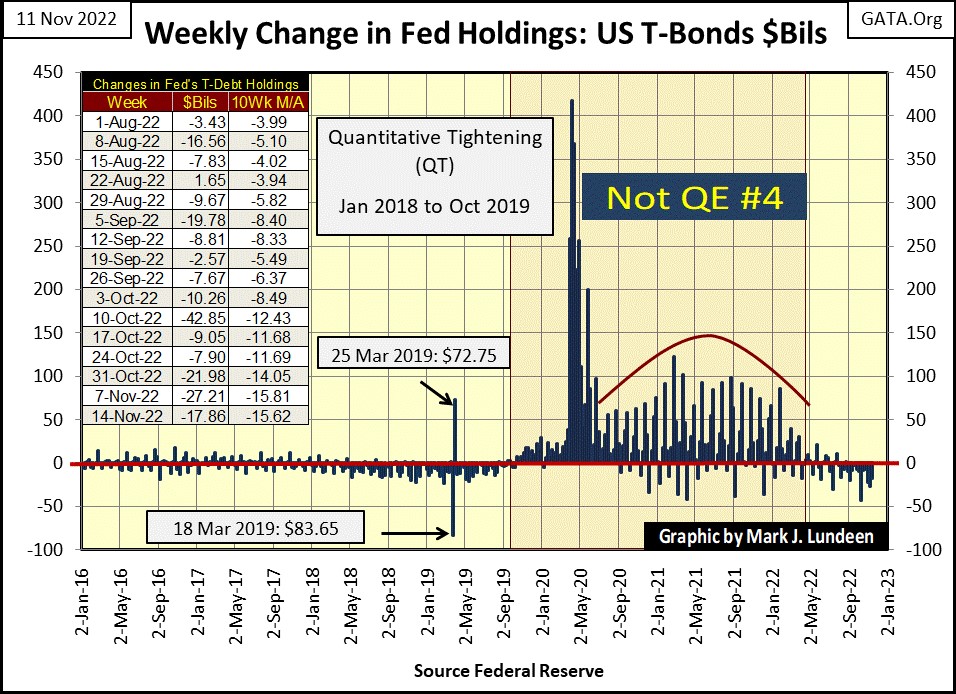
Why would that be? One reason is the surplus of extreme days in the market mentioned above. The second, and maybe bigger reason is the idiot savants at the FOMC are finally making good on their promised draining of “liquidity” from the financial system, as seen below.
This chart plots the weekly changes in the Federal Reserve’s balance sheet since 2016. Look at Fed Chairman Powell’s Not QE#4 – Wow! Now go back and look at Mr Bear’s Report Card for March 2020 above. This is how a central banker makes “monetary policy”; get out of my way Mr Bear or I’ll hurt you! But when all is said and done; it’s easier “injecting liquidity” into the financial system than draining “liquidity” from it.
The QT from January 2018 to October 2019 ended in turmoil as the overnight repo market saw rates shooting up, deep into double-digits in October 2019. Then in late February 2020, the March 2020 Flash Crash began, which was when Powell’s Not QE#4 really began “injecting” massive amounts of “liquidity” into the financial system.
Look at it! The post March 2020 to January 2022 bull market advance was fueled by this “Not QE#4.” Now the idiots are draining this “liquidity” from the financial system, as seen in the table in the chart. For the bulls, how can this be good? I’ve said it before, and now I’m saying it again; this is a dangerous market to risk your money in.
Let’s cover interest-rate derivatives in the OTC market. At the time of writing this article, the * NOTIONAL VALUE * of all interest-rates contracts is $475.27 trillion dollars, as per the Bank of International Settlement’s (BIS) Table D7. The United Nations reports global population in November 2022 is eight billion people. That makes it $59,408 of these derivatives for each human being currently living.
That’s a lot of money – or is it? That’s one of the problems with these OTC derivatives, it’s hard saying what they’re actually worth. But before covering that, let’s look at a brief history of these interest-rate derivative contracts.
I first heard of them in Barron’s 19 August 1985 issue, which headlined “The $150 Billion BABY.” In 1985, a $150 billion dollar market was a huge market.
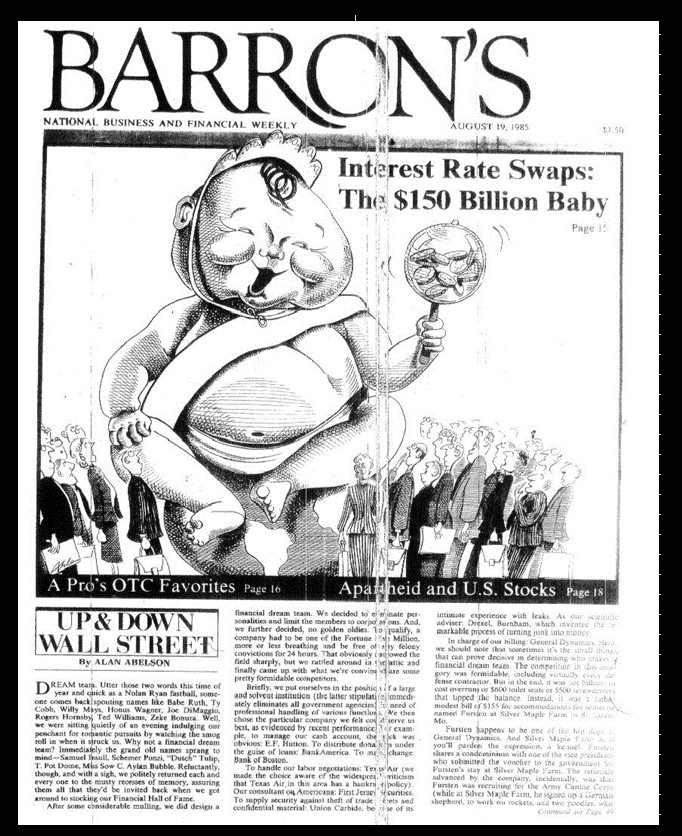
It’s been decades since I actually read this article, so my recollection of it is less than perfect. But I remember immediately after reading about them, they didn’t make much sense to me. As I recall, that pretty much sums up the opinion of the author of this article too. It was like; what the heck good are these things, and why is there a market for them at all?
Then in the early 1990s, there were stories about large corporations who had unexpected, and huge losses due to their exposure to “derivatives.” Proctor and Gamble was one. I don’t remember the name, but there was a German manufacturer that not only had a huge loss, but also went bankrupt because of their exposure to derivatives. Digging deeper, I learned derivatives were wonderful financial instruments for “managing risks”, if they didn’t first drive a company into bankruptcy.
In the mid-1990s, derivatives went mainstream. Watching CNBC twenty-seven years ago, one couldn’t watch for long without a “market expert” proclaiming these derivatives actually stabilized the financial markets by “distributing market risks to those best able to bear them.” I know there are really nice people in the world. But the idea that somewhere on Wall Street, there is a long line of these nice people, with very deep pockets, standing around volunteering to assume the market risks of others was a bit odd, but what did I know?
Then in the summer of 1999, in the twilight of the Clinton Mis-Administration, Congress had their proceedings live on television (CNBC) on the revoking of the Depression Era, Glass Steagall Banking Act. The lineup for testimony on the necessity of revoking the Glass Steagall act was impressive. Then Fed Chairman, Alan Greenspan testified it was unnecessary, as did Treasury Secretary, Robert Rubin.
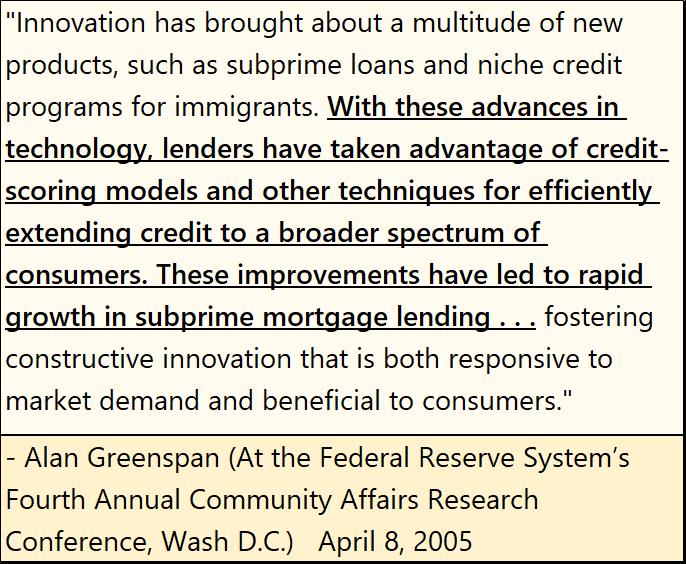
Before Congress, the CEOs of the big Wall Street banks all claimed the financial system of the United States had evolved far, and for the better from where it was during the Great Depression. That the Glass Steagall Banking Act maybe wasn’t bad, but defiantly wasn’t good as it inhibited “financial innovation.” In any case, it was totally unnecessary in an era where the banking system had access to derivatives, that “distributed market risks to those best able to bear them.” The Glass Steagall Act was a remnant from the Depression era 1930s, that inhibited this from happening, and so had no place in the 21st Century.
“Those best to bear market risk.” The financial media had been talking about those guys for years now. Now Wall Street executives were too, and under oath before Congress on live TV. But they never actually identified who these people were – strange.
Then with the sub-prime mortgage bull market (2002 to 2007) came a new term now heard in finance, that of “structured finance.” Structured finance was financial alchemy, and derivatives this new alchemy’s philosophers’ stone.
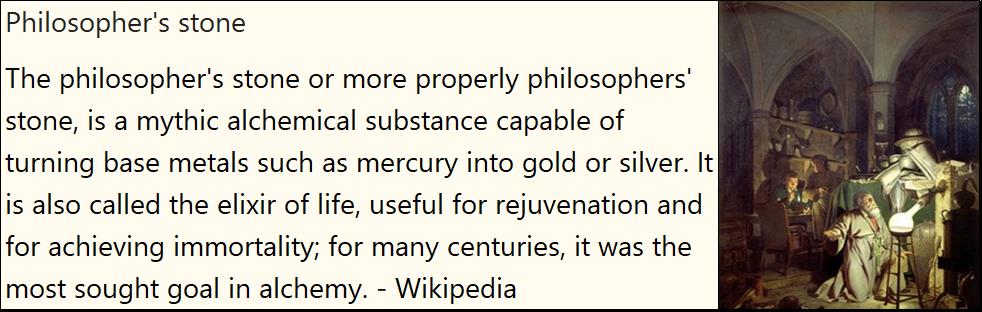
But instead of turning base metal into gold, innovations in derivatives used for structured finance was one better. They could change sub-prime mortgage toxic waste into riskless AAA rated debt, suitable for widows and orphans, and pension funds and reserves for insurance companies.
Yes sir, innovations such as bundling derivatives to financial garbage made many things possible. At least for a while, until early 2008.
When the bubble in the sub-prime mortgage market popped in 2008, we finally learned who it was that derivatives shifted market risks to; the imbeciles who unknowingly assumed the market risks of others. That’s right – the US taxpayers via the US Treasury.
To this day, I still feel like a dope for not seeing that one coming for all those decades. It’s like Mark Twain said way back in the 19th century, as true today as it was back then:
And no one has more money (control over Congress) than a financial system funded via the Federal Reserve. Or their minions, say like the global-warming cult in academia, or the pharmaceutical industry.
So, what are these things, these derivatives? In his book “F.I.A.S.C.O. Blood in the Water on Wall Street”, published in 1997, Frank Partnoy, a former derivatives salesman from Morgan Stanley, said all derivatives at their core are either futures contracts or options on futures contracts. So, let’s look at a futures contract for a CBOT corn contract consisting of 5,000 bushels of corn.
Corn is grown, and then sold by farmers. This corn is then purchased and processed by companies like General Mills, who then markets their corn products to the global market place.
The selling and buying of corn is done at the Chicago Board of Trade (CBOT), in standard contracts consisting of 5,000 bushels of corn, of specific moisture content and cleanliness. In other words, the CBOT is guaranteeing corn sold in Chicago isn’t at risk of getting moldy, and free of dirt from the farms it was grown. This standardizing of a 5,000-bushel corn contract makes each contract traded at the CBOT equivalent to every other contract traded.
Like the derivatives discussed above, these CBOT futures contracts of corn also distribute risk to those “best able to bear them”; the speculators who trade corn, but actually never grow or process corn. Unlike farmers or General Mills, speculators in corn futures usually lose money, which is why producers and processors of corn allow them trade corn in Chicago, as the speculators’ loss, is a loss not taken by the farmers or processors.
I began this above noting the interest-rate derivatives in the OTC market at the time of writing this article, had a * NOTIONAL VALUE * of $475.27 trillion, and then questioned if that was a lot of money? In the table below dealing with a futures corn contract, I’ll illustrate why these derivatives may be worth much less than, or possibility multiples of $475.27 trillion.
This contract is for the sale of 5,000 bushels of corn. This corn that may not even exist at the time of the contract’s creation, maybe in February for corn the farmer will have available sometime in September. By taking part in a corn contract, the farmer fixes his price for corn to be sold in September. In this example, the farmers, or speculators who sell corn are considered as the short side of this contract.
That’s good for the corn processor, who in February still has ample corn from last year’s harvest, but would like to fix the price of their corn required in September. In this example, corn processors, or speculators who buy corn are considered as the long side of this contract.
Let’s fix the price of corn, agreed upon by farmers and processors, at Line #1 (table below), when corn in the futures market was at $3.75. The notional value of this contract is $3.75 a bushel X 5,000 bushels of corn = $18,750 of notional value. But what does that mean? First of all, until September when actual money is exchanged for actual corn, it doesn’t mean $18,750 to the short or long side of the contract, whose financial position in this contract is at most but a fraction of its notional value.
Until the price of corn moves up or down from $3.75, this $18,750 in notional value means Zero dollars to each side of this contract.
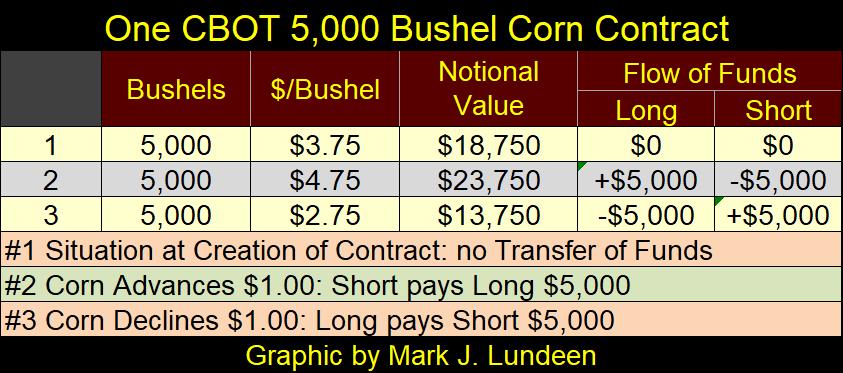
But look at what happens when the price of corn increases to $4.75 a bushel (line #2). The short must now pay the long $1.00 for each of the 5,000 bushels of corn in the contract, a net transfer of $5,000 from the short to the long side of the contract. A decline of $1.00 in a bushel of corn, from $3.75 to $2.75 (line #3) results in a transfer of funds of $5,000 from the long to the short side of this contract.
There are only two ways to make this contract of corn with a notional value of $18,750, an actual $18,750 reality. One would be where the price of corn collapses down to $0.00 a bushel, where the long would have to pay the short $18,750. The other would be where the price of corn soars up to $7.50 a bushel, where the short would have to pay the long $18,750. But should the price of corn go even higher, the losses to the short are potentially unlimited. That is an important point to keep in mind.
The point to understand here is, depending on the price trends in the corn market, money flows from one side of the contract to the other. But what if there was a market where one side knew that over the long term, the price trend in a market was going to be one way, and one way only. The opportunities for profit would be enormous; welcome to the interest-rate derivatives OTC market.
I have to make a disclosure at this point of my narrative on derivatives; in no way should my readers consider me an expert on this topic. I am not! The potential for error in my commentary is there, and if made, I want to apologize for any factual errors of alleged criminal activities to the powers that be on Wall Street ahead of time.
But admitting my ignorance on the topic of interest-rate derivatives, is not the same as admitting I’m stupid, because there is something really wrong with these derivatives, that the financial media has willingly ignored for a very long time.
Take for example a CBOT corn contract, a topic I’m not an expert on either. But I can understand how the short and long sides to these contracts can see profits and losses as the price of corn changes. That is something that to my knowledge has never been explained to the public in the media about interest-rate derivatives.
To wit; farmers benefit when corn prices rise, corn processors benefit when corn prices decline. So, I understand why farmers want to hedge their risks for lower corn prices, and corn processors want to hedge their risks for higher corn prices.
However, to my understanding of the debt markets, holders of debt benefit when yields go down, as the price of debt then rises. So, debt owners; pension funds and insurance companies want to hedge their risks from rising bond yields, because the price of debt then goes down. But, and this is where these interest-rate contracts differ from contracts in corn, exactly who benefits (sees profits) from rising bond yields, and declining bond valuation, and want’s to hedge their risks of lower bond yields?
No one I can think of, and it’s a huge point. In my ignorance of the inner-workings of the debt market, it appears to me that rising interest rates and bond yields are truly “the ill-wind that blows no good”, for everybody in the debt markets.
I can understand why pension funds and insurance companies would want to hedge their risks of rising rates and yields. But exactly who is it in need of hedging their risks for lower rates and yields, financial entities that would naturally desire to take the other side of an interest-rate derivative contract?
They may be there, but I can’t think of anyone. Especially so in a market where the BIS reports have a notional value of $475.27 trillion dollars. That is an immense market hedging the risk of (of all things) lower yields and higher bond prices. So exactly who is taking the short side of this $475.27 trillion notional dollar market? I believe the big banks prominent in the derivatives market are.
And that is a huge problem for them, as with rates and yields now rising, money is no longer flowing towards Wall Street from their counterparties, but is now flowing from Wall Street to their counterparties. And in a market with a notional valuation of $475.27 trillion, the potential for a catastrophic disaster in global finance should bond yields continue rising is very real.
Below is a chart for Barron’s Best & Intermediate Grade Bond Yields going back to 1979. From the early 1980s, to January of this year, the trend for corporate bond yields was down. Yes, there were yield spikes on the way down to its January 2022 bottom. But “monetary policy” executed by the FOMC always got this juggernaut of declining yields back on track – downward.
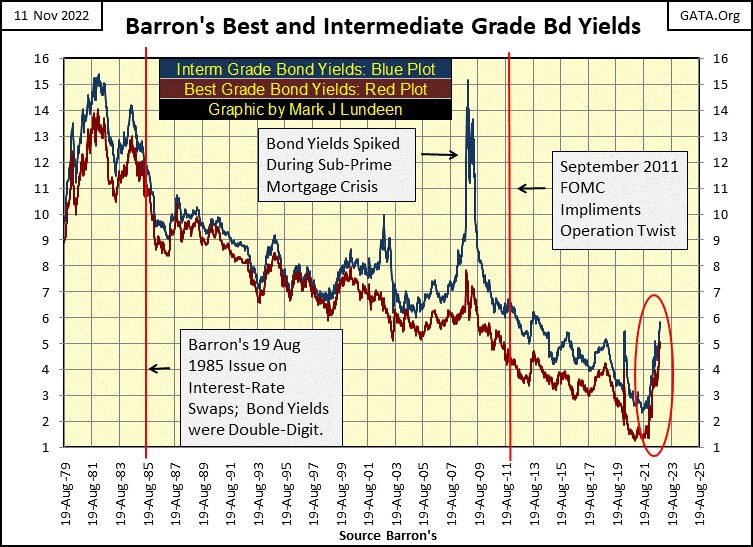
However, since January of this year, corporate bond yields have gone only one way; the wrong way – up, and that is costing someone a lot of money! I’m sure there are plenty of fiduciaries of other peoples’ money really happy they’ve hedged their risks of rising bond yields with derivatives sold to them by Wall Street.
But I’m sure their counter-parties to the $475.27 trillion dollars of notional value of these contracts, whoever they are, aren’t happy. Their losses so far in 2022 must be massive. I’m surprised to have seen the massive increase in bond yields above (Red Circle), without seeing some news of massive counterparty distress somewhere in the derivatives market.
Given sufficient time, the continuing increases in bond yields will do exactly that. And the financial media will ignore this story until it can no longer not report on it, exactly as they did with the sub-prime mortgage crisis.
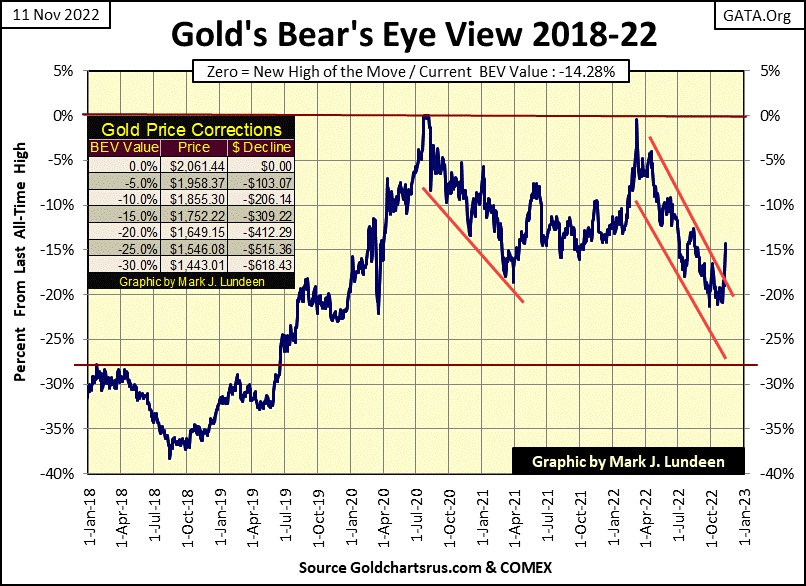
Let’s look at gold’s BEV chart. Gold made a big break out this week, going from below its BEV -20% line to above its BEV -15% line. I’ve been commentating on the markets long enough to know, I’m not going to make any rash prediction of the price of gold, say like a new all-time high by the end of the year. But if one was to happen, such an advance would maybe start out as we see below.
This article is getting longer than I like, so I’m going to close it with my comments on the step sum tables below. For gold, it saw only eleven daily advances in the past twenty-five trading days. Yet since October 10th, gold has advanced 6.25%. It’s like James Dines used to say; it’s a game fish that swims upstream!
I also like seeing gold’s daily volatility’s 200D M/A move off of that 0.73%, and close the week at 0.76%.
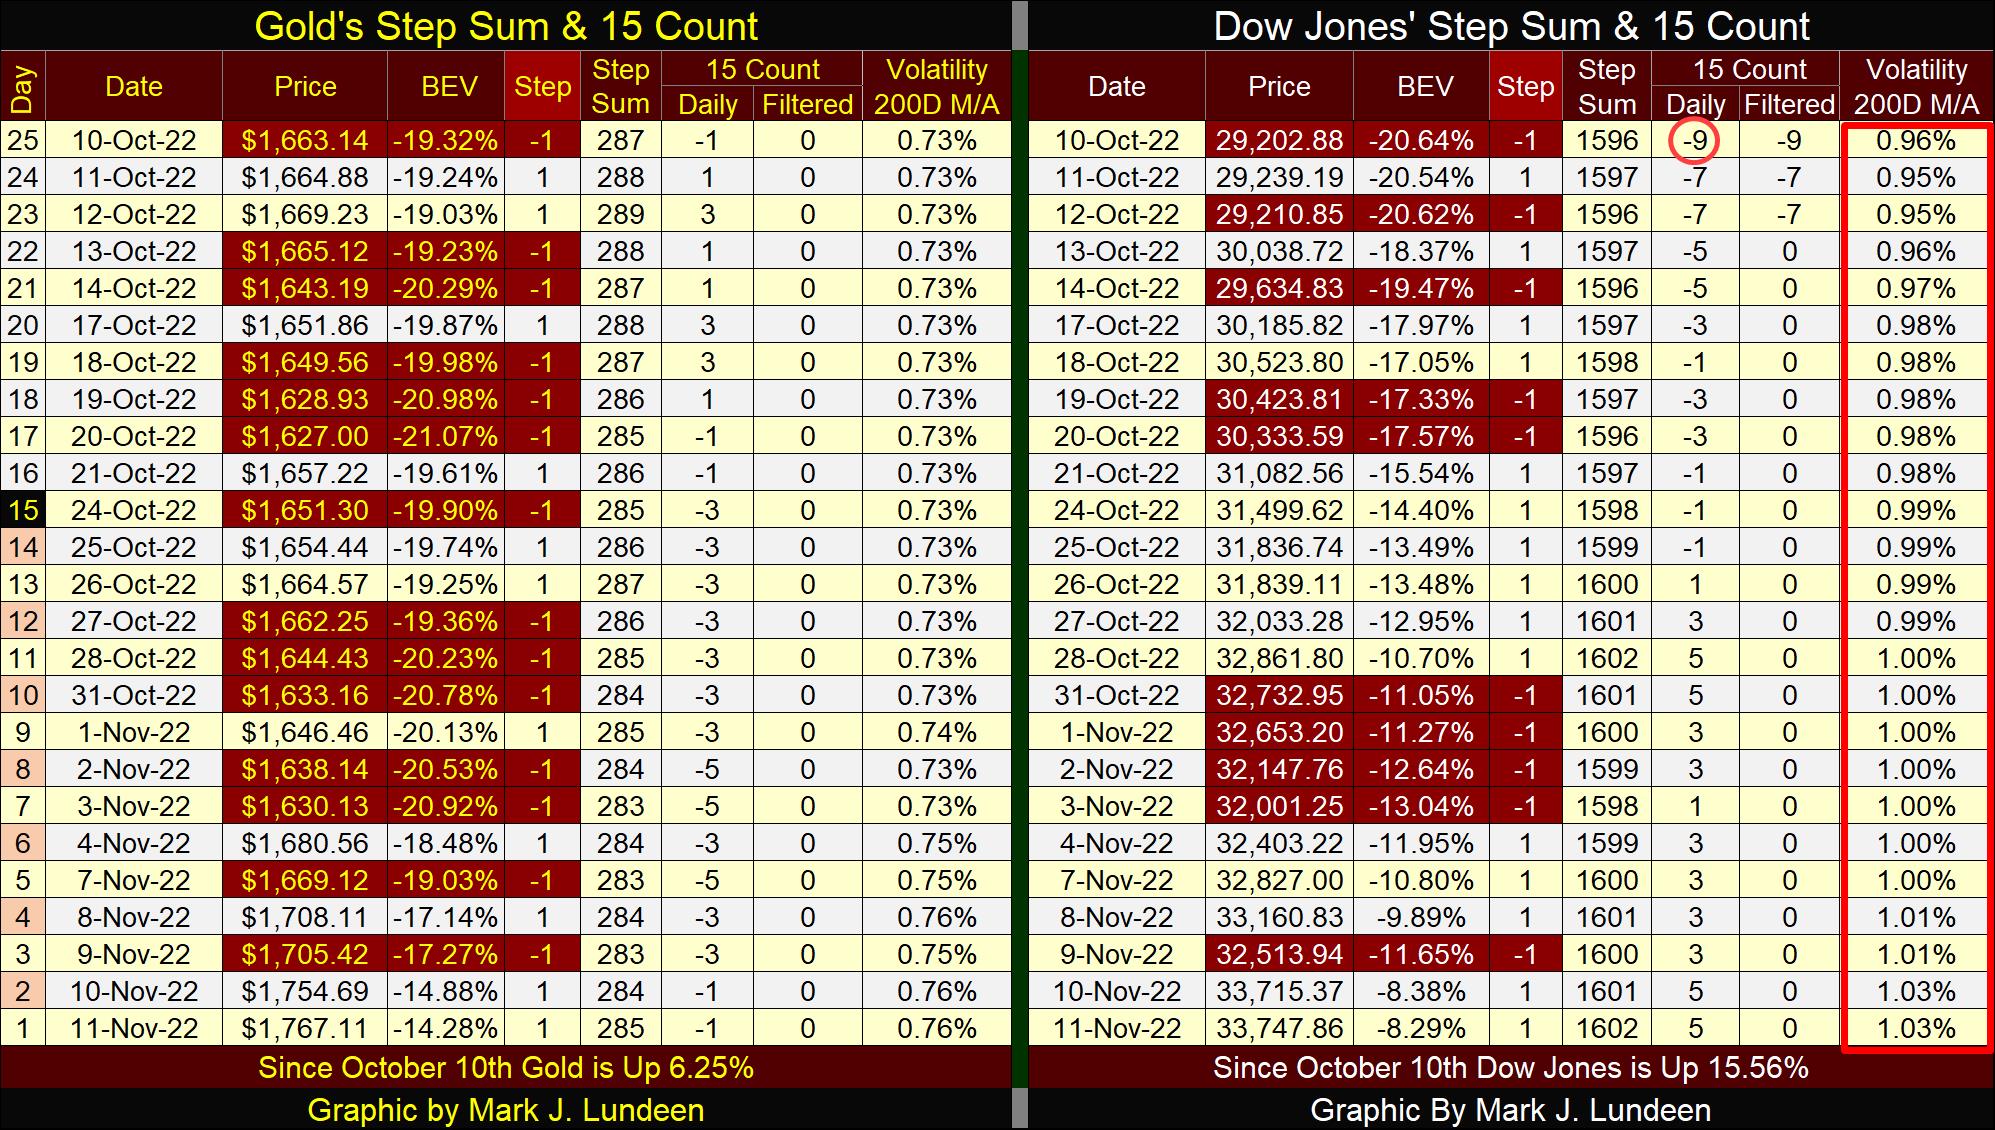
The Dow Jones also looks good over on its side of the table. With the Dow Jones itself and its step sum advancing nicely, the bear box in its step sum chart (not shown) days are numbered. Then maybe not if its daily volatility’s 200D M/A continues to rise. Closing the week with a 1.03%, strongly suggests the market has a fever. That’s never been good for the bulls before. I doubt it will be this time either.
Mark J. Lundeen
********


