All Is Quiet On The Western Front – For Now


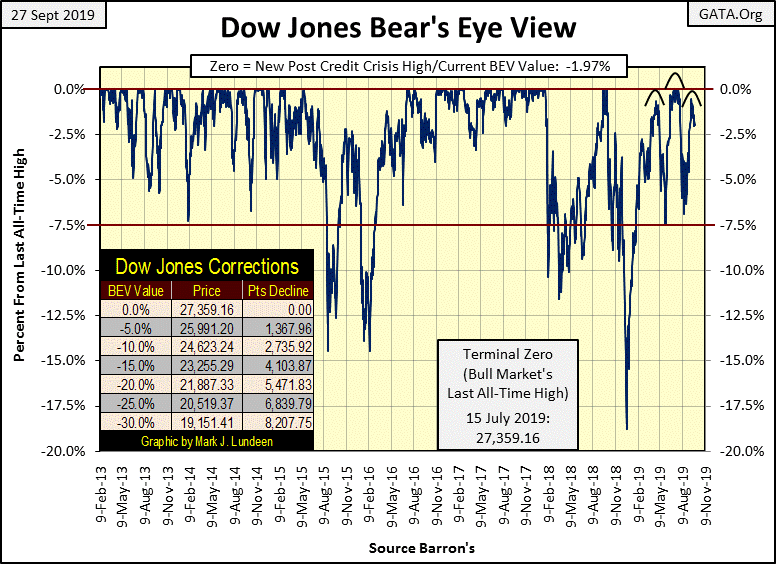
Not much has changed with the Dow Jones or the broad stock market since the close of last week. Here’s the Dow Jones’ BEV chart below. I could have used last week’s chart.
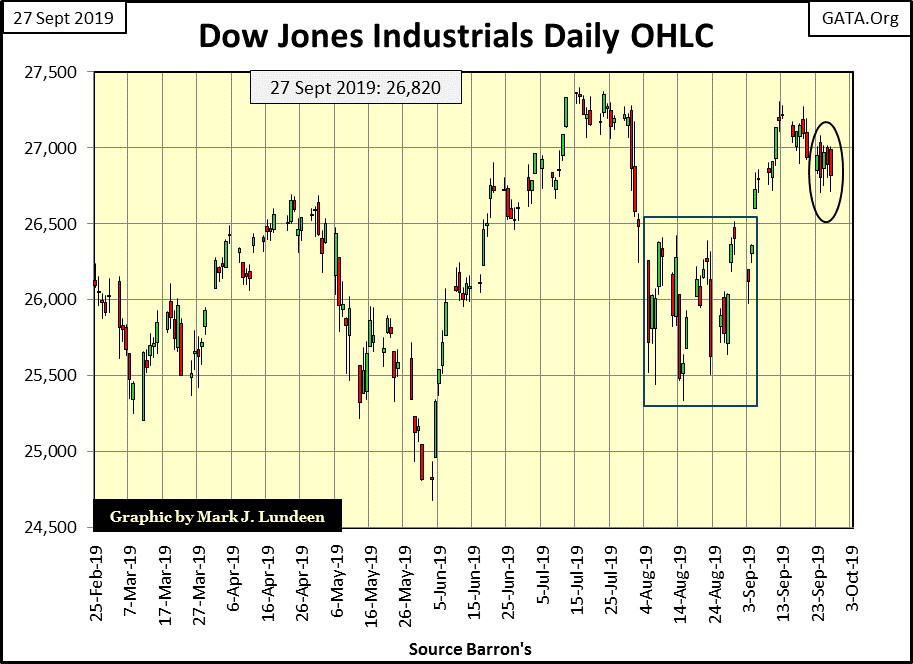
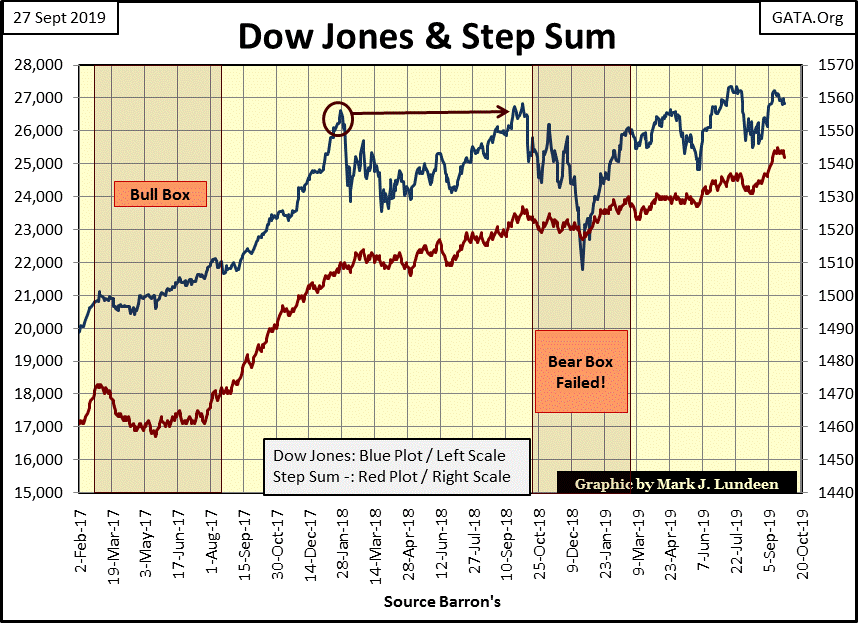
Next is the Dow Jones in daily bars with this week’s trading circled. Not much happening there, not when only 376 points separated the week’s high from its low, and Friday closed 32 points below the Dow Jones Monday’s opening.
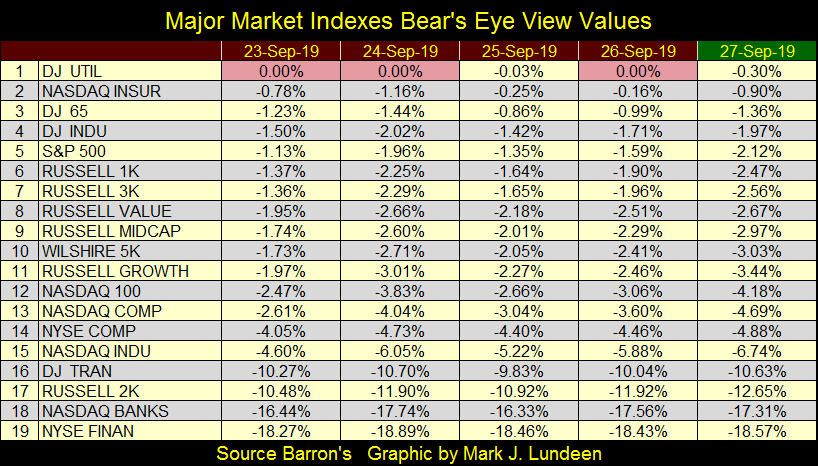
With the exception of the Dow Jones Utility Average, which saw three new all-time highs this week, the other indexes I follow provided no more in the way of excitement than did the Dow Jones. On Monday there were ten indexes within 2% of making a new BEV Zero below (#2-11); on Friday there were only four and none of them able to make market history during the week.
As noted in past articles; this is a market where these major indexes find making new all-time highs almost impossible, even as they are so close in doing so. There seems to be something wrong here, and it may be with the banking system’s overnight borrowing system called the repo market.
The repo market; an interbank market where dealers lend government securities overnight to the banking system has had some problems lately. I’m not familiar with this market, but Paul Ebeling is and he sent me the following on the banking system’s repo market.
Here are additional stories on the current problems in the repo market. Hit your refresh button to update the list.
https://duckduckgo.com/?q=repo+market&atb=v82-1&iar=news&ia=news
Paul is an interesting guy. Years ago he was a sergeant in the US Marine Corps; now he’s the head of a significant financial and publishing empire. I’m an old Navy Chief myself, and with my in and out of service dealings with Marines, I’ve always been impressed by them.
When the USS Midway was being decommissioned at NAS North Island I met an older couple at a coffee shop in Coronado, CA. I liked them and offered them a personal tour of the Midway one Saturday afternoon. They then asked me if I’d like to spend a weekend with them at their Redondo Beach home. What, an offer to get away from the Navy for a few days? Okay! He was a Marine corporal who somehow started the largest trucking company in Los Angeles, or so he said. After seeing their home I didn’t doubt it.
There’s something attractive about former Marines, or any service member from the stand point of an employer. For one, they’ve been through a boot camp. That’s no small thing; to have proven one can deal with adversity in unfamiliar circumstances. Also for any service member with a good conduct medal, an employer knows they have someone in front of them that knows how to come to work on time and can get along with others.
The Dow Jones’ 200 count ended the week at a 10, or ten days of extreme volatility within a running 200 day sample. In the past month all the extreme days from 07 Nov to 07 Dec 2018 have expired, as seen in the table below.
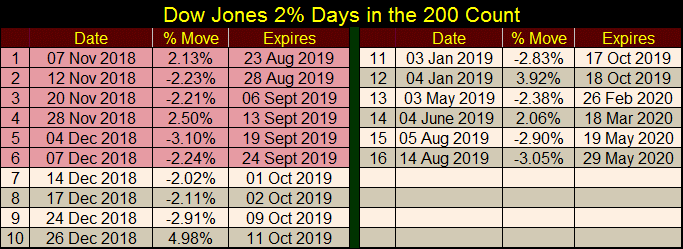
Next is the Dow Jones with its 200 count. Beginning last October with the Dow Jones breaking into record territory, the Dow Jones began seeing a series of 2% days, signaling the beginning of an 18% correction that bottomed in late December. The last of that series of 2% days happened on 04 January 2019 (see table above), and all of these, now stale days of extreme volatility will expire from the count on October 18, a few weeks from now, leaving the count at four.
All and all this is a positive development in the stock market, seeing so many stale 2% expire from the Dow Jones 200 count, with the most recent of these extreme market events dated about six weeks ago.
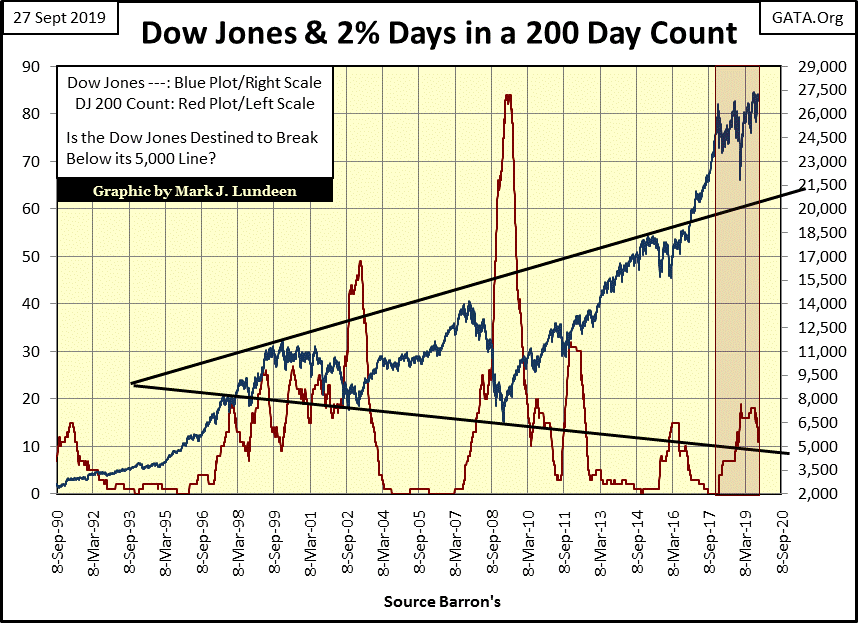
So what does this say about the stock market? As I see it; if the market bulls are having difficulties taking their favorite market indexes to new all-time highs, they can’t blame their failure on the bears. The bears have been off the playing field for quite a while now.
What’s the bulls’ problem? The stock market has been advancing since March 2009, and a ten year market advance is a very abnormal situation, a situation I believe has been crafted by the “policy makers.”
If the “policy makers” current problem in the inter-bank repo market continues, and progressively gets worse, we may not first hear about it from the MSM’s financial news outlets until they can’t hide the problem anymore. I’d keep my eyes on the Dow Jones, with a focus on whether it once again sees extreme market volatility: greater than (+/-) 2% daily moves from a previous day’s close.
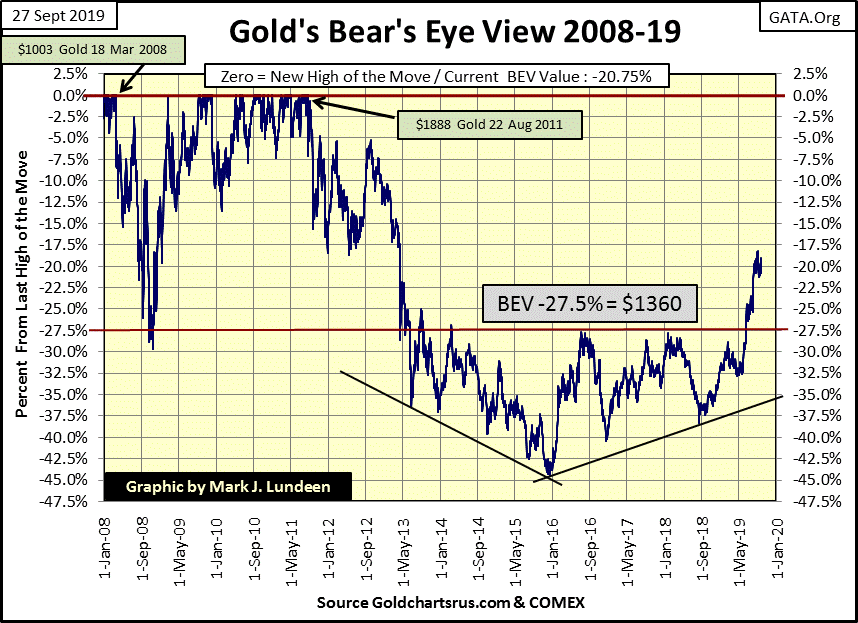
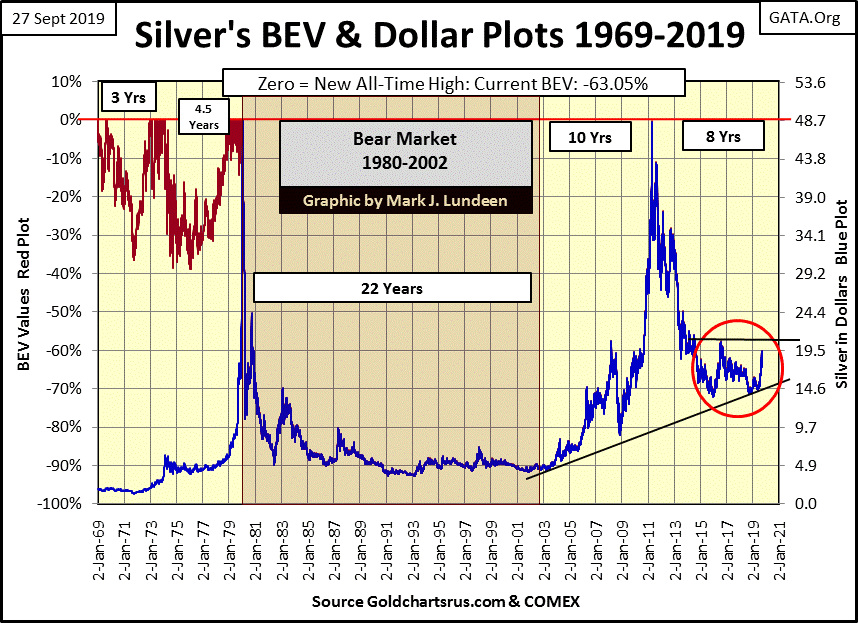
Moving on to gold’s BEV chart, as with the Dow Jones BEV chart, I could have once again used gold’s chart from last week. Gold this week was under pressure. But as seen below, gold continues having success in defending its gains from last summer. As long as its BEV -27.5% line remains a respectful distance from its daily closing price, I remain content.
But how long could gold remain trading around its BEV -20% line? It could be sometime. I’m thinking until the stock market once again enters a period of deflation in its valuation, we’re not going to see much excitement in the old monetary metals. In current market conditions, as long as that BEV -27.5% line ($1360) remains a floor to the price of gold, the gold market remains bullish.
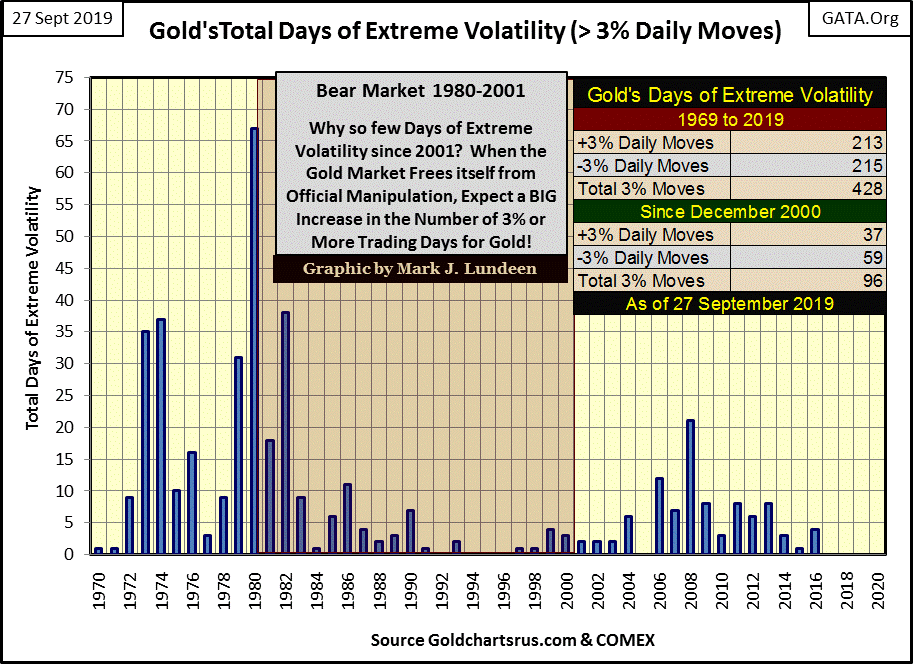
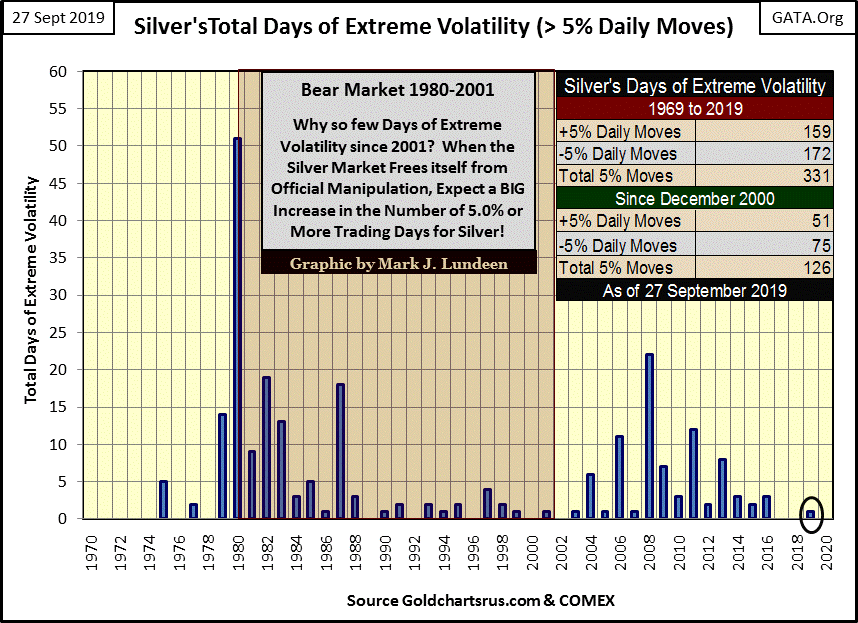
And for the past three years, since October 4th of 2016, the gold market hasn’t seen a day of extreme volatility – which for gold is a 3% day. That doesn’t happen often. The last time there was a three year gap between gold’s 3% days was from 1994 to 1996, during which gold was a spectacularly boring market.
That was during the 1990s’ NASDAQ High-Tech bull market, so I’m not surprised the gold market twenty-five years ago was so boring. But since gold’s bottom seen in December 2015 (chart above), gold has been advancing in what I believe will prove to be the very early stages of a major-market advance. That gold hasn’t seen a 3% day for three years now suggests how little interest it has with investors. Yet very quietly, gold has stilled advanced these past four years.
All this could change quickly should the stock and bond markets begin shedding market valuation. This would create market volatility in the Dow Jones as the stock market begins to deflate, with volatility increasing in the gold and silver markets as their valuations begin to inflate.
One stand out fact the chart below makes clear, is how little volatility gold has had since it began its current bull market in 2001, when compared to the volatility gold saw in its 1970s gold bull market.
GATA’s Bill Murphy and Chris Powel have for decades documented Wall Street’s big banks manipulation of the gold and silver markets. In reward for their excellent market research GATA, and anyone who has taken the time to follow their work, have been classified as “conspiracy theorists.” This is the MSM’s method of quarantining the general population from those who would tell them the truth.
Be-that-as-it-may-be, here’s a November 2018 CNBC article on JP Morgan manipulating the gold and silver markets.
And another article from September 13th of this year on JP Morgan’s manipulation of the gold and silver markets.
https://www.cnbc.com/2019/09/13/jp-morgan-puts-traders-on-leave-amid-criminal-investigation.html
And is not just JP Morgan, all the big banks are doing it.
Usually an investigation into market manipulation ends with the SEC or CFTC fining the bank for the offence, with the bank promising never to do it again, but this time it’s different.
The Trump administration has its Department of Justice (DOJ) investigating JP Morgan. Unlike a regulatory agency such as the SEC, the DOJ doesn’t fine trespassers of law; instead it takes them to criminal court for criminal prosecution. That the DOJ is processing this investigation as a RICO offence (link below) is a declaration it believes JP Morgan’s precious metals desk has been operating as a criminal enterprise, and they are seeking not just the traders of gold and silver, but looking up their chain of command as far as they can for criminal activity.
Let’s study market volatility in the gold and silver markets in more detail with the chart below plotting daily volatility’s 200 day moving average for the metals.
After a ten year declining trend (since 2009), volatility for gold (Red Plot below) and silver (Blue Plot) may have turned a corner. If so, that would be a very positive development in the precious metals markets.
Keep in mind volatility for the old monetary metals doesn’t operate as it does for the stock market; where rising daily volatility for the Dow Jones is ALWAYS BAD, and has been since the 1890s. Rising volatility for gold and silver only means the metals are in play, which would mean their prices are in a bullish or bearish phase.
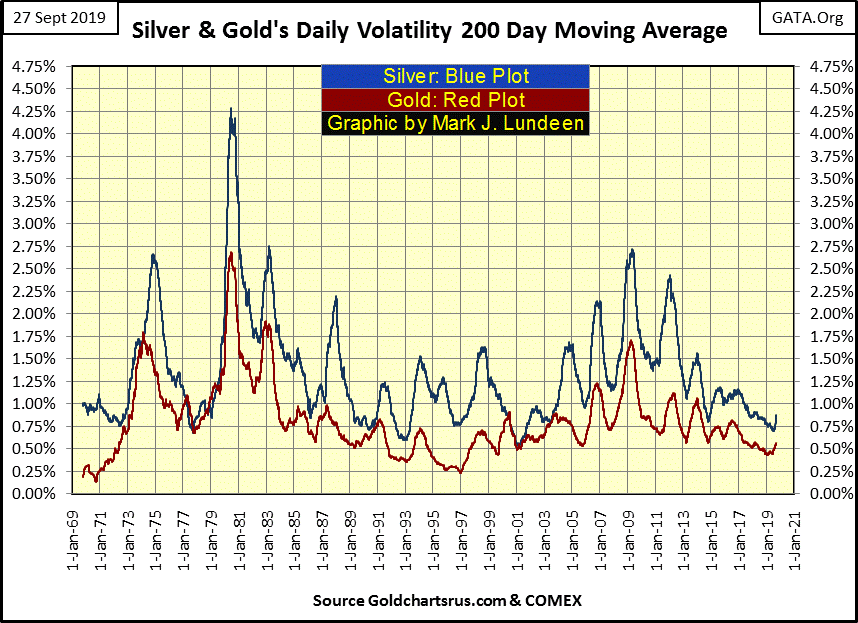
The volatility spike of 1980 seen above is the perfect example of what I’m talking about. Daily volatility had been increasing since September 1977 as gold increased from $146.20 to $825.50 in early January 1980 (silver $4.46 to $48.70). However, as the metals peaked in January 1980, volatility for gold had increased to only 1.47%, while silver saw only 2.02%. So the bulk of the 1980 volatility spike occurred as the price of gold and silver crashed as the year progressed.
It’s not hard understanding why silver’s 200 day volatility spiked to a massive 4.25%; there were days in January where the COMEX exchange actually forbade investors from going long in the silver market, allowing the longs to only sell silver contracts in a market whose valuations were being intentionally liquidated by exchange insiders.
Silver (chart below) peaked on January 17th at $48.70. Two months later silver was trading at $10.88, a 77.9% decline in valuation in only 50 COMEX trading sessions. I can’t think of another major market that has seen a similar catastrophic decline in such an abbreviated time span as silver saw in the chart below during January – March 1980.
One must understand this period to place the 1970s’ gold and silver bull market and 1980s crash into their proper perspectives. Gold was demonetized in August 1971 by a Presidential Executive Order “temporarily suspending” the dollar’s $35 gold peg. This was a highly dubious order given gold was monetized at $35 an ounce by the Bretton Woods Monetary Act, an international monetary treaty, verified by the US Senate, and so set in the US law code as well by the US Constitution itself.
Five decades ago there were many who didn’t approve of President Nixon’s demonetization of gold in August 1971, and so they began investing in gold and silver as CPI inflation began increasing, as they knew it would.
But the “policy makers” were having none of it; they kicked silver out of US coinage in 1965, and gold from the international monetary order in 1971. Their brutal termination of the 1970s’ bull market in gold and silver was to demonstrate to everyone that there was no going back to a monetary system whose currency and credit creation was limited by a metallic standard. Rather, the “policy makers” wanted – and got – a global monetary system dominated by debt created by a predatory-banking system they controlled. But in 2019 their system is once again showing cracks at its seams, in the repo market; which by the way was also an early warning sign for the sub-prime mortgage debacle of 2007-09.
Back to gold and silver volatility. Silver on September 3rd saw a 5% day, where it advanced 5.96% from its previous day’s closing price. This is something not seen since 11 November 2016 when silver declined 6.66% from its previous day’s close.
The chart below tells the tale that a gap of almost three years separated these days of extreme volatility in the silver market. This gap is unique, an event a quick study of the chart below will show hasn’t happened since 1975. I don’t believe we’ll have to wait another three years for silver’s next 5% day.
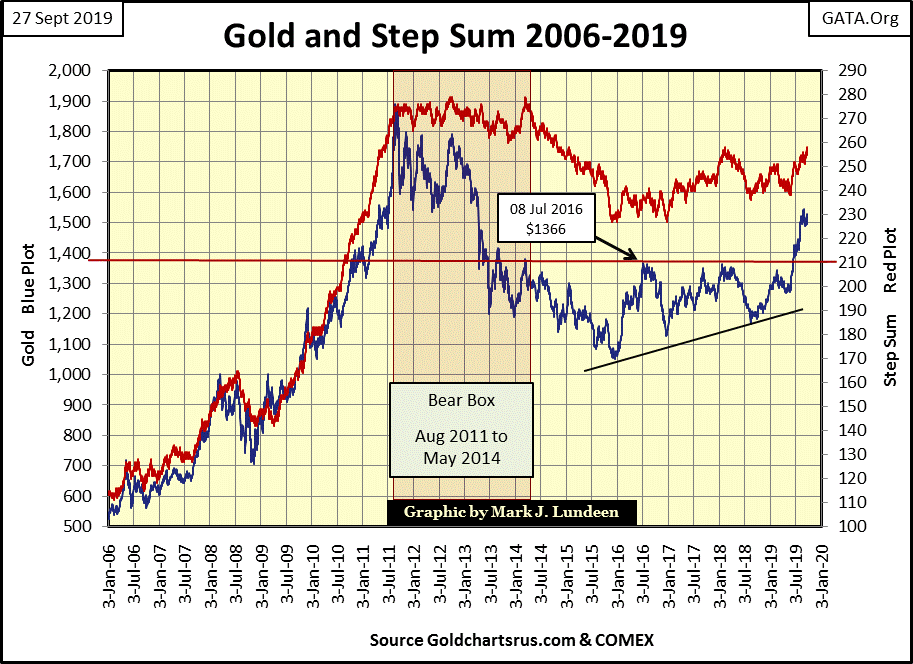
Gold in its step sum chart below remains very positive. Seeing gold break above $1600 by the end of October is very possible if gold’s step sum continues rising, taking the price of gold up with it.
The Dow Jones and its step sum have something to prove to me before I say anything good or bad about them. Since January 2018 the Dow Jones and its step sum have been taking a bit of a rest, though for both their trends have had an upward bias.
However one thought continues to run around in my mind when I think of the Dow Jones and the stock market in general – it’s been advancing since March 2009; so maybe being bullish on the stock market has become a bad habit one would do good breaking.
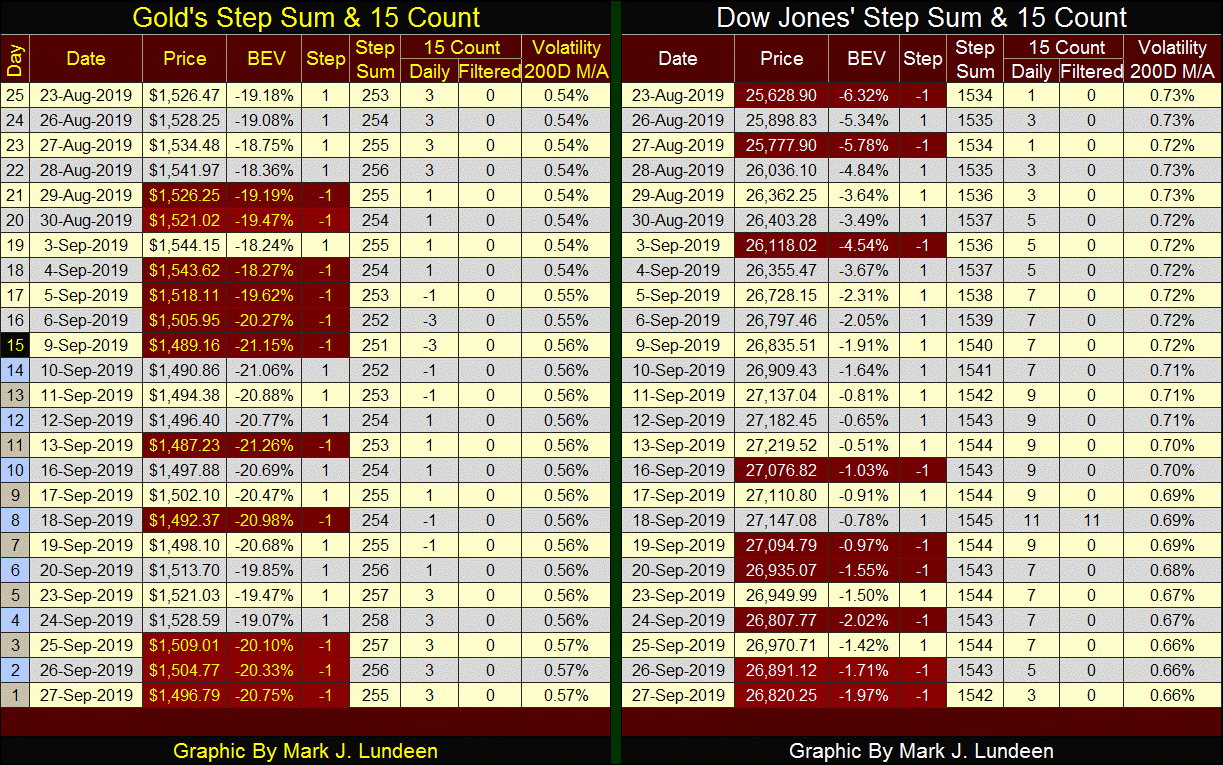
Without comment here are gold and the Dow Jones’ step sum tables. Why no comment? Since late August neither have done much to comment about. Give them some time. Before 2019 concludes maybe we’ll see more excitement than we care to in these tables.
Mark J. Lundeen
********


