Analysts Totally Wrong About Gold Price: Top Gold Miners Production Cost Still Provides Floor In The Market Price


While the debate on the dynamics of the gold market continues, at least the top gold miners production cost provides us with a floor price. Or rather, a basic minimum price level. I get a good laugh when I read analysts suggesting that the gold price will fall back to $450-$700. For the gold price to fall back to $450, then we would need to lose 95+% of global gold mine supply.
Due to two factors of rising energy prices and falling ore grades in the gold mining industry, COSTS WILL NEVER go back to where they were a decade ago. Again, the only way for that to happen is if a large percentage of gold mine production was shut down.
Furthermore, analysts continue to wrongly forecast the gold price based mainly on gold supply and demand forces. This is a NO-NO. The overriding factor that has determined the gold market price has been the gold mining industry cost of production. I proved this point by showing the increase in the gold production cost at Homestake Mining (the United States largest gold mine 1970’s) from 1971-1979:
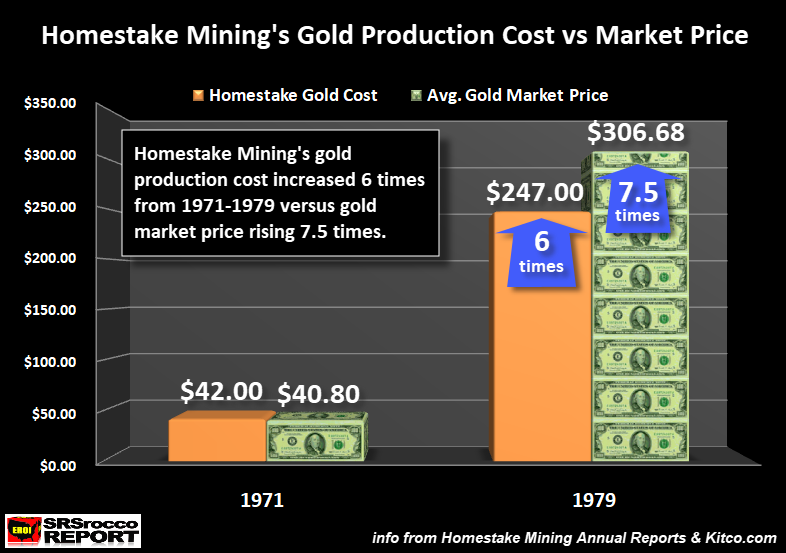
Homestake Mining was producing gold at the cost of $42 an ounce in 1971 when the average price was $40.80. Thus, Homestake Mining lost money producing gold in 1971. However, as energy-driven inflation ravaged throughout the economy as the price of a barrel of oil increased from $2.24 in 1971 to $31 in 1979, this impacted the cost to produce gold significantly. By 1979, Homestake Mining’s gold production cost jumped to $247 an ounce.
While it is true that the tremendous demand for gold by investors also drove the gold price to new highs in the 1970s, we can see that at least 80+% of the increase in the gold price from 1971-1979, in the case of Homestake Mining, was due to higher production costs.
So, what is taking place currently in the top gold mining industry as it pertains to production costs?
The Top 5 Gold Miners Total Production Cost Remains Above $1,200 An Ounce
According to my analysis of the estimated adjusted income breakeven of the top five gold miners, the average weighted cost was $1,204 an ounce for the first nine-months of 2018:
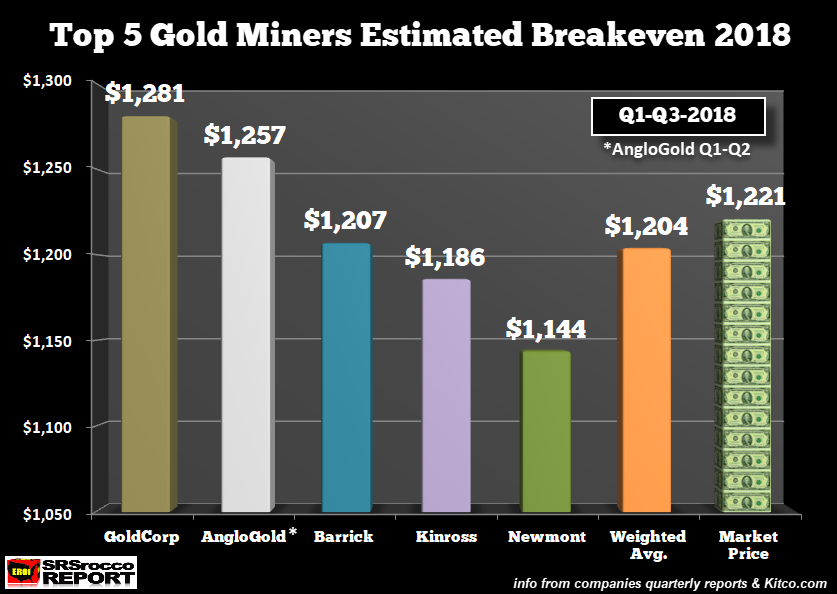
As we can see, Goldcorp has had a horrible year as their adjusted breakeven gold production cost was the highest in the group at $1,281. AngloGold had the second highest cost at $1,257, followed by Barrick ($1,207), Kinross ($1,186) and Newmont ($1,144). Now, the weighted average breakeven price of $1,204 was based on an average gold price of $1,282 for Q1-Q3. So, the top five gold miners average profit for the group was about $78 an ounce during the first nine months of 2018.
However, gold production costs increased by Q3 2018 as the oil price jumped to $70 a barrel during the quarter while the gold price fell. So, profits declined in the third quarter. Regardless, we can see that the total production cost of the top gold miners at $1,204 provides a base for the current market price of $1,221.
Now, some analysts, investors, and readers may disagree with my “estimated break-even gold price,” but if we use another metric, we see similar results. Because the gold mining industry is extremely capital intensive, it takes a massive amount of capital funds to sustain production; we can look at the Free Cash Flow as a guide.
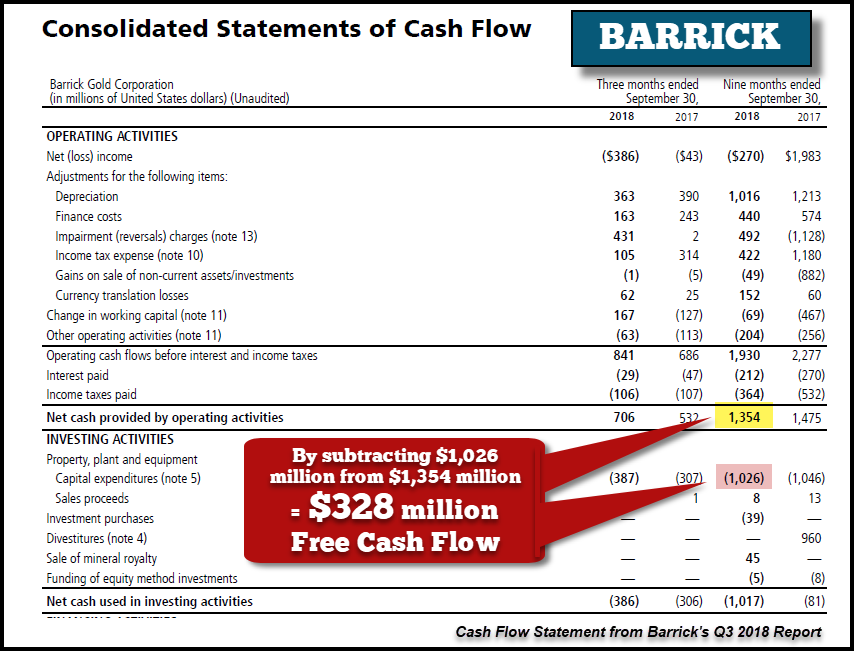
To arrive at Free Cash Flow, we subtract the gold mining company’s CAPITAL EXPENDITURES (CAPEX) from their CASH FROM OPERATIONS. Here is an example of Barrick’s Free Cash Flow by looking at the Cash Flow Statement in their Q3 2018 Report. Barrick reported cash from operations of $1,354 million while spending $1,026 million on CAPEX during Q1-Q3 2018, netting $328 million in positive free cash flow:
In the first nine months of 2018, the top five gold miners combined net Free Cash Flow was $542 million. While that is a nice chunk of change, the five gold mining companies produced 13.2 million oz of gold. By dividing the $542 million in free cash flow by the 13.2 million oz of gold production, the group made a net $41 of free cash flow per ounce:
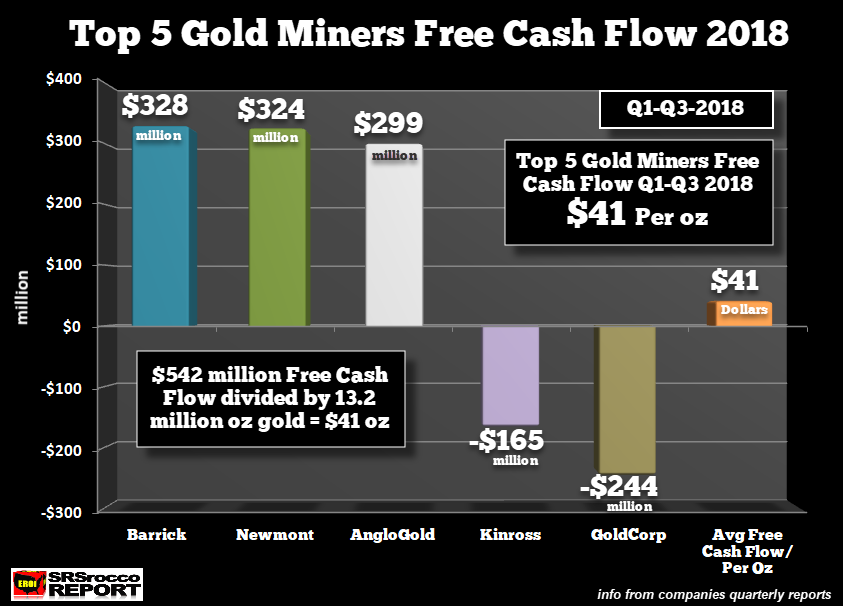
So, my estimated profit for the group Q1-Q3 2018 was $78 per ounce while their Free Cash Flow per ounce was $41. While it’s not an exact science, we can see that the gold miners aren’t making money HAND-OVER-FIST producing the best quality store of value and money on the planet.
Of course, some analysts would suggest that some of the CAPEX the gold miners are spending are for replacing reserves and adding new projects-mines. Maybe this is true, but if so… SOMEONE NEEDS TO TELL THE GOLD MINING INDUSTRY. Why? Well, if we look at the next two charts, the CAPEX the gold miners are spending most certainly isn’t replacing or growing production.
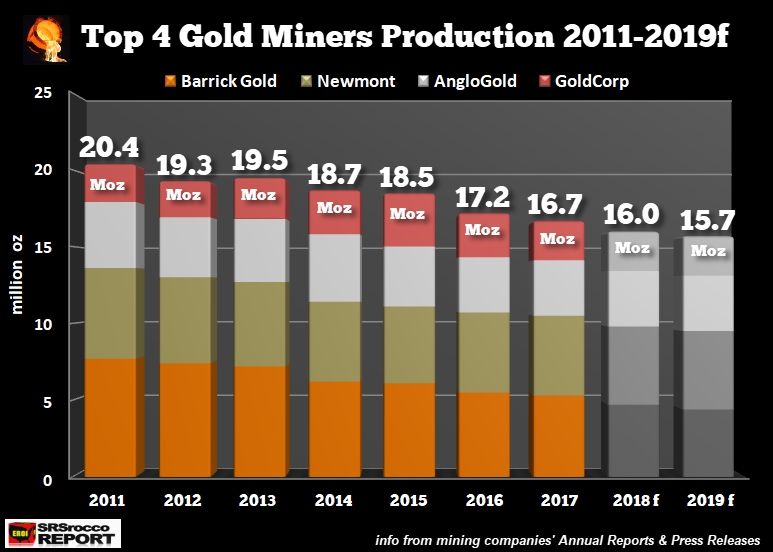
As we can see, production from the top four gold miners has continued to decline even though they are supposedly spending money to replace and grow production. The gold mining industry separates CAPEX spending into two categories:
- Sustaining CAPEX
- Expansionary CAPEX
Well, we can clearly see that the “Expansionary CAPEX” that these gold miners publish in their financial reports doesn’t seem to be expanding production. Now, if we look at what is taking place in the Top five gold miners over the past three-quarters, the trend continues:
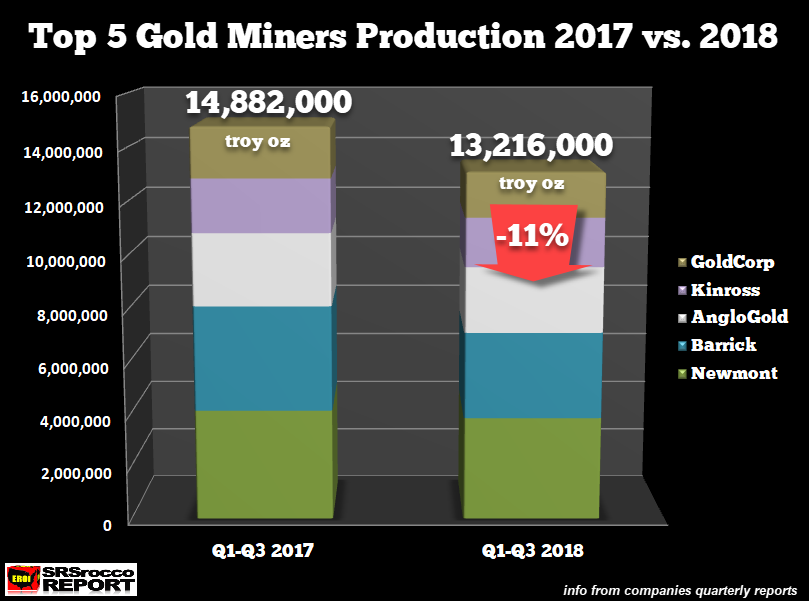
Total gold production from Barrick, Newmont, AngloGold, Kinross, and Goldcorp fell from 14.9 million oz Q1-Q3 2017 to 13.2 million oz during the same period this year. That is an 11% decline in production in just one year. So, what’s going on with all the expansionary CAPEX spending? Ah??
Now that we have an idea of what it costs to produce gold from the top gold miners, why are the forecasts of $450-$700 incorrect?
Harry Dent’s $450 Gold Price Neglects The Number One Factor Of Price
Harry Dent became famous due to a few forecasts that he got right out of 1oo. However, his ongoing predictions for $450-$700 will never come true because Harry neglects to incorporate one of the most important factors in determining the gold price… COST OF PRODUCTION.
While Harry continues to write about the coming deflation and why the gold price would not do well during this period, Charles Nenner has stated that the gold price actually does well during deflationary periods. So, which is it? Well, in the future, past analysis won’t matter as much due to the collapse of global oil production and its impact on the value of most assets.
But, if we look at Harry Dent’s chart on the future gold price, we can see that something has gone horribly wrong with his forecast:

Harry Dent’s forecast of the gold price was made back in April 2017 is shown in the small white graph at the upper left corner of the chart. According to Harry, the gold price should have dropped to $700 by the middle of 2018, corrected higher and then was projected to continue falling to $450 by 2020. So far, the gold price has remained above $1,200 an ounce, even reaching $1,350 at the beginning of 2018.
Dent used technical analysis and the popping of a TYPICAL BUBBLE to arrive at his gold price targets of $700 and $450. Unfortunately, basing one’s forecasts on technical analysis only is a huge mistake because you have left out the most important ingredient… ENERGY.
My chart shows that the gold price has increased since the low at the beginning of 2016, due to HIGHER ENERGY PRICES:
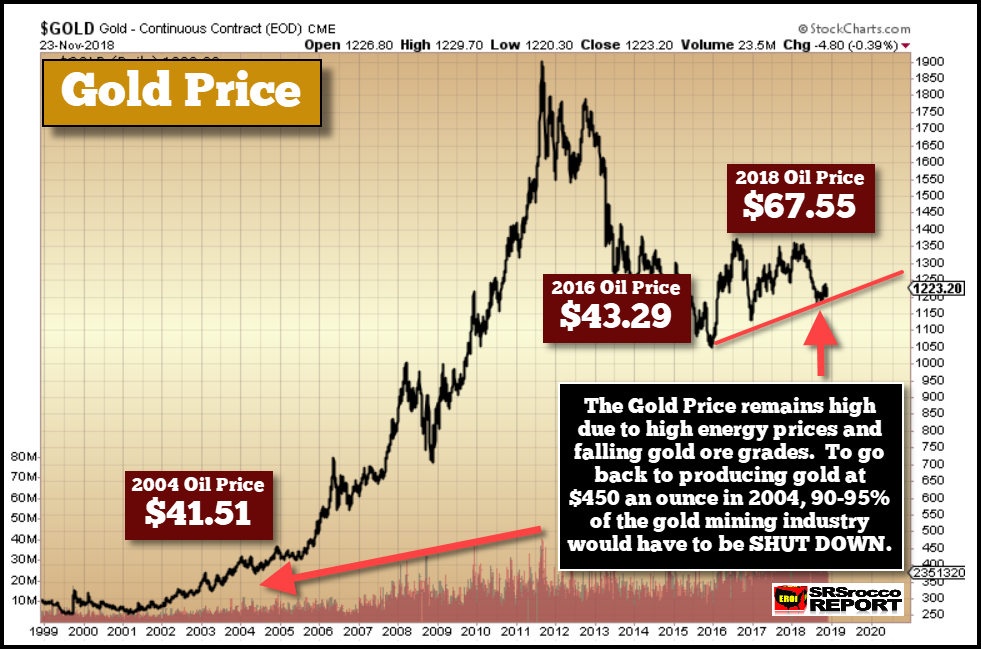
The oil price fell to a low of $43.29 a barrel in 2016, thus pulling down the cost to produce gold. However, as the oil price increased to $67.55 in 2018, it impacted the gold miners production cost. But, there is something even more important if we compare the oil price and gold production cost in 2004 versus 2016.
Here is a chart of the top two gold miners, Barrick and Newmont, estimated break-even cost since 2000:
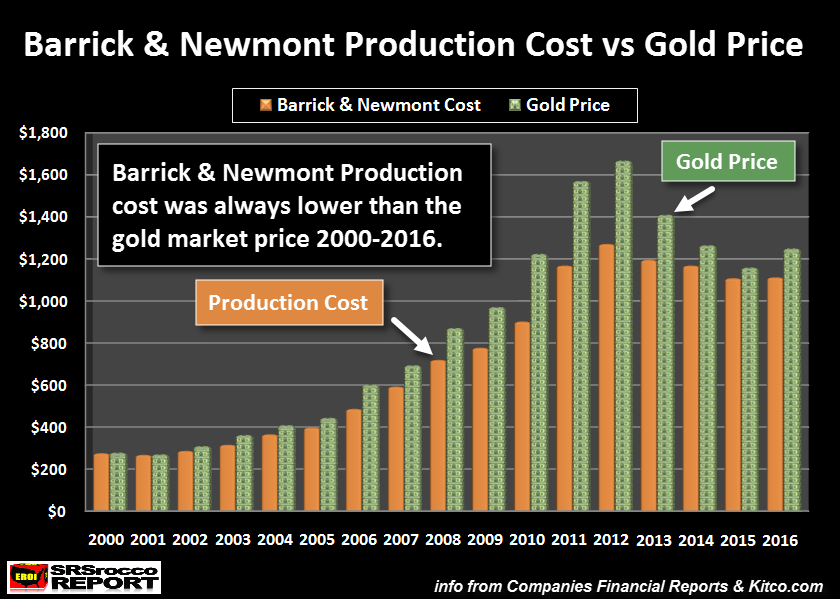
In 2004, the top two gold miners estimated total production cost was $366 based on a market price of $410. However, by 2016, Barrick and Newmont’s combined production cost increased to $1,123 per ounce. What is quite fascinating is that the oil price in 2016 at $43.29 wasn’t much higher than the 2004 average oil price of $41.51. So… WHY WAS THE GOLD PRODUCTION COST THREE TIMES HIGHER in 2016 versus 2004, while the oil price was only a few bucks higher???
While it is impossible to understand all the valuables why it cost so much more to produce gold today than it did 10-15 years ago, I believe the Falling EROI – Energy Returned On Invested is the main factor as it has THUNDERED throughout the entire economy. It doesn’t matter if the oil price falls back to $30, it will not lower the overall cost to produce gold all that much.
So… HARRY DENT, it’s time to update your analysis.
In future articles I will explain with the gold price will likely decouple from the ENERGY COST ANALYSIS due to the collapse in the value of most assets as global oil production plummets.
Lastly… as forecasted the CRYPTO MARKET Continues to pop to new lows.
Check back for new articles and updates at the SRSrocco Report.

Independent researcher Steve St. Angelo (SRSrocco) started to invest in precious metals in 2002. Later on in 2008, he began researching areas of the gold and silver market that, curiously, the majority of the precious metal analyst community have left unexplored. These areas include how energy and the falling EROI – Energy Returned On Invested – stand to impact the mining industry, precious metals, paper assets, and the overall economy. He has written scholarly articles in some of the top precious metals and financial websites. Visit his website SRSrocco Report.


