Another May Of Dismay For Gold?


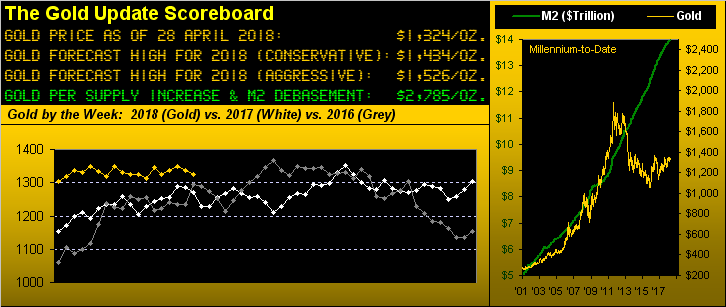
Not exactly the most cheery way to transit toward the month of May. For as we look above at Gold's comparative weekly tracks -- 2018 in gold, 2017 in White and 2016 in Grey -- the past years' like weeks have brought dismay into May. Not that seasonality has to repeat itself: but we're not optimistic on gold near-term, especially with certain technical studies having turned negative.
That said, millennium-to-date, gold has suffered but eight down Mays, as opposed to 10 for both June and October and 11 for March. However, for the past seven years, gold hasn't posted a May net gain of even just 1% in any of them. To wit, here are gold's May percentage changes from 2001 through 2017:

"So what has been gold's best month, mmb?"
August, Squire. In the last 17 years, gold has had just four down Augusts, including only one (2016) since 2009. "Luv August!" ... But that is four months out from now: and in just the past week on Gold's daily chart, the MACD (Moving Average Convergence Divergence) crossed to negative, as did the Price Oscillator, and the Moneyflow slipped below its midpoint at 50 (scale 100-to-0) indicative of outflow. With gold having settled out this past week yesterday (Friday) at 1324, 'tis been these lower 1300s that have supported price time and again year-to-date, nary a trade in the 1200s (as yet?) made.
Indeed to this point in 2018 (with but one trading day left to complete the year's first four months) we find per the BEGOS Markets Standings that gold still is up (barely), the bulk of trading dough having poured into Black gold as shown here:
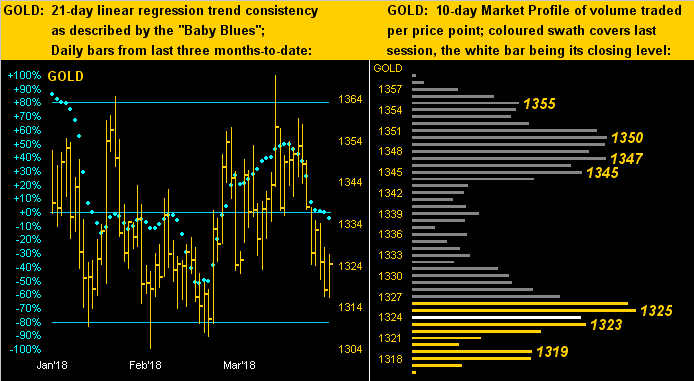
Specific to real gold, we noted a week ago price's then being within range to flip the weekly Parabolic trend from Long -- which still is the case -- to Short. But the wiggle room now to the ensuing week's flip price of 1316 being just eight points likely ends this 16-week run of ascending blue dots as next shown in the weekly bars: Gold's "expected daily trading range" alone is 14 points, let alone the "expected weekly trading range" being 31 points. All just in time for May:
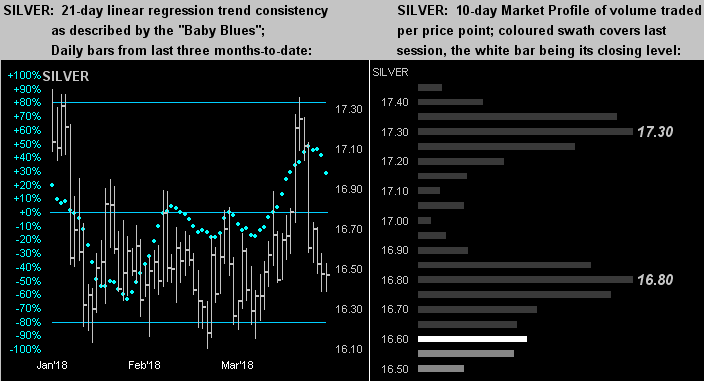
Note too that Silver's joyride binge up into the 17s did quickly unhinge, price in turn settling out the week at 16.550 for a -3.6% splat (vs. gold's -1.0%), enough to shove the Gold/Silver ratio back above 80x.
Moreover we've this view of Silver's sub-par performance from a year ago-to-date as measured by the Global X Silver Miners exchange-traded fund (SIL) -10%, the worst of the comparative bunch which shows Newmont Mining (NEM) +24%, Franco-Nevada (FNV) +7%, gold itself +5%, the VanEck Vectors Gold Miners exchange-traded fund (GDX) +4% and the miraculously not-under-water Goldcorp (GG) "unch", the latter without a year-over-year loss (by this monthly test) for the first time since February 2017. Now if we could just get the miners' leverage to return, (or at least after any post-May dismay):
Turning from dismay to upside display is our Economic Barometer. Whilst 'tis said that in the shadows lie indications of contraction and stagflation, headline metrics hitting the Econ Baro have it heading higher for a second consecutive week. Highlights there included improvements in both New and Existing Home Sales, the Employment Cost Index increasing in Q1 by 0.8% for just the second time since Q4 of 2007 -- indicative of better pay and compensation -- all supported with sentiment improvement in surveys by both the Conference Board and University of Michigan. Perfect timing for it all to coincide with the Federal Open Market Committee were they to vote this coming Wednesday (02 May) to raise their Bank's Funds Rate up into the 1.75% to 2.00% target range. Or might further stocks shocks instead keep the FOMC in thumb-twiddling mode, their preferring to stay home and watch on television the latest soap-opera installment of "As the Yield Curve Flattens"? Stay tuned...
Indeed with our eyes still focused on the S&P 500 to correct a full 25%, jumping on the southward bandwagon from the venerable McClellan family is son Tom, noting this past week that stocks' "big bear market" is underway toward an indicator's "promise" of lower lows. And from the tiniest trader to the biggest behemoths in the business, it can get gruesome out there: one only need look at the Grand Duke of Derivatives (Deutsche Bank) to see that this year's declines in both stocks and bonds mauled the institution's Q1 trading results. 'Tis what happens when the "sell" button ain't on the firm's keyboards.
But 'tis certainly on the keyboards of precious metals traders. As we turn to gold's daily bars across the past three months-to-date (below left), note the "Baby Blues" of trend consistency having just now crossed below their 0% axis, whilst price in the 10-day Market Profile (below right) has burrowed itself well down, the nearby 1325 level looking quite resistive:
Such is the same stance for Sister Silver, her "Baby Blues" (left) likely to accelerate lower into the new week such that price in the Profile (right) falls from this present view:
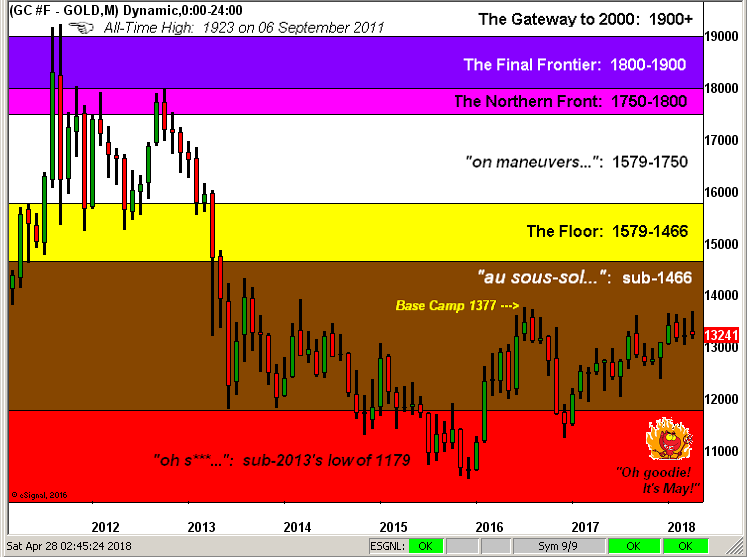
And thus it being month's end, (save for one trading day), here we've our Gold Structure graphic of monthly bars since 2011's All-Time High. One can tell that our little fiendish friend down there knows May is nigh:
In summary as you can tell, we're a bit dour on Gold as well as Silver as May looms ... but we're also devastated by something far more dire as follows:
Emanating this past week from 18 rue d'Aguesseau in Paris came the harrowing report by L'Organisation Internationale de la Vigne et du Vin that (notably to the extenuating circumstances of poor weather in the EU last year) global output of wine fell to its lowest level in 60 years! Sacré blue, mes amis! Given our personal daily dependency on this greatest gift from the gods -- and with prices at the store well and truly rising -- our demand alone may materially push up the rate of inflation so much so that 'twill arrive at the Fed's desired level in fairly swift order. (As least we're doing our part). But hopefully there shan't be too much dismay for gold in May!

Mark Mead Baillie has had an extensive business career beginning in banking and financial services for two years with Banque Nationale de Paris to corporate research for three years at Barclays Bank and then for six years as an analyst and corporate lender with Société Générale.
For the last 22 years he has expanded his financial expertise by creating his own financial services company, de Meadville International, which comprehensively follows his BEGOS complex of markets (Bond/Euro/Gold/Oil/S&P) and the trading of the futures therein. He is recognized within the financial community of demonstrating creative technical skills that surpass industry standards toward making highly informed market assessments and his work is featured in Merrill Lynch Wealth Management client presentations. He has adapted such skills into becoming the popular author each week of the prolific “The Gold Update” and is known in the financial website community as “mmb” and “deMeadville”.
Mr. Baillie holds a BS in Business from the University of Southern California and an MBA in Finance from Golden Gate University.


