Anticipate Before You Participate: Patterns In Trading


The primary unit of time measurement for high-frequency traders might be the microsecond, but for normal retail traders, it’s vital to know the best months, days and even half-hours of the day to make market transactions.
Consider Black Friday, the most active shopping day of the year. Let’s say a 60” 1080p plasma HDTV normally goes for around $900 but, on Black Friday, is discounted to $500. That’s a 44 percent savings. If you had a desire to own this TV and were somehow guaranteed a way to bypass the rabid mobs, you’d be a fool to spend $900 on it the day before.
Likewise, you’d be at a disadvantage to buy or sell a security without first conducting some level of research to determine the optimal time, statistically speaking, to make a transaction. At the very least, you should know when not to make a transaction.
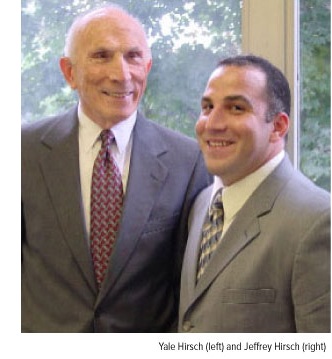 Fortunately, much of this research has already been conducted. My friend Jeffrey Hirsch, following in the footsteps of his late father Yale Hirsch, has for years edited the invaluable Stock Trader’s Almanac, which is updated annually. The book is notable for finding reliable patterns in market trends and behavior, on both the micro and macro scale. It also gave birth to such well-known investing adages as “Sell in May and Go Away” and the “January Barometer.”
Thirty-five years ago when I was just getting started in the investment business, I asked Yale how he managed to arrive at his findings. He told me that his background in music composition enabled him to “hear” melodies, if you will, in four-year presidential cycles, seasonal cycles, weekly cycles and more. This interdisciplinary approach of combining music and finance should inspire all investors to leverage their own unique skills, talents and backgrounds to seek patterns in the market that others might overlook.
If you don’t already own a copy of the Stock Trader’s Almanac, I urge you to make a special trip to the bookstore. You can also visit the book’s website and sign up for a free seven-day trial. The site provides a wealth of helpful and fascinating information for investors to peruse.
The Best Times to Trade
Previously I discussed market patterns in four-year presidential cycles and seasonal cycles. But now let’s look at months and work our way down to half-hours of the trading day.
Months
“Sell in May and Go Away” is more than a clever expression. The Stock Trader’s Almanac has over six decades’ worth of data to support the reliability of this strategy. Based on the S&P 500 Index’s monthly closing prices, November, December and January are the best months for trading volume. Conversely, the worst-performing months of the year fall between May and October. Even though the Dow Jones Industrial Average has been up four of the past five Septembers, the ninth month has still been the worst-performing since 1950 for all of the major indexes and exchanges, including the Dow, S&P 500 Index, NASDAQ and Russell 1000 Index.
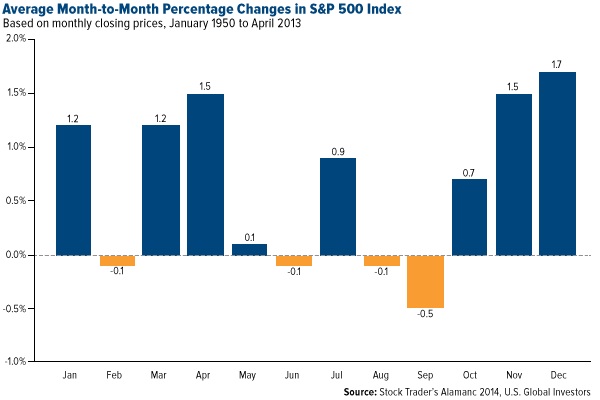
What this shows is that, in August, September and October, it’s time to “nibble” on stocks, as prices are dropping. In March, April and May, it’s time to trim.
As I said, the Dow has been improving slightly in September over the last few years. Its 20-year return has risen to -0.51 percent from its 50-year return of -0.77 percent return.
Theoretically, investing from November 1 through April 30 and then switching to fixed-income products for the rest of the year seems to be a safe and effective strategy. If you backtest this to 1950 with an initial $10,000 investment, you would have gained an estimated 6,740 percent. Investing the same $10,000 from May through October would have cost you $1,024. What a difference six months makes.
I must stress, however, that this chart, and those that follow, shows only probability. Like a basketball bouncing down a rocky mountainside, nothing is certain, and actual behavior varies. Macro events such as presidential elections, midterm elections and changes in fiscal and monetary policy have a dramatic effect on the outcome of the market.
For further data, check out the Almanac’s best and worst S&P 500 entry and exit dates, separated into the five best months (November through April, excluding February) and seven worst months (May through October, including February).
Weeks
Below you can see the best and worst weeks of the Dow, ranging from 2008 to 2012.
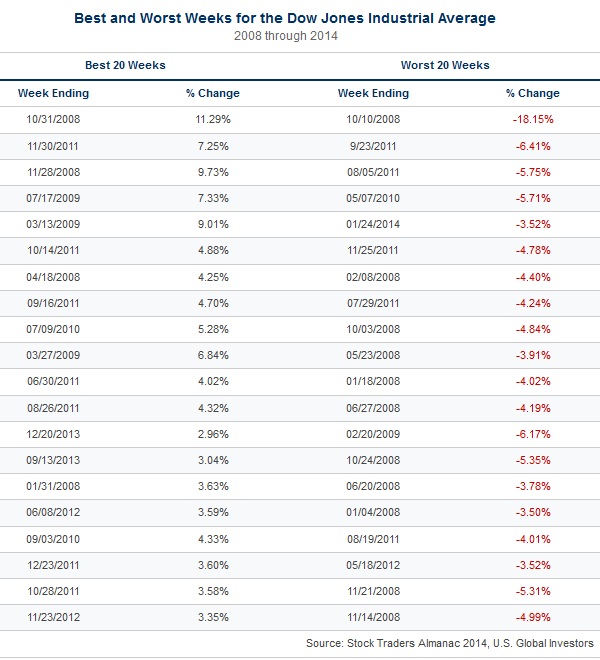
What’s interesting here is that, even though September is historically the worst month in which to trade, it had three of the best weeks and only one of the worst weeks. Conversely, December, one of the best months in which to trade, had only two of the best weeks. No week in December fell in the “worst” category, however.
Days
Which day is the best to buy? Which day is the best to sell? That depends on whether we’re talking about days of the week, days of the month, days preceding or following holidays—there are innumerable contexts and implications to consider, all of which have already been carefully studied and scrutinized by Yale and Jeffrey Hirsch.
According to Hirsch, the best day to trade was once the last trading day of the month, followed by the first four trading days of the next month. Front-runners who noticed this trend, however, took advantage of it, leading to a shift in 1982. Since then, the strongest days tend to fall on the ninth, tenth and eleventh trading days of the month.
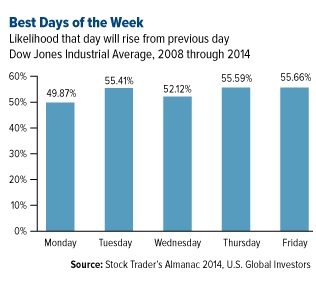 To the right, you can see what Hirsch’s research says are the days of the week when the greatest likelihood that performance will rise in the Dow will occur. Between 2008 and 2014, Mondays have been the weakest, climbing less than 50 percent of the time—the only trading day to fall more than it rises, in fact.
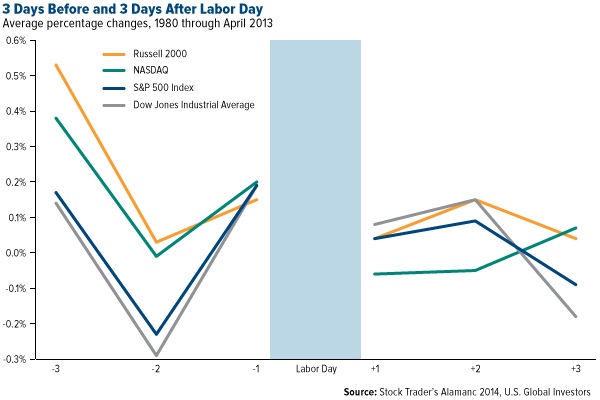
As a special case study, let’s focus just on the three days before and after a holiday, specifically Labor Day. Historically, how does the market react to this particular day?
The following chart tracks the historical 33-year performance of four major indexes three trading days before and after Labor Day. As you can see, investors tend to be bullish on the Friday preceding the weekend (-1) and bearish starting Tuesday, the first trading day of the week (+1). The NASDAQ does slightly better than the other three both before and after the holiday, leading into the rest of September.
There’s plenty more research on the best days on which to trade—and which to avoid—in The Stock Trader’s Almanac.
Hours and Half-Hours
Canada is the largest natural resource market in the world. The TSX Venture Exchange, with a market capitalization of over $37 billion, represents approximately 2,250 small-cap companies, many of them in the mining and metals space.
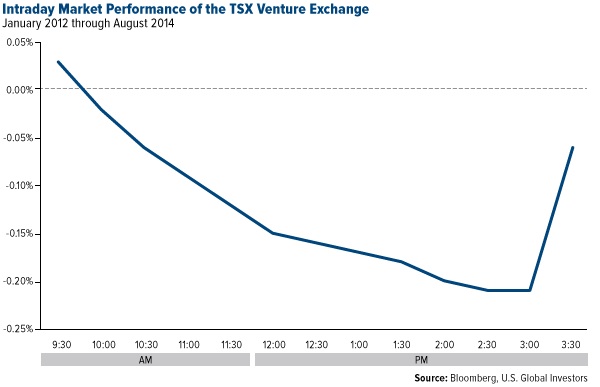
What you see above is the intraday market performance of the TSX Venture. I chose to use it as an illustration because mining, metals and gas are some of our specialties here at U.S. Global Investors. Therefore, it’s imperative that our portfolio management team is cognizant of these exchange-specific intraday trends to buy and sell stock at the best possible price and execution.
With the TSX Venture, it’s generally smarter to sell rather than buy in the morning. Over the last two and a half years, this is when prices tend to be high. There’s heavy volatility as the market is reacting to what might have happened since the previous trading day’s closing bell. Unless you really know what you’re doing in this particular market, if you buy in the morning, you can often expect to see your shares sink as the day unfolds.
The “safest” time to buy would be in the late afternoon. The market has cooled somewhat and traders are gauging where things might be headed. The challenge during this time, however, is that volume has dipped and, as a result, bid-ask spreads have widened.
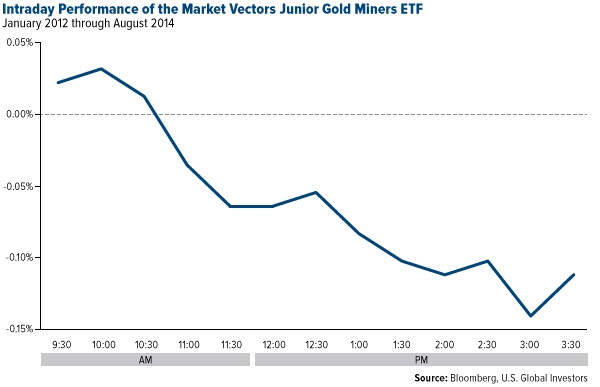
A similar pattern emerges, a little like the shape of a waterslide, if you chart the intraday performance of the Market Vector Junior Gold Miners ETF, which gives investors exposure to small and intermediate gold and silver companies. Prices are highest in the morning, decrease throughout the afternoon and then get a final boost starting around 3:00. Making a trade at 9:30, then, will have a vastly different outcome than making one at 1:30.
Now compare the TSX Venture and Market Vectors Junior Gold Miners ETF, both of which have their own DNAs of volatility, to the NASDAQ 100 ETF—or “the Qs”—which tracks the 100 largest and most active non-financial and international companies listed on the greater NASDAQ. In other words, blue chip stocks.
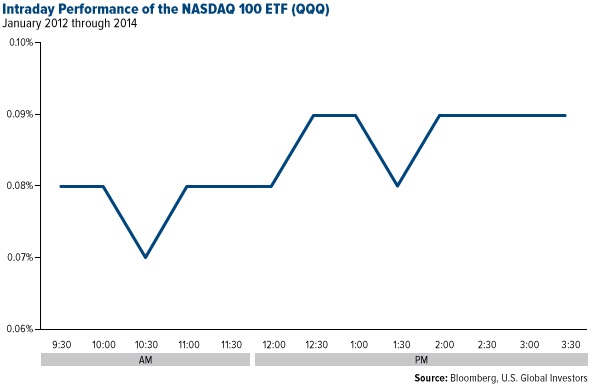
Over the same timeframe as the previous indexes, the pattern here has almost reversed. Relative lows in the morning. Modest improvement throughout the trading day. You could, in this market, reasonably buy in the morning and sell in the afternoon.
Again, these charts are imperfect and show only probability. Trading activity can fluctuate widely, especially prior to and after earnings and economic announcements. And there will always be the unforeseen event—a workers’ strike, a CEO’s termination or resignation, civil unrest—that shakes up the market.
You don’t have to be as obsessed and intuitive with statistics and patterns as Yale or his son Jeffrey Hirsch, but it pays to “Anticipate Before You Participate.” If there’s one thing I want to leave you with, it’s that research must be conducted on the market you’re planning to trade in before you enter.
All opinions expressed and data provided are subject to change without notice. Some of these opinions may not be appropriate to every investor. By clicking the link(s) above, you will be directed to a third-party website(s). U.S. Global Investors does not endorse all information supplied by this/these website(s) and is not responsible for its/their content.
The Russell 1000 Index is a U.S. equity index measuring the performance of the 1,000 largest companies in the Russell 3000 Index. The Russell 3000 Index consists of the 3,000 largest U.S. companies as determined by total market capitalization. The Russell 2000 Index is a U.S. equity index measuring the performance of the 2,000 smallest companies in the Russell 3000. The Russell 3000 Index consists of the 3,000 largest U.S. companies as determined by total market capitalization. The Dow Jones Industrial Average is a price-weighted average of 30 blue chip stocks that are generally leaders in their industry. The S&P 500 Stock Index is a widely recognized capitalization-weighted index of 500 common stock prices in U.S. companies. The Nasdaq Composite Index is a capitalization-weighted index of all Nasdaq National Market and SmallCap stocks. The S&P/TSX Venture Composite Index is a broad market indicator for the Canadian venture capital market. The index is market capitalization weighted and, at its inception, included 531 companies. A quarterly revision process is used to remove companies that comprise less than 0.05% of the weight of the index, and add companies whose weight, when included, will be greater than 0.05% of the index. The Market Vectors Junior Gold Miners Index is a market-capitalization-weighted index. It covers the largest and most liquid companies that derive at least 50 percent from gold or silver mining or have properties to do so. The NASDAQ-100 Index includes 100 of the largest domestic and international non-financial securities listed on the Nasdaq Stock Market based on market capitalization.
Fund portfolios are actively managed, and holdings may change daily. Holdings are reported as of the most recent quarter-end. The following securities mentioned in the article were held by one or more of U.S. Global Investors Funds as of 6/30/2014: Market Vectors Junior Gold Miners ETF.
 Frank Holmes is the CEO and Chief Investment Officer of U.S. Global Investors. Mr. Holmes purchased a controlling interest in U.S. Global Investors in 1989 and became the firm’s chief investment officer in 1999. Under his guidance, the company’s funds have received numerous awards and honors including more than two dozen Lipper Fund Awards and certificates. In 2006, Mr. Holmes was selected mining fund manager of the year by the Mining Journal. He is also the co-author of “The Goldwatcher: Demystifying Gold Investing.” Mr. Holmes is engaged in a number of international philanthropies. He is a member of the President’s Circle and on the investment committee of the International Crisis Group, which works to resolve conflict around the world. He is also an advisor to the William J. Clinton Foundation on sustainable development in countries with resource-based economies. Mr. Holmes is a native of Toronto and is a graduate of the University of Western Ontario with a bachelor’s degree in economics. He is a former president and chairman of the Toronto Society of the Investment Dealers Association. Mr. Holmes is a much-sought-after keynote speaker at national and international investment conferences. He is also a regular commentator on the financial television networks CNBC, Bloomberg and Fox Business, and has been profiled by Fortune, Barron’s, The Financial Times and other publications. Visit the U.S. Global Investors website at http://www.usfunds.com. You can contact Frank at: [email protected].


