Are Stocks About To Drop, With Gold About To Rally?


Breadth is becoming a problem for the long-term prospects of this stock market rally from December 2018. Below we show updated charts of large and growing Bearish divergences between the major averages and their 10-day average Advance / Decline Line Indicators and their Demand Power measures. What this is telling us is the recent rise in the market is coming on the shoulders of fewer stocks. This is also telling us that stocks are approaching a top.
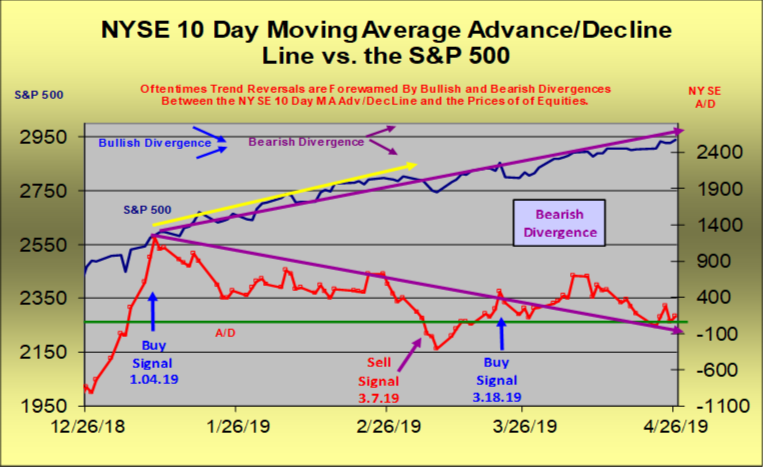
There is a large and growing Bearish divergence between the NYSE 10-day average Advance/Decline Line Indicator and the S&P 500, which is warning that a decline is approaching.
While this indicator identifies bifurcation points with Buy or Sell signals, it also gives an early warning of trend reversals, as divergences develop.
The NYSE 10-day average Advance/Decline Line Indicator triggered a Buy signal on March 18th (Buy signals occur when the NYSE 10-day average A/D Indicator rises above positive + 120).
Previous to this, the S&P 500 rose sharply after the Buy signal on January 4th (Buy signals occur when the NYSE 10-day average A/D Indicator rises above positive +120).
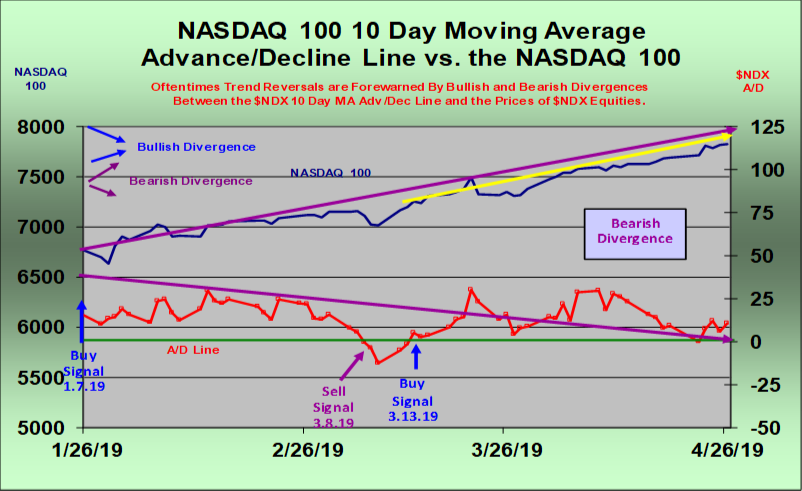
The NASDAQ 100 has formed a large and growing Bearish divergence with its 10-day average Advance/Decline Line Indicator, which is warning that a decline is approaching.
The above chart shows this A/D indicator also gives trend-identifying Buy and Sell signals. Once it triggers a new Sell, we will know the next trend down has started.
The NASDAQ 100 10-day average Advance/Decline Line Indicator triggered a Buy signal on March 13th (Buy signals occur when the NDX 10 day average A/D Indicator rises above positive + 5).
Previous to this, the NASDAQ 100 rose sharply after the Buy signal on January 7th (Buy signals occur when the NDX 10-day average A/D Indicator rises above positive + 5).
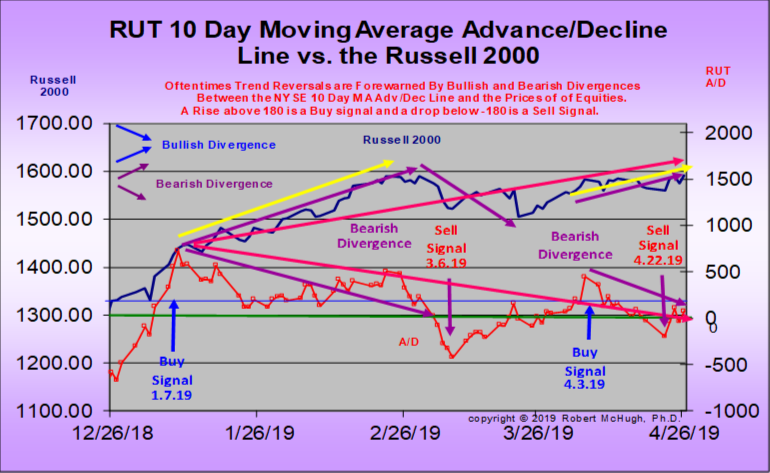
The small cap Russell 2000 10-day average Advance/Decline Line Indicator triggered a new Sell signal on April 22nd, 2019.
There is a large, and a small, Bearish divergence between the Russell 2000 and its 10-day average Advance/Decline Line Indicator, warning that small caps are approaching a strong decline. This divergence is telling us that fewer and fewer stocks are participating in the rally, an early warning of a coming reversal to the downside.
Previous to this new Sell signal, the RUT rose sharply from a Buy signal on January 7th, 2019. This signal has shown very good correlation with the start of price trends.
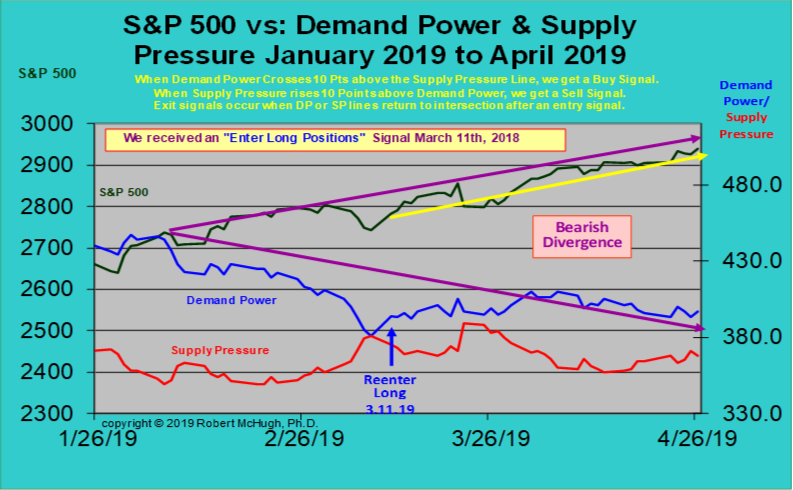
There is also a large and growing Bearish divergence between the S&P 500 and its Demand Power Measure, warning that a sizable stock market decline is coming.
Our Demand Power / Supply Pressure Indicator generated an Enter Long signal March 11th, 2019, and remains there April 26th, 2019. After the November 22nd Buy signal, the S&P 500 rose 275 Points. In addition to Buy and Sell signals, another feature from this indicator is we can get an early warning of a trend reversal when we see the Demand Power and Supply Pressure Indicators start to converge measurably, or we see a divergence between prices and Demand Power.
After the Buy signal in November 2016, the S&P 500 rose 170 points and the Dow Industrials rose 1,701 points! After it triggered a Buy on February 17th, 2016, the Industrials rose 1,713 points!
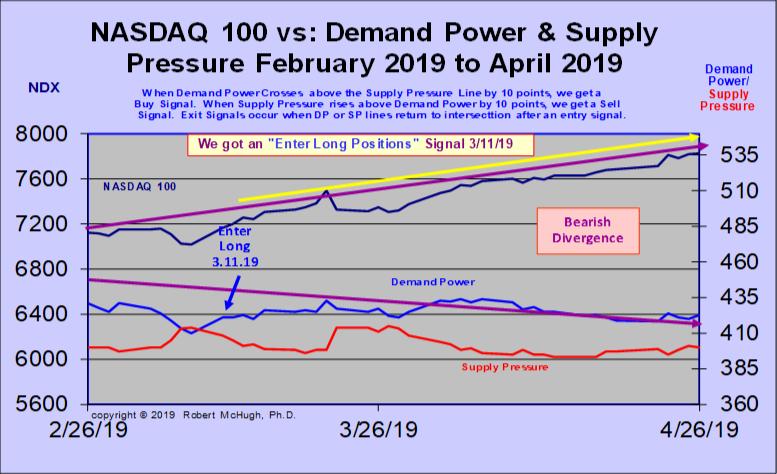
The NASDAQ 100 has formed a large and growing Bearish divergence with its Demand Power measure, which is warning that a decline is approaching.
The NASDAQ 100 Demand Power / Supply Pressure Indicator triggered a new Enter Long signal on March 11th. The divergence is telling us buying interest is waning, a sign of weakness.
In the next chart we see that the Secondary Trend Indicator (a.k.a. our Technical Indicator Index) is showing weakness on this rally from December 2018, and in fact there is a large Bearish divergence between the S&P 500 and this indicator. Once this Intermediate term indicator generates a new Sell signal, we will have confirmation the coming top is in and the next significant decline is starting.
After the Secondary Trend Indicator triggered a Buy signal (which also came on our Phi mate turn date) July 3rd, 2018, the S&P 500 rose 212 points. It topped on our October 3rd Phi mate turn date. After the Buy signal on August 30th, 2017, the S&P 500 rose 388 points!
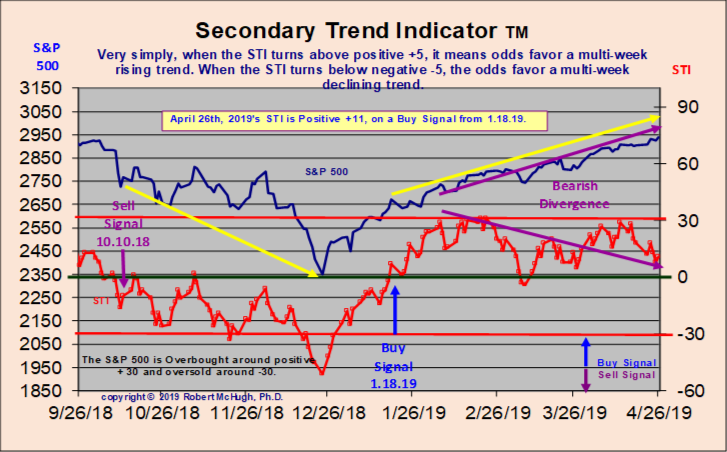
After the STI Buy signal in May 2016, the Industrials rose 744 points. It triggered a Buy signal March 3rd, 2016 which led to a 1,223 point rally in the Industrials. After the July 22nd, 2015 Sell Signal, the Industrials fell 2,400 points through January 20th, 2016!
So, we can see that across the board, the stock market is weakening fast, which is typical of concluding rallies. The longer and larger the Bearish divergences, the worse the subsequent decline.
But as interesting as this is for stocks, the timing appears to coincide with what looks like an approaching bottom for gold.
On the next chart, we see that gold is finishing a Bullish Cup and Handle pattern, as it is now inside the Handle portion of the pattern, which also happens to be wave 2-down of 3-up. Gold will rise sharply toward at least 1,600ish inside wave 3-up. Gold is finishing subwave {c}-down of 2-down of 3-up.
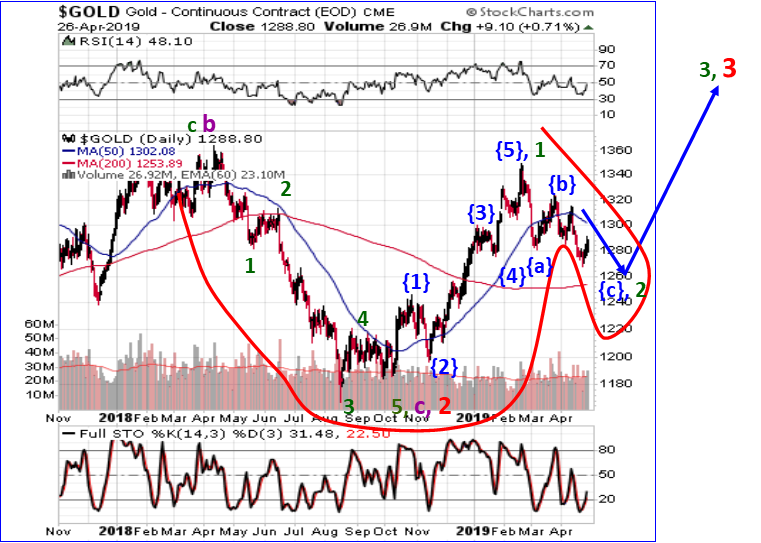
Silver may have bottomed. Once we get a new Buy signal in our HUI Purchasing Power Indicator, HUI 30 day Stochastic, and HUI Demand Power / Supply Pressure Indicator, we will have confirmation the correction is over in Metals and Miners, which most likely will come around the same time stocks top and their next decline begins.
At McHugh’s www.technicalindicatorindex.com we have developed several proprietary indicators that help us identify when the next significant move is starting for Mining stocks, and in which direction the move will develop. We publish these indicators in every Daily Newsletter to subscribers. We also have a Conservative Portfolio model which allocates funds into different segments for safety, liquidity and returns, which includes a Precious Metals and Mining stock segment. We also offer a Premium Platinum Trading program for speculative investing.
*********
More from Gold-Eagle


