Are The US Markets Setting Up For An Early October Surprise?


Many analysts have recently warned that the US markets are setting up for a potentially massive correction, 40~70% some warn. Our own analysis has shown massive market cycles that correlate with an October market correction. Our VIX cycle analysis indicates that we should be expecting a spike in the VIX right now (within the next 3~4 days). What does all this mean in reality for the average investor?
As investors, we have to determine the amount of risk compared to the amount of potential gain in any trade. Our job is to measure this relationship properly and to attempt to find opportunities in taking risks for an adequate amount of gain. Often, this business is difficult to manage expectations and presumed risk factors for traders. We’ve been trading, combined, for over 40+ years and have learned that the markets don’t always do what we expect them to do. A perfect example is our most recent VIX Spike call for Sept 9th ~ 12th. Even though our analysis was valid and accurate, we did not see the VIX spike levels we had projected to happen – such is life in the markets. We strive every week to deliver superior analysis, trading triggers/alerts and daily markets updates to our clients. Right or wrong, we live by our abilities to call successful trading triggers and provide timely and accurate market research.
Right now, a number of US major markets are setting up with divergence between price and common technical indicators. Because many investors fail to even review or focus on longer term charts, very few may be aware of these setups. Given the size and strength of the recent moves, we are not making predictions regarding the downside price potential (although it could be substantial). We are simply pointing out that these divergence patterns are setting up in a number of US major markets and we believe this is a significant correlation pattern of a future event.
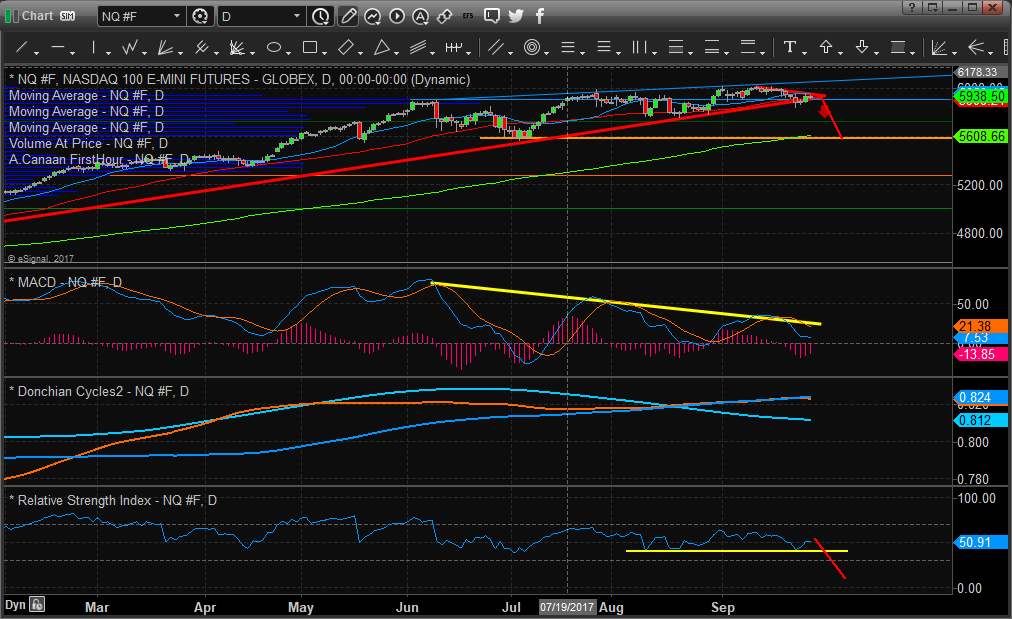
This Daily NASDAQ chart provides one of the clearest examples of the divergence patterns. Price has continually tightened within an upward sloping trend channel and has recently formed a bear flag formation. MACD has related multiple divergence tops over the past 3+ months and RSI has hovered just above 45 throughout this trend to support the upward move. As washout high reversal early this week would be a perfect setup for a divergent reversal. A prices spike a bit higher early this week followed by a deep market correction.
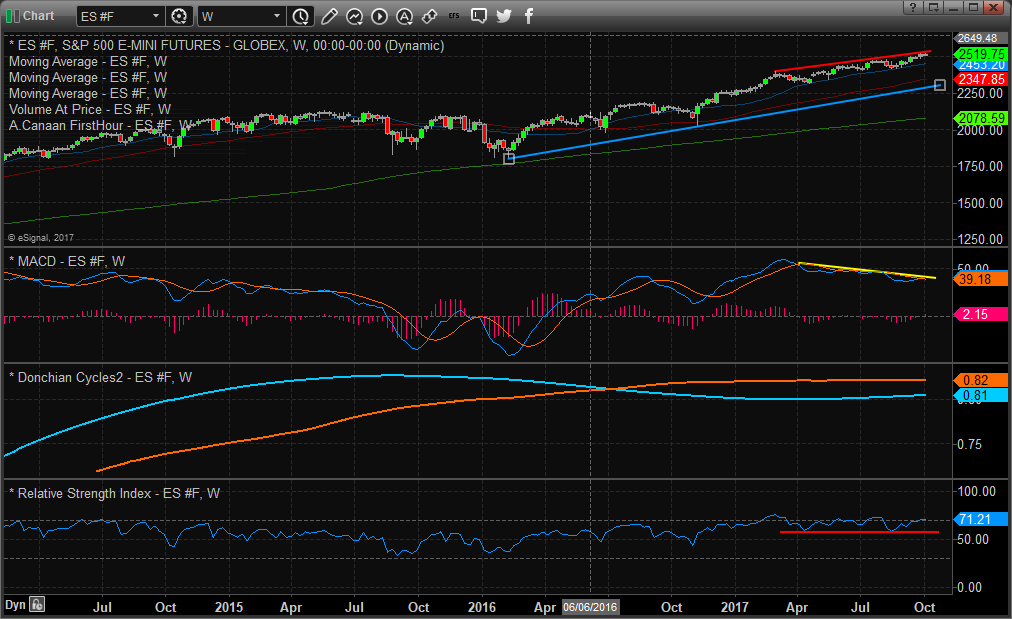
This second chart of the ES provides even further evidence of the setup. This chart is a Weekly ES (S&P) chart that shows the divergent price action going all the way back to February/March of 2017. The cyan blue trend channel (support level) is clearly our potential downside target and the RSI is continuing to hover above 58 as this trend continues. Could the extended divergence be warning of a potentially massive correction? If so, the RSI would quickly fall to below 50 and price would attempt to retest the support channel (-200 pts from current levels).
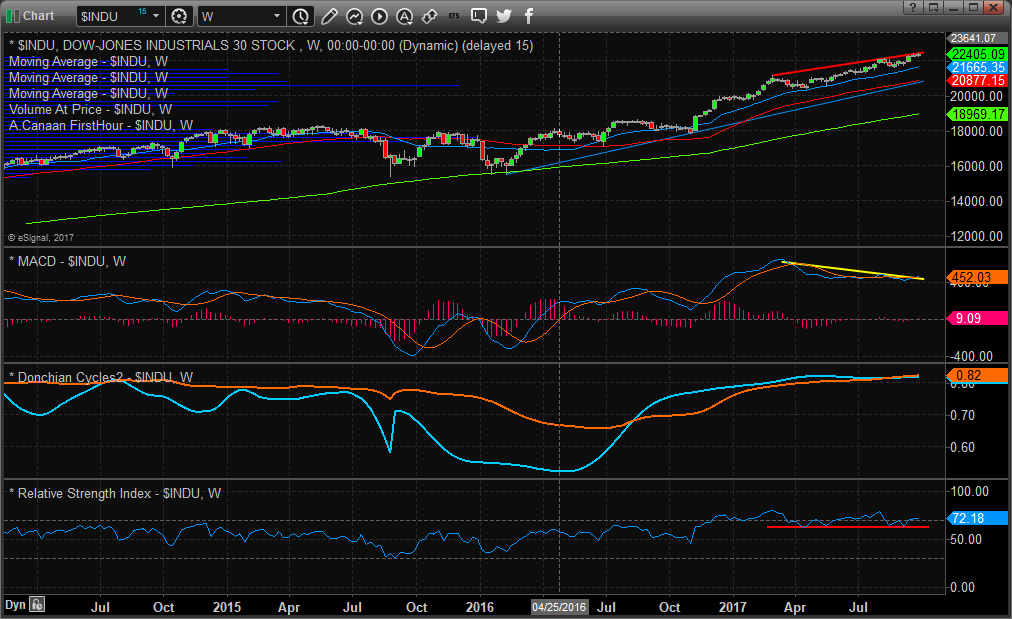
The following chart of the INDU, again, shows the US majors are all setting up in a similar pattern. One can clearly see the continued divergence price pattern from early 2017 and the continued RSI support above 60. The confluence of these divergence patterns is causing us to be concerned of a surprise price rotation in early October. We’ve seen what we call a “washout price rotation” happen over and over in the markets near critical tops and bottoms. The telltale signs of these moves is extended weakness of a trend (as indicated by the MACD divergence), technical failure (which would be the resulting RSI breakdown) and a moderately high volume “last price advance” followed by a clear and quick price reversal (the “washout setup”).
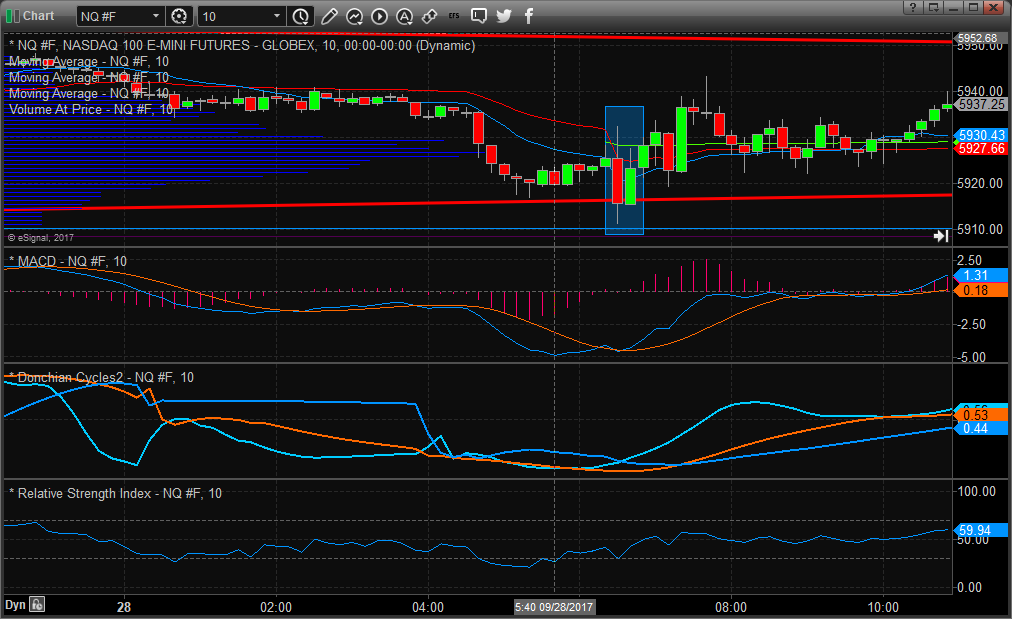
To further assist you in understanding this type of setup/reversal, we’ve provided a clear Intraday NQ Washout reversal setup for you to see what it looks like. This is a nearly perfect example of bigger volume and price range at the end of a trend (what we call the exhaustion move) that sets up the new bullish trend. You can see the NQ market had been moving lower and had been consolidating briefly. Just before this washout move, it appears the market was “pausing a bit”. Then, seemingly out of the blue, a big down move generated lots of renewed interest from sellers. Only to have that “exhaustion move”, or what we term the “washout low” to sucker in the sellers, stop out the longs and, eventually, continue much higher.
Could this be setting up this week with an early Monday/Tuesday washout high price rotation in the US markets? Could this be the setup reversal that coordinates with our VIX Spike trigger?
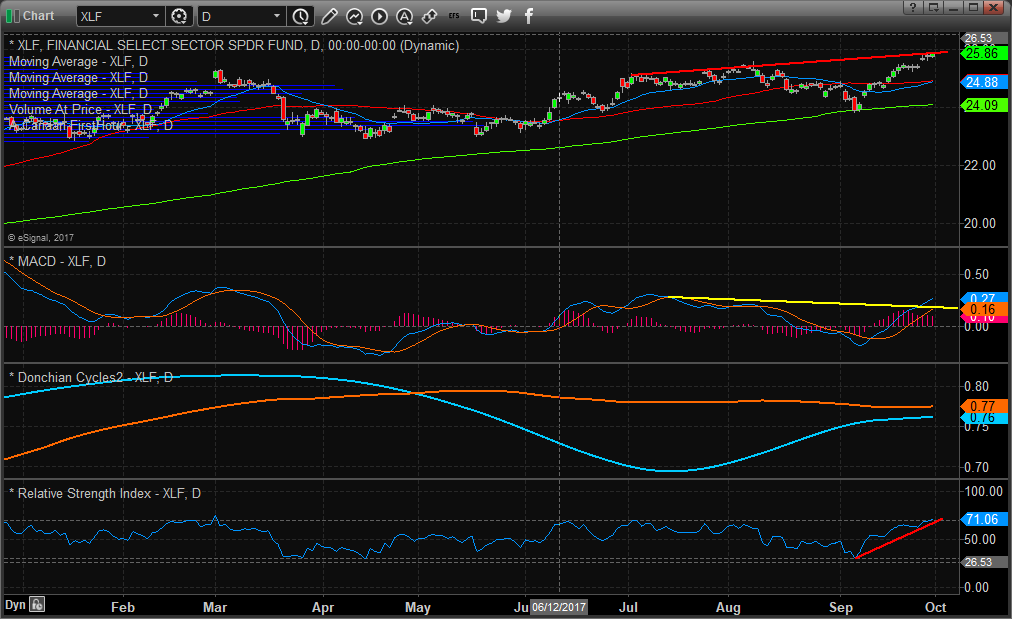
Two items we will be watching early this week are the NQ (tech heavy and usually an early indication of any general market weakness) the XLF (US banking sector). The recent hurricanes and natural event disasters are surely to take a toll on the US consumer for a while. Recent news has suggested that consumer spending is flat in certain areas and that GDP may flatten out a bit. We assume delinquencies will begin to skyrocket based on displaced workers and jobs over the next 6+ months. This leads us to believe a market correction would be a natural, and healthy, event in the immediate near future.
Markets just don’t “go up” perpetually. This recent move higher has been one of the longest in history to not see a 5% or greater correction. Markets need breadth in order to have healthy rotation and we are simply not seeing it recently. This is why we believe any rotation or correction at this time could be bigger than most think. Possibly retesting 2016 lows.
Notice the similarities in all of these charts. It is almost like everything has been running on autopilot in terms of price appreciation within the US majors. We do not have any indication of a sell trigger yet. We would warn investors to be cautious at this time and to protect open long positions. We do believe a price reversal in these US majors will begin before Oct 19th and quite possibly as early as October 4th or 5th. Any moderate price advance early this week followed by immediate price weakness and rotation could be the setup of a much deeper price move.
If you want to continue to receive these types of detailed analysis reports, timely market triggers and analysis as well as Daily market updates, visit www.ActiveTradingPartners.com today and see why our members continue to value our content. We are dedicated to assisting you in making better trading decisions and seeing what is in the future with our detailed market analysis and research.

Are you prepared for the next major market move? If not, visit www.ActiveTradingPartners.com today and see why you should consider joining our team of valued members. Isn’t it time you invested in your future success?
********

Chris Vermeulen has been involved in the markets since 1997 and is the founder of Technical Traders Ltd. He is an internationally recognized technical analyst, trader, and is the author of the book: 7 Steps to Win With Logic
Through years of research, trading and helping individual traders around the world. He learned that many traders have great trading ideas, but they lack one thing, they struggle to execute trades in a systematic way for consistent results. Chris helps educate traders with a three-hour video course that can change your trading results for the better.
His mission is to help his clients boost their trading performance while reducing market exposure and portfolio volatility.
He is a regular speaker on HoweStreet.com, and the FinancialSurvivorNetwork radio shows. Chris was also featured on the cover of AmalgaTrader Magazine, and contributes articles to several financial hubs like MoneyShow.com.


