Are We Approaching A "Once-In-A-Century" Type Event In The Stock Market?


As many of you know, I will often read articles written by others -- along with the comments -- to gauge the overall sentiment of the market from an anecdotal perspective. During one of my recent perusals of articles, I noticed a quote of the following statement by Sir John Templeton:
"For 100 years optimists have carried the day in U.S. stocks. Even in the dark 70's, many professional money managers, and many individual investors too, made money in stocks, especially those of smaller companies.
"There will, of course, be corrections, perhaps even crashes. But, over time, our studies indicate stocks do go up. As national economies become more integrated and interdependent, as communication becomes easier and cheaper, business is likely to boom. Trade and travel will grow. Wealth will increase. And stock prices should rise accordingly."
This is certainly an appropriate assessment of the last one hundred years. But, what happens if we are now approaching an event that we only experience once in a hundred years?
Most of you have read very bullish stock market articles from me for many years.
And, I still think that we have a number of good years ahead of us. However, the same patterns which profitably guided us on the long side of the market are also showing us where the storm clouds will be rolling in. And, we have not seen storm clouds like this for approximately 100 years.
Those that have followed me for a number of years have seen some of the major calls we have made about various markets which did not make sense at the time, but which often came to fruition. Some of them include the top to the metals back in 2011 (when most of the market was certain of $2,000+ gold), the rally in the dollar from 73 to 103 (when most were certain that QE will cause the dollar to crash), the bottom in gold in 2015 (when most were certain of sub $1000 gold), and the stock market rally to 3000 (yes, I was off by a few points on this one), just to name a few. I have outlined in prior articles the methodology I utilize to identify these major turning points, yet many still assume I use voodoo or analysis of goat entrails.
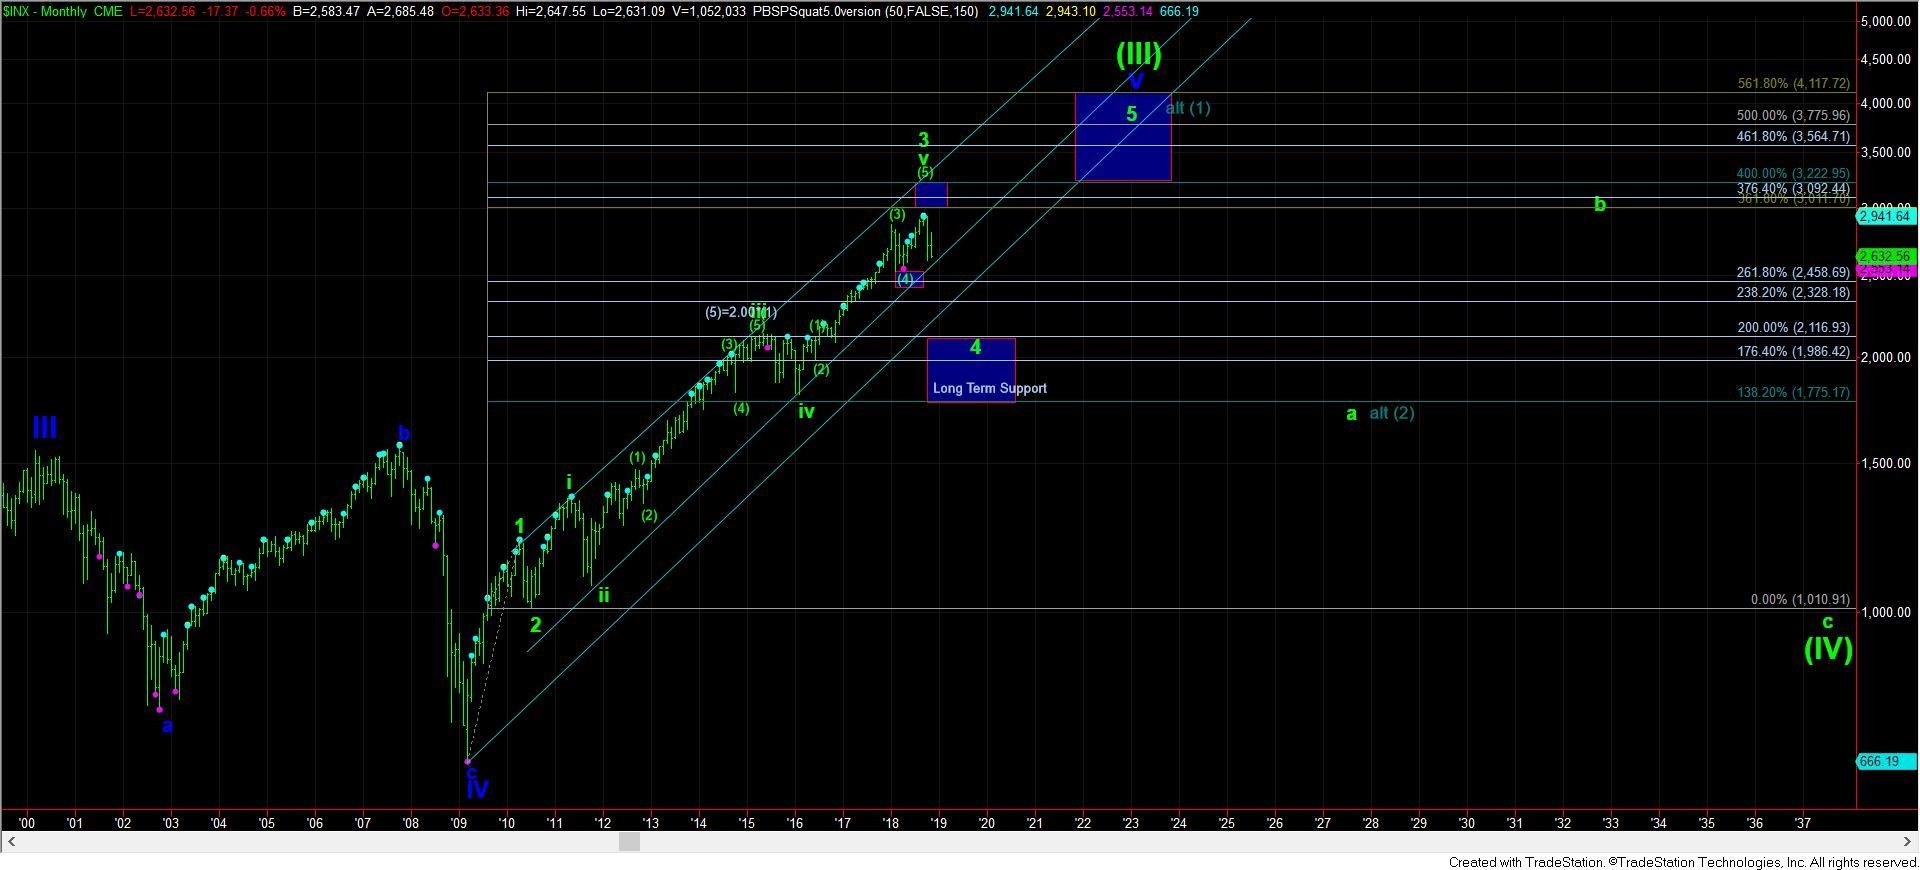
But, as you can see from the attached chart, I am looking for wave 3 off the 2009 lows to top out, and to then begin a 30% correction. However, once that correction runs its course, I think we will see several more years of rally before this bull market which began in 2009 will come to an end. And, worse yet, I think that we can enter a bear market that can last as long as 20 years, and which can rival that which was seen during the Great Depression.
You see, when we top out in wave V of (III) on my monthly chart, the ensuing wave (IV) is of the same degree as the Great Depression, as that was the wave (II) within this very long term 5-wave Elliott Wave structure. And, while we know that history does repeat itself (maybe not exactly, but it certainly does rhyme), I think the probabilities of seeing a similar environment to that of the Great Depression will be quite elevated, especially as we approach the bottom of the c-wave of wave (IV).
What is most interesting is that while Sir John Templeton's statement is true for the last 80 years, it is only viewing the markets in a long-term uptrend. That is especially true if you view it after the Great Depression. However, financial markets are not linear. So, assuming markets will continue in the same manner as they have for the last 80 years is not really the correct way to view our financial markets.
Back in 1940, Ralph Nelson Elliott provided many with what is likely the best market call of all time:
"[1941] should mark the final correction of the 13 year pattern of defeatism. This termination will also mark the beginning of a new Supercylce wave (V), comparable in many respects with the long [advance] from 1857 to 1929. Supercycle (V) is not expected to culminate until about 2012."
While I think Elliott was off a bit on the timing, as I think we may not be completing this rally just yet, consider that his prediction for a massive multi-decade bull market was made when World War II was raging around him. Personally, I view this as the best market call of all time.
So, while standing on the shoulders of giants such as Ralph Nelson Elliott, my view is that the next major top we see in a few years from now may usher in a period to rival that of the Great Depression, but potentially over a more protracted period of time.
The main reason I think it will potentially last for more than 10 years is because the 4th wave of one lesser degree (outlined by the a-b-c structure in blue IV between 2000-2009) is a 4th wave of one lesser degree, and that lasted for 9 years. A 4th wave of a greater degree will likely take much longer than one of a lesser degree.
Now, we all know that we cannot clearly see the future. As Yogi Berra once said,
"It's tough to make predictions, especially about the future." So, we deal with markets from a probabilistic perspective. Therefore, I will also note my alternative perspective, presented in dark green on my attached monthly chart, which still would see a 4-8 year bear market (alt (2)), but can project this bull run off the 2009 lows to continue for much longer.
Unfortunately, we will not be able to make any assessments about this more bullish potential for probably at least 10 years from now. And, for those that have followed us over the long term, you know that we always view the market as it presents to us, and not as we assume it to be. But, I think it to be quite prudent to prepare for the worst, and hope for the best.
As we get closer to the major top I see in the markets, I will likely pen an article which will address my longer-term expectations on the markets. While I have discussed some of them with the members of my services, and have alluded to some of the issues I see in my public writings, I think we have strong potential to enter an environment unlike one we have experienced in one hundred years. However, we have seen glimpses and warnings of it during the past decade. I hope to elaborate in the years to come.
 Avi Gilburt is a widely followed Elliott Wave technical analyst and author of ElliottWaveTrader.net, a live Trading Room featuring his intraday market analysis (including emini S&P500, metals, oil, USD & VXX), interactive member-analyst forum, and detailed library of Elliott Wave education. You can contact Avi at: [email protected].


