Battered, but Still Bullish on Gold & Silver


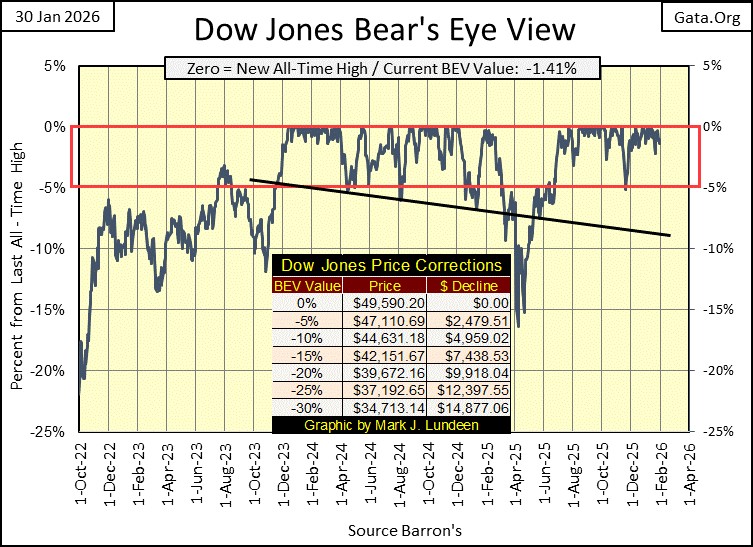
This was a wild week for gold, silver, and the mining shares. Monday – Wednesday, gold, silver, and the XAU all closed at new all-time highs. On Thursday they took a break. Then came Friday, which was something completely different; trading not seen since the early 1980s. But before we go there, let’s first look at the Dow Jones Bear’s Eye View chart below.
Okay, the Dow Jones closed this week in scoring position. Only 1.41% below its last all-time high of 49,590.20, seen on January 12th. During a day, Friday, when volcanic magma shifted beneath the gold and silver markets, the Dow Jones was taking it easy. Isn’t that nice, but what is next for the Dow Jones (my proxy for the broad stock market)?
This week, it closed inside scoring position; inside the red rectangle placed between the 0% & -5% lines below. So, we should assume this advance in the Dow Jones, will make additional new all-time highs in the weeks and months to come. What has been for over two years now, will continue to be, until the Dow Jones in its BEV chart below, closes below its BEV -5%, and then below its BEV -10% lines below, but unlike last April, continues going down.
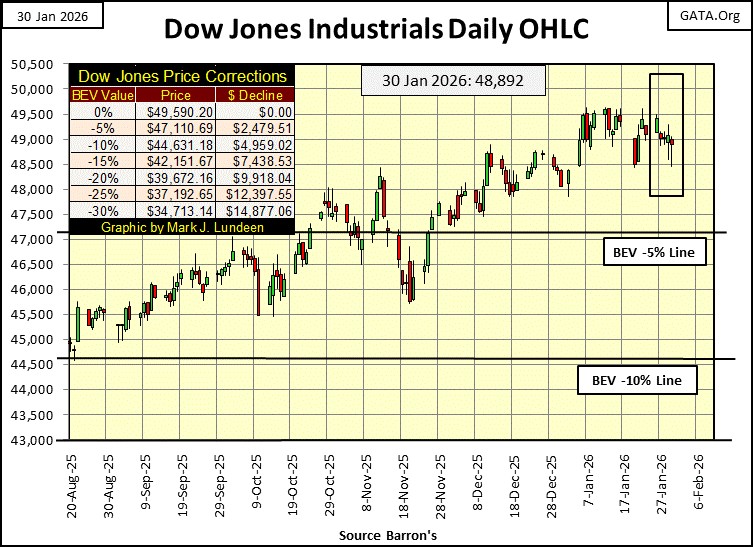
Next is my chart for the Dow Jones in daily bars. This is the fourth week the Dow Jones traded over 49,500, but failed to close above 49,500. Looking at the chart below, since the start of January, the 49,500 line has become a very annoying line of resistance for the bulls.
Stuff like this happens all the time during a bull market advance. For as long as the Dow Jones trades above its BEV -5% line, the smart move is to remain bullish on the stock market, and expect additional new all-time highs. Should the Dow Jones once again trade below its BEV -5% line, say like below a BEV of -7%, it would be prudent to begin selling some of your positions in the market, to lock in some of your profits, and reduce your exposure to a market decline.
Below is my table listing the BEV values for the major stock market indexes I follow. This wasn’t a week where these indexes saw many new all-time highs. The NYSE Composite Index (#3) made two new BEV Zeros this week, on Monday and Tuesday. Other than that, some made one new all-time high during the week. And then on Friday, there were no new all-time highs, but sixteen of these indexes closed inside scoring position, within the red box, so I remain bullish on the stock market.
Oddly, this week’s best performing stock index, the XAU, which closed at a new all high on Wednesday, to then close the week at the absolute bottom of this list, all the way down at #21. What happened this week with the precious metal miners? The XAU saw excellent gains Monday through Wednesday, each day closing at a new all-time high. Then came Friday, where it closed the week with a BEV of -15.25%, a one-day loss of around 12%.
Geeze Louise, the XAU is now below its BEV -15% line, and got there in a single day! Should we begin selling our gold and silver mining shares? I think investors should do whatever it takes to get a good night’s sleep. But the XAU, as is also true with gold and silver, are special circumstances in the market. For decades, their valuations were manhandled downward. Then beginning in 2025, they have begun breaking out from those many decades of abnormally low valuations.
So, as far as the gold and silver miners go, if I were to do anything, I’d be increasing my positions at these lower prices. I’m fully invested already, so I don’t have the money to do that. But if I had some cash on the side, this is a good time to be buying precious-metal assets. And don’t be surprised should the XAU become cheaper in the weeks to come, the lower these mining companies go, the better values they offer investors.
When the current bull market in the stock market began in August 1982, in the years that followed, there were pullbacks in the market, just as we saw this week in the XAU. They proved to be buying opportunities, not reasons to exit the market at a loss. That is how things go, early in any bull market.
Keep in mind; gold, silver and their miners have always been volatile markets. This week we saw a big down day. Stay calm, and invested, and before 2026 is over, you’ll enjoy a few more big days of volatility – to the upside.
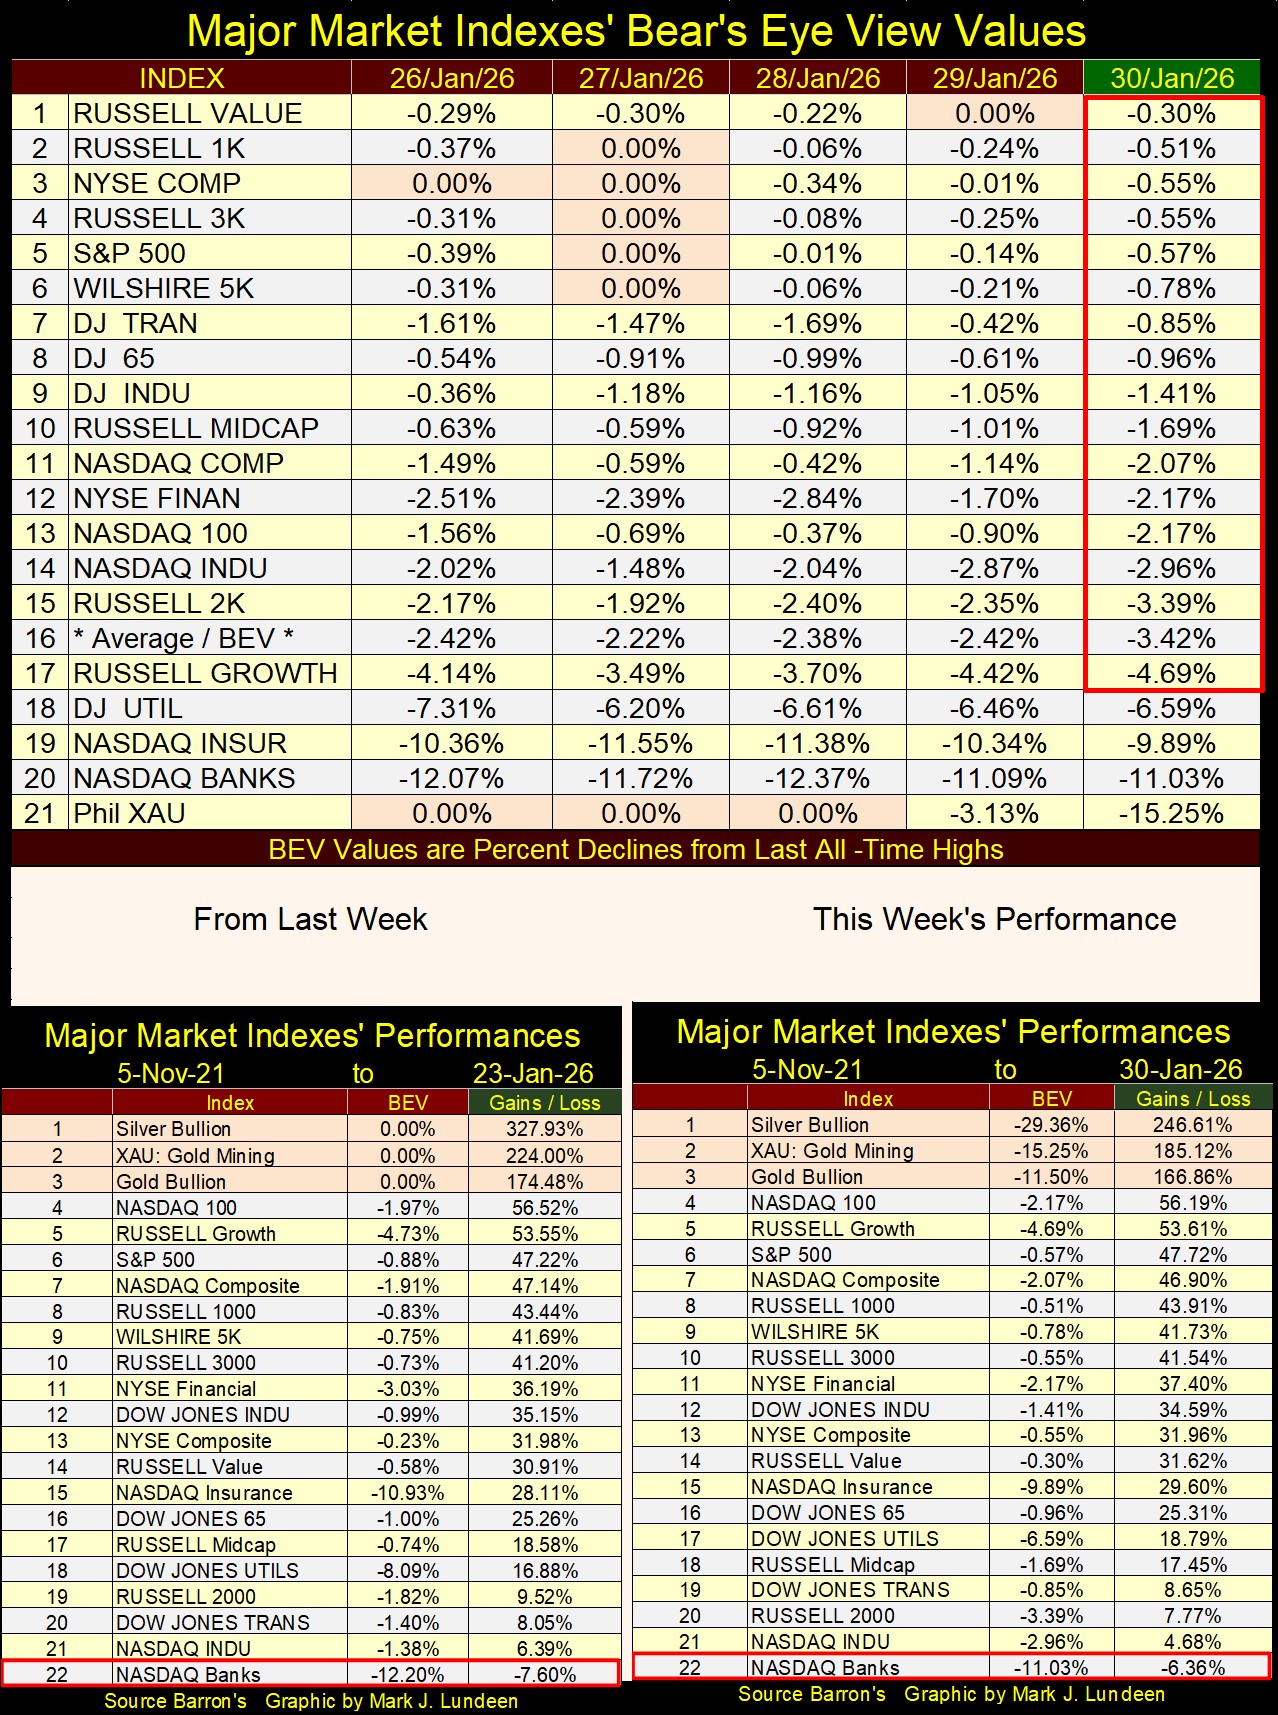
Looking at this week’s performance table above, puts the market into its proper perspective. In the top three spots are silver, the XAU, and gold itself at #3, all far above anything else in the market.
* THE TEXT BELOW WAS WRITTEN ON THURSDAY NIGHT *
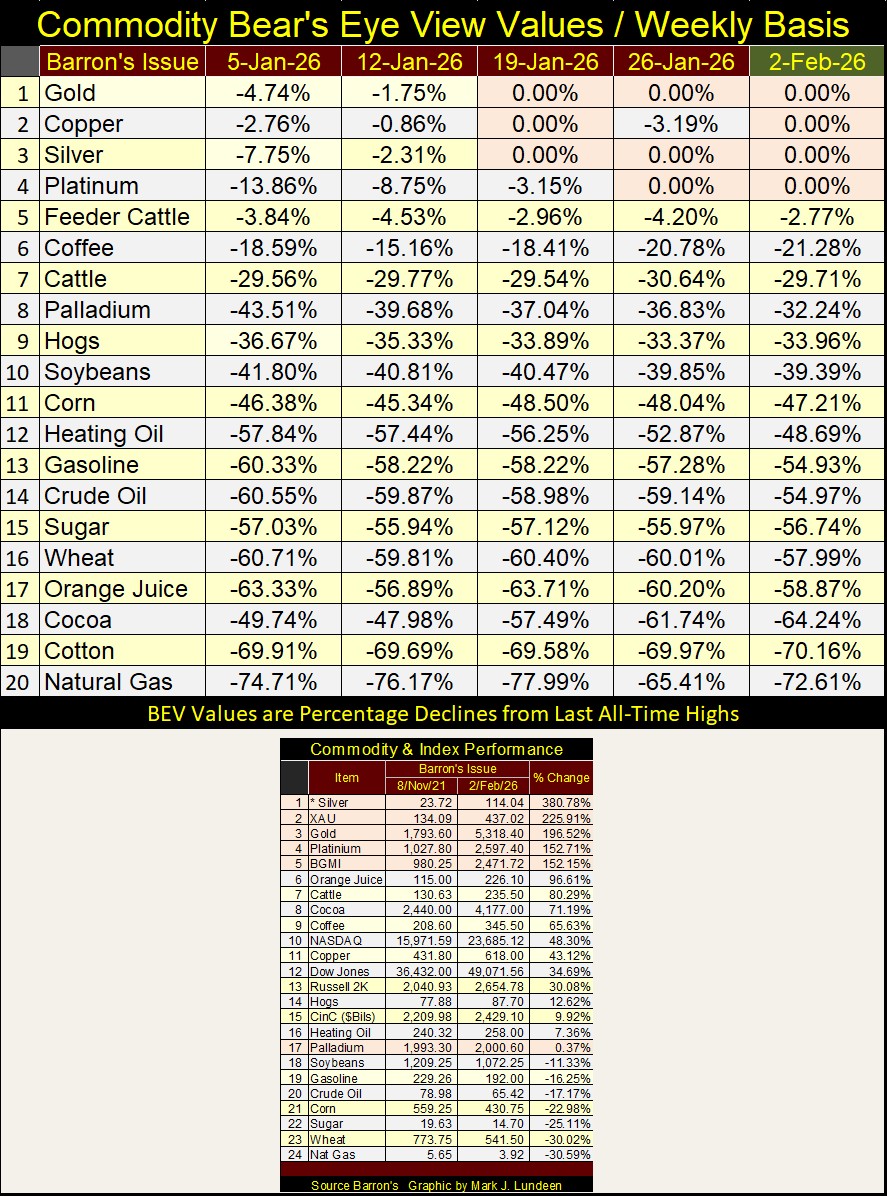
I was going through my file on weekly commodity prices, where a Bear’s Eye View (BEV) table for commodity prices popped into view. I hadn’t used it since 2021, so this seems like a good week to update, and publish again.
What are the BEV values shown below? Like the BEV values seen above for my major stock market indexes, they are the percentage decline these commodities has seen from their last all-time high, or BEV Zeros. Why call all-time highs “BEV Zeros?” Because in BEV series, all-time highs register as 0.00%, or zero percent from its last all-time high.
This week, the commodities I follow saw a few BEV Zeros, highlighted below in pink. The old monetary metals; gold and silver, as well as copper and platinum, in the top four spots. Palladium closed on Thursday at #8 in the table, with a BEV value of -32.24%, or down 32.24% from its last all-time high.
The only agricultural commodity that closed on Thursday (the day I compile my data) near to their last all-time high was Feeder Cattle (#5), only 2.77% from its last all-time high. That seems odd to this city boy, as Cattle proper (#7), closed Thursday, 29.71% below its last all-time high.
Energy prices are far from their last all-time highs in the BEV Table below. From #12 to #14, heating oil, gasoline, and crude oil itself closed this week about half way below their last all-time highs, and natural gas (#20) came in at the bottom of the table, 72.61% from its last all-time high.
If consumer price inflation (CPI) has become a problem once again, and it has, a quick look at the data in the BEV Table below, proves it’s not the farmers or the energy producers benefitting from consumer prices increasing to new all-time highs.
In the performance table above, the top five spots are all precious metals, or their miners. Silver, the perpetual loser for many decades, took top spot in the table.
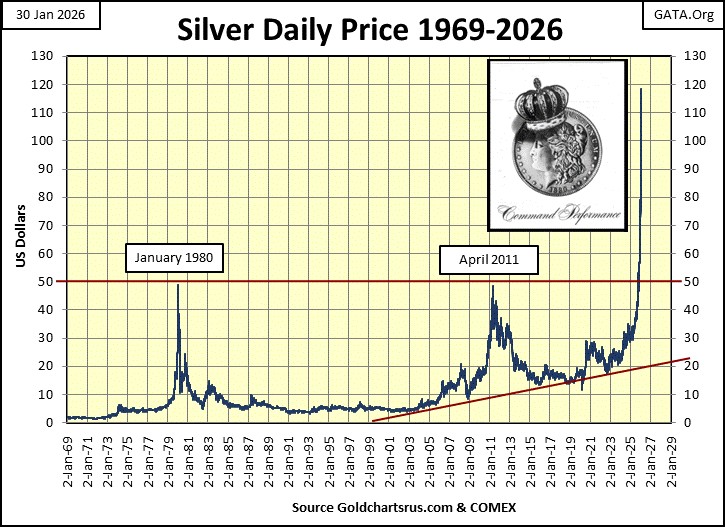
The price of silver, plotted below, tells an amazing story. Its all-time highs of January 1980, weren’t exceeded until last year; October 8th,2025. For the two decades following January 1980, silver traded 80% to over 90% below its highs of January 1980.
In April 2011, silver attempted to break above its highs of January 1980, but fell short by pennies, before its price collapsed by 70%, for a decade. In August 2020, silver picked itself up off the floor, and began trending upward, before it began the moon-shot seen below. From $30 an ounce last January, to $118 an ounce on Wednesday this week, a one-year, uncorrected advance of 293%.
What is seen below didn’t happen all by itself. The many decades of horrendous market performance, not seen since the depressing 1930s. Actually, market performance for silver from January 1980 to January 2025 is many times worse than anything the stock market saw during any forty-five-year sample for the Dow Jones. So why did silver, a commodity with growing demand, and shrinking above ground stockpiles, do so poorly for so many decades?
Note; the silver reserves the US Treasury held in 1965, were completely exhausted in 2002. Billions of ounces of silver no longer available for the market.
When I think of the billions-of-dollars of fraud now being uncovered in Minnesota, thief of Federal and State tax money that must have been known by Minnesota’s elected and unelected officials, and I’m sure the same is true for other states, and the Federal Government itself, I’m thinking my life has been spent during an era of massive government fraud. How to best explain what silver has done since 1980, must have a huge component of fraud attached to it.
And then there is the US National Debt, plotted below.
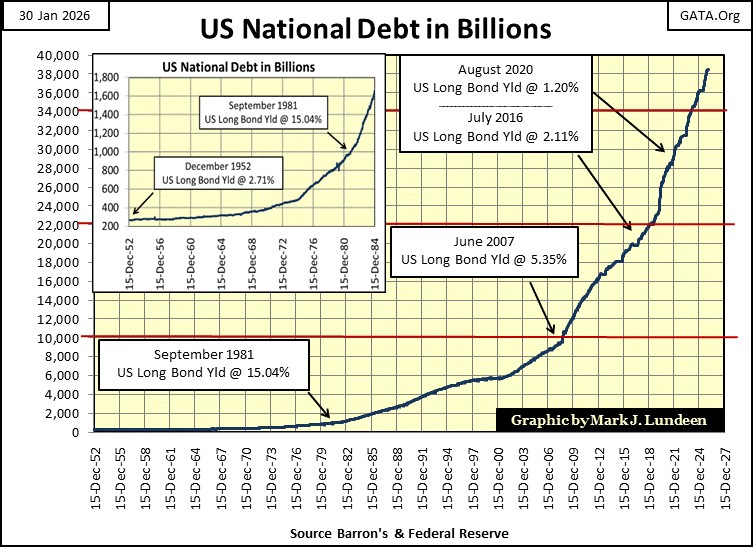
The growth in government debt seen above, and massive increases in the supply of dollars since August 1971, is shocking. I find it very difficult believing gold and silver, today only trading for $5318, and $114, are at their market tops.
* TEXT WRITTEN BELOW WERE WRITTEN ON FRIDAY NIGHT *
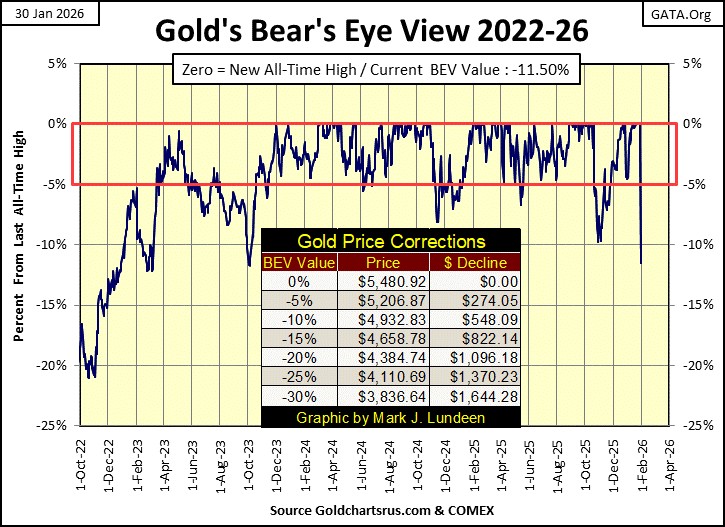
Why I noted what I wrote on Thursday, and Friday night can be seen below. I placed a red circle on Friday’s close, gold saw a one day percentage decline not seen since 1983. A one-day decline of 9.69% from the previous day’s closing price, a daily decline not seen for over forty years. Okay, but is that something bad or good for the current advance in gold?
We have to examine the chart to see what is actually happening. In the chart below, volatility comes in clusters, clusters where gold sees both large daily percentage advances and declines. Bull markets don’t only see days of extreme volatility to the upside, days were gold advances 3% and more. And bear markets don’t only see days of extreme volatility to the downside, days where gold declines 3% or more, such as today’s 9.69% decline.
These clusters of extreme volatility come when “liquidity” flows into the gold markets, or bull markets, or when “liquidity” flows out of the gold market, or bear markets. I have to ask myself; what has gold been doing this past year? It has been advancing, a whole lot! Does a one-day decline of 9.69% in the price of gold change that? As I understand the gold market, it does not.
Keep in mind, I can’t see into the future. Like everyone else, I don’t actually know what tomorrow will bring us. My only insight into the future, comes from studying the past, as seen in the chart below.
Seeing this very significant market event, a day of extreme volatility that took the price of gold down by 9.69%, in a single day, strongly suggests to me, the bull market in gold, is possibly entering a new, more energetic phase.
In the weeks and months to come, I’m expecting this cluster of extreme days of volatility, negative and positive days, will expand as 2026 progresses. And I’m expecting that will ultimately benefit the price of gold. Is that so? I’ll tell you all about it, come this July.
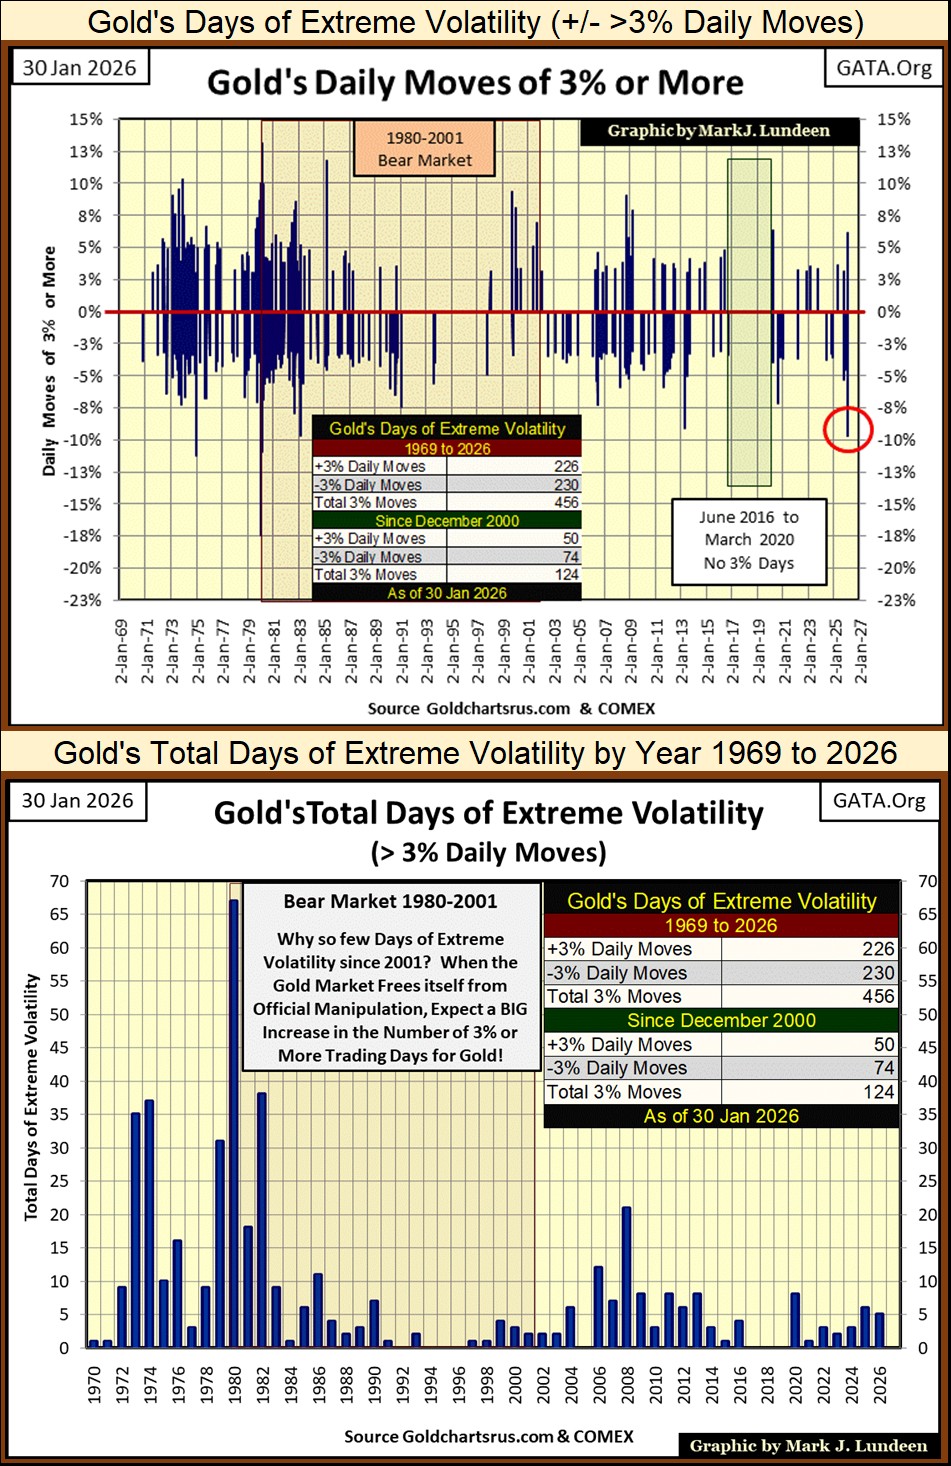
Looking at total days of extreme volatility for gold, by year in the chart above, so far in 2026, gold has seen five days of extreme volatility, just in January.
In 2025, gold had seen only six days of extreme volatility. Are we seeing the beginning of a new phase in the gold bull market? I’m thinking that. So, hold on to your hats, as the bull market in gold is going to do his best to knock all the rookie cowboys off of his back. Those people who like to buy their gold when prices are high, then sell when the market pulls back 10% or so.
Geeze Louise! Silver saw an extreme day of volatility, what I call a “5% day,” a one-day decline of 27.5%! Looking at the chart below, this is a daily decline not seen since the early days of the 1980 – 2002 bear market in silver.
What I said above for gold, is the same for silver below. Gold and silver in the weeks to come, may see additional extreme days, both to the up and downside. How much lower could gold and silver go before they recover in the weeks to come, I can’t say anything with certainty.
They may see some additional large daily declines in the next few weeks. Then maybe, Friday’s closing prices are the bottom of their correction, and the next few large daily percentage moves will be to the upsides. But by March or April, I expect these markets will resume their advance, possibly with more vigor than they displayed in December and January.
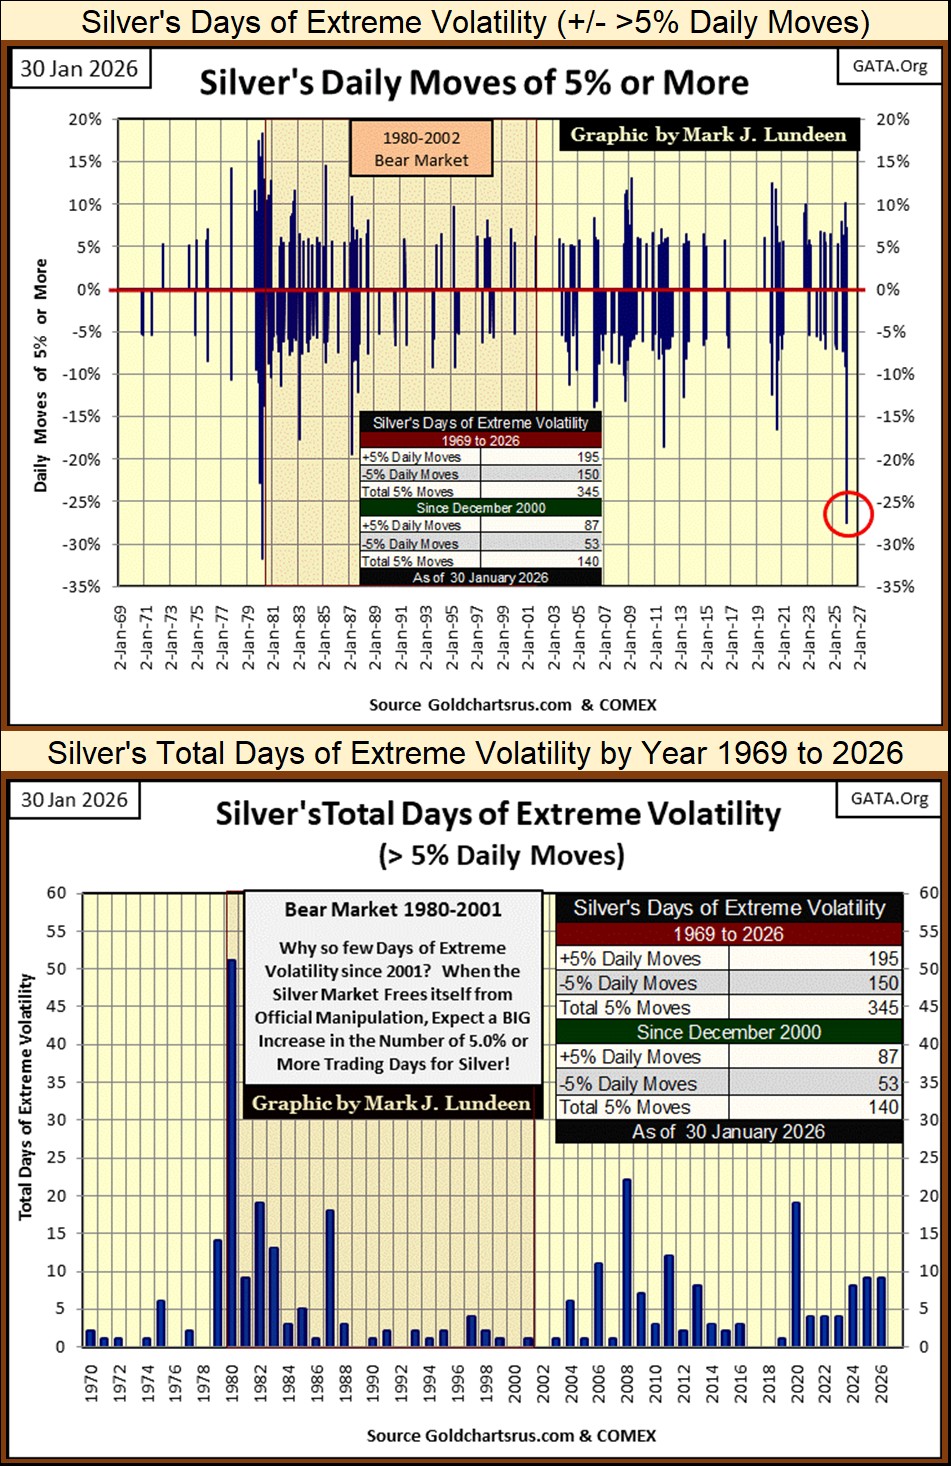
So far in 2026, silver has seen nine days of extreme volatility, silver’s 5% days. As many as 2025 saw in total. Silver, and gold are markets pregnant with possibility. Keep in mind, no government, or central bank on planet Earth, wants to see gold and silver rising to who knows where in the year to come.
Their gains seen since January 2025, were unauthorized by those who dictate “global monetary policy,” those who publish with ink on paper, what today is called money. Paper money does only one thing really well; losing value from one year to the next. Economists and “market experts” call it consumer price inflation, but rising prices through out the economy are due to one thing, and one thing only; paper money issued by governments.
Think of the amazing gains gold and silver, the old monetary metals have seen in the past year, as gold and silver catching up to a half century of monetary inflation governments, and their central bankers have inflicted upon their citizens and economies.
For these people, seeing the old monetary metals rise as they have in the past year, is a failing grade for their “monetary policies.”
Expect a growing, and public struggle between gold, silver, governments, and their central bankers in 2026. Fridays big market declines for gold and silver may have been the “policy makers” first shot fired at gold and silver in this war. It won’t be their last. But this is a war they can’t win. So, I’m remaining bullish on gold and silver.
Looking at gold and silver in their indexed chart below, we don’t see Friday’s decline, as they rest on the rises the metals have seen in 2025. But, looking at the text box I placed in the upper left-hand corner of the chart, gold declined from 125 to 111, from Wednesday’s last all-time high, to Friday’s close. Silver closed from 64 on Wednesday’s last all-time high, to 45, that is a huge drop.
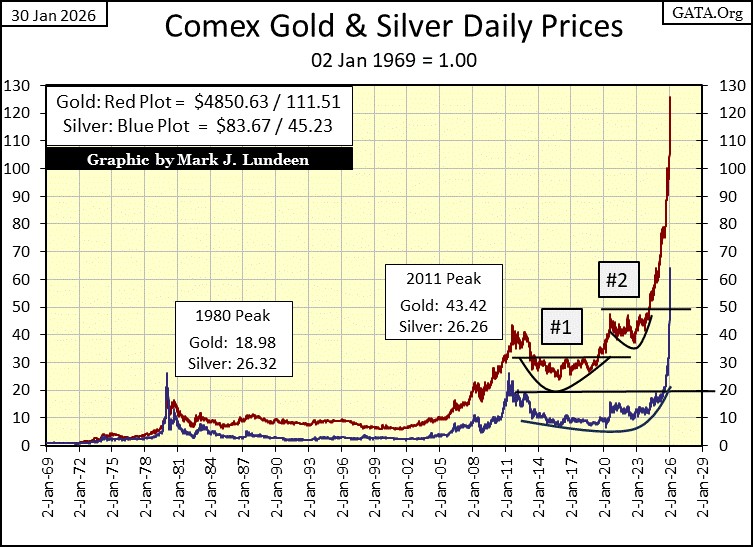
Since November, I’ve wondered when this amazing advance in gold and silver would see a correction, a market pullback of 20% to 30%. Now I know, on the last trading-day of January. Look at these amazing advances in the chart above.
These are not normal advances seen above. Something very wrong is brewing below the surface of these markets, providing the driving force beneath gold and silver’s current advance. We are a long way before we see the end of this bull market in gold and silver, years.
On Wednesday, gold saw its 100th new all-time high since it entered scoring position in November 2023. Then came Friday. Let’s see what next week does with gold’s BEV chart below. Does it trend towards the BEV -15% line, or the BEV -5% line?
I’m not predicting this; but it would take only one day of positive extreme volatility, for gold to close in scoring position again by next Friday. But then, what would a couple days of negative extreme volatility do to gold’s BEV chart below? I’ll tell you all about it – next week.
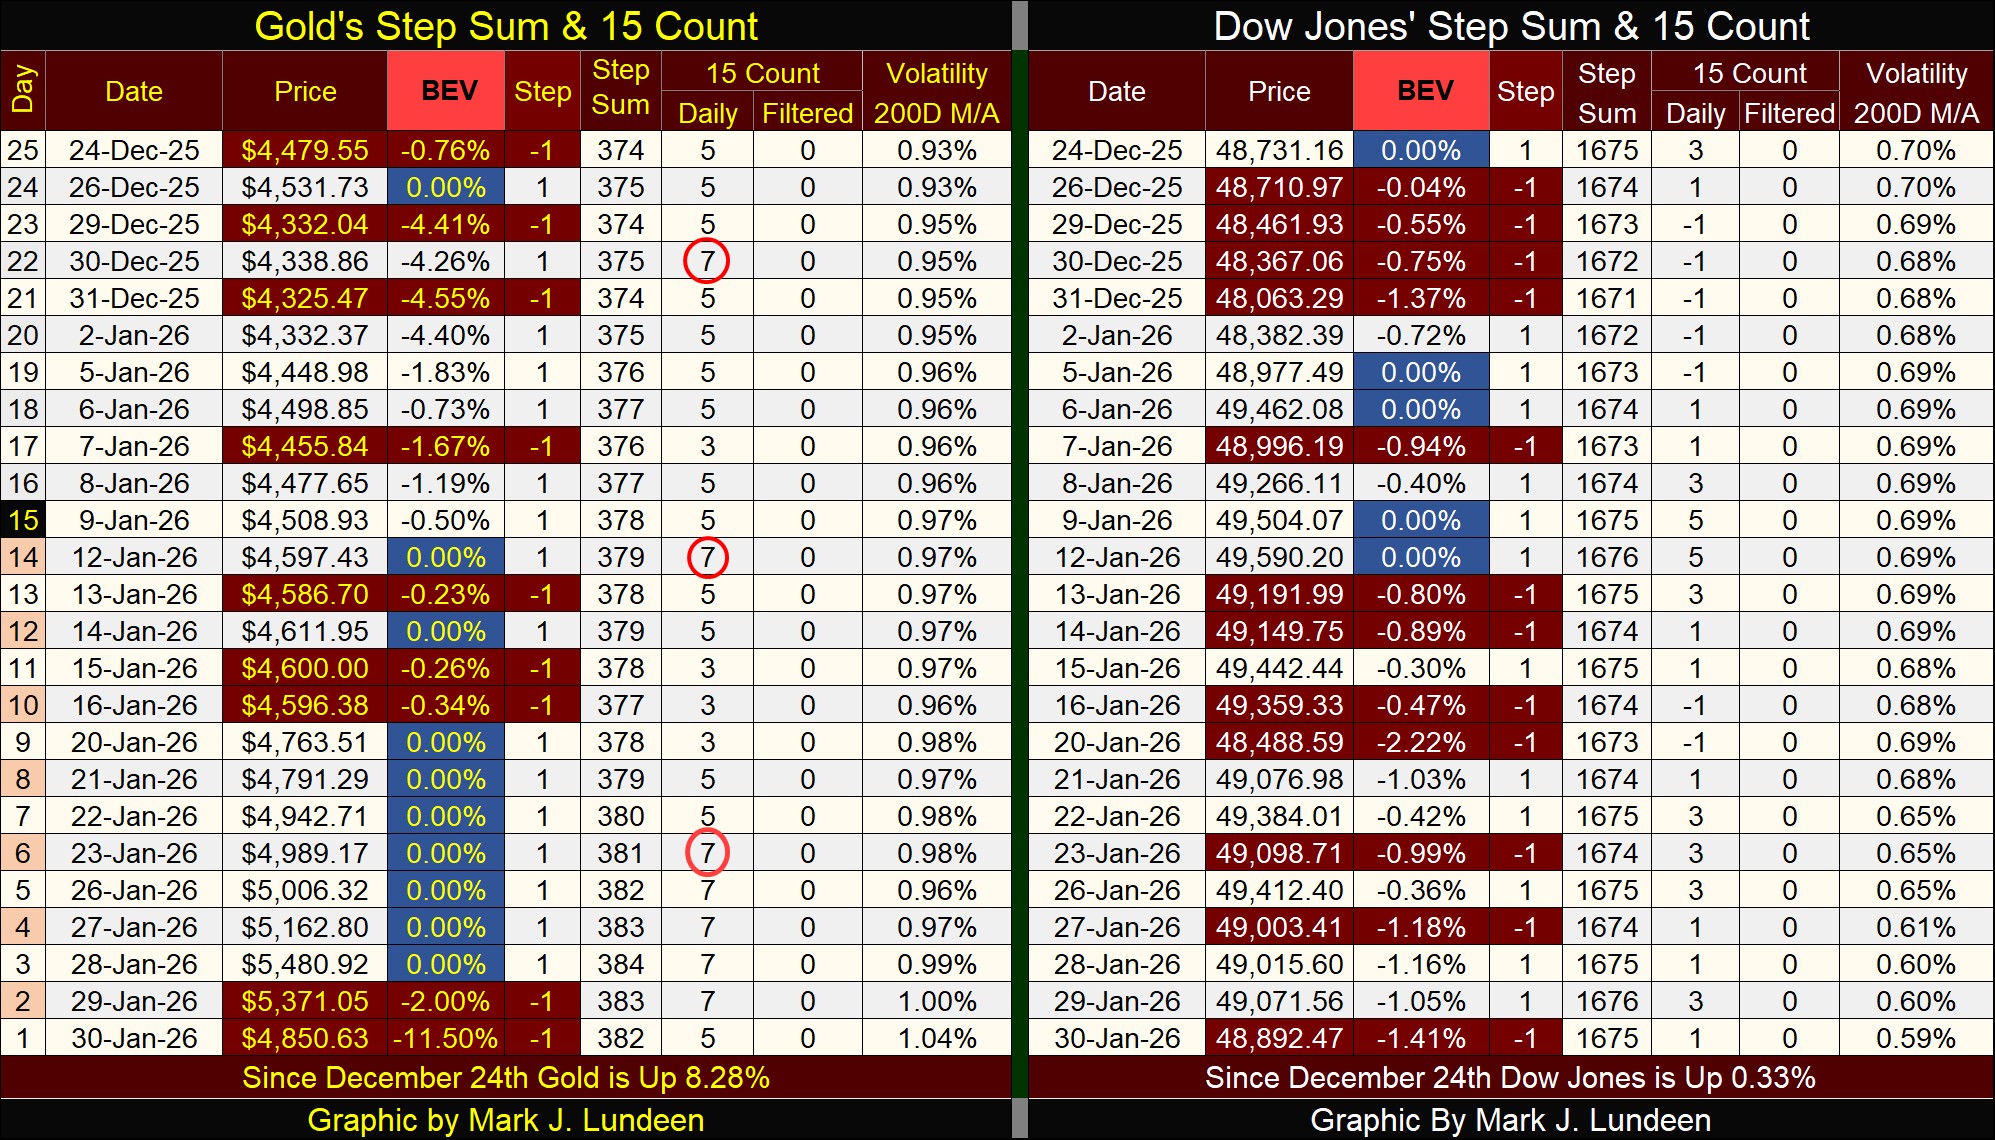
Looking at gold step sum table below, it becomes obvious that the gold market was at a short-term market top. Since the end of December, gold saw ten new all-time highs, with a block of seven BEV Zeros in a row. Something like that happens once in a decade, if you are lucky. Daily advances overwhelmed daily declines for the past twenty-five trading days. And even with Friday’s big decline, since December 24th, gold is still up 8.28%.
Like the ocean’s tides, there is an ebb and flow to the markets. Times when daily declines overwhelm daily advances, followed by times where daily advances overwhelm daily declines.
Looking at gold’s step sum table below, it’s apparent that gold is due for a time when daily declines will once again overwhelm daily advances. That doesn’t mean the price of gold is due for further deep declines. Look at the Dow Jones below. Daily declines have overwhelmed daily advances since Christmas, still January has generated BEV Zeros, and this week, the Dow Jones closed well within scoring position.
February 2026, has the makings to become a very interesting month for the markets.
Eskay Mining has a new video available to shareholders, and people interested in junior exploration companies, posted below. I skipped the first few minutes of the video, as it covered past years, and I wanted to get up to where Mac Balkam, Eskay Mining’s CEO, began to discuss the company, and its plans for next summer’s exploration program.
https://youtu.be/F-cZq_XhJwo?t=771
Mark J. Lundeen
*******
More from Gold-Eagle


