Metals’ Mania Maxed!


But is the mayhem yet done? Now obviously no one knows for sure if this recent metals’ mania just hit its maximum price point. So ’tis prudent to understand that superlatives such as “Maxed!” can further be “Maxed!”
“Yeah mmb, but for gold you totally nailed it!”
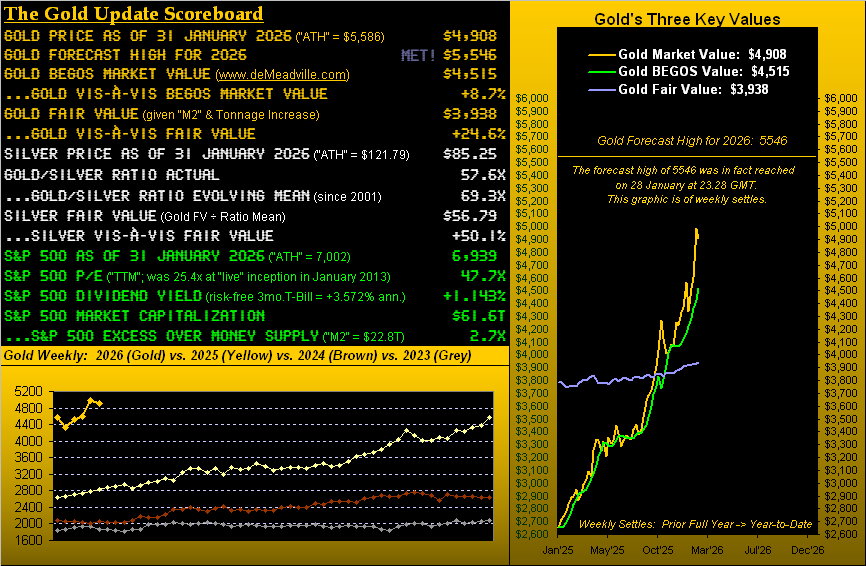
Most kind, Sir Squire, albeit again let’s temper this as possibly premature. Yes, 28 minutes into last Thursday’s session, Gold achieved our year’s forecast high of 5546, further following-through to 5586 (5627 basis April). And that was it.
Through the balance of the week’s past two trading days, Gold went on to decline by as much -15.9% to Friday’s low of 4700, toward settling the week yesterday at 4908. And “premature” to be sure is acknowledging the year’s high so far of 5586 as being “it” with 11 months still in 2026’s balance. But Gold — at least for the present — is unwinding back to reality, even as it remains fundamentally overvalued. For per the above opening Gold Scoreboard, price today at 4908 is +8.7% above its BEGOS Market Value (4515 via the intra-relative movements of the Bond, Euro, Gold, Oil and S&P 500), let alone +24.6% above its Fair Value (3938 via Dollar debasement as countered by Gold’s own supply increase).
“And silver got creamed, mmb!”
Squire, our dear Sister Silver, bless her, is in the I.C.U.
From her record high on Thursday at 121.79, she comprehensively plunged into week’s-end by as much as -39.2% (to 74.00) in settling yesterday at 85.25, an all-in net loss for the week of -17.4% versus that for Gold of just -1.5%; (too, Gold intra-week gained +39 points of premium in rolling from the February contract into that for April).
But specific to poor ol’ Sister Silver: you very long-time readers of The Gold Update going back well over a decade may recall the noted analyst in the psychosis of precious metals, Dr. Youara Nichtsogut of Salzburg, who earlier this morning visited Silver in the I.C.U. The good doctor says the trauma through which Silver suffered yesterday — her intra-day high-to-low drop being a single-session record of -37.5% — shan’t have permanent damage; but her recovery is likely to be very lengthy.
Indeed in again referencing the above Scoreboard, Silver today at 85.25 remains considerably overvalued at +50.1% above her Fair Value (56.79). We asked Dr. Nichtsogut if any accelerative medicinal measure might be taken, to which she replied: “Vell, liebling, zee inevitable double of zee money supply, zat vill do it, ya”. (She’s a winner).
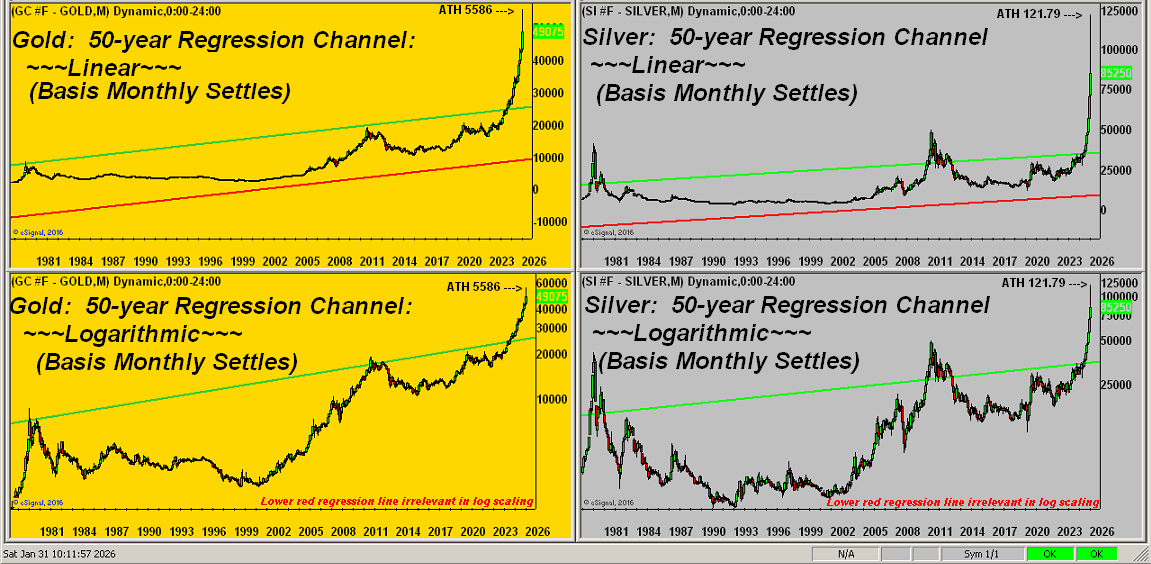
Regardless, through many a recent missive — as pro-Gold as we are — ’tis been pointed out time-and-time again that the precious metals were becoming significantly strained to the upside. Have a glance at this next four-panel graphic featuring Gold and Silver — both linearly and logarithmically — vis-à-vis their respective 50-year regression channels. How’s that for a “Whoopsie!”
‘Course, the “sad” part (if you will) lies with all the newly-minted Gold experts having recently sprung up like “jack-in-the-boxes”. Now given their sudden wound-licking, ‘twouldn’t surprise us a wit for Sister Silver whilst in hospital to get some company.
All that said, despite Gold on Friday giving up seven days of gains — and Silver 23 days — it being month-end ’tis time to present the early year-to-date BEGOS Markets’ standings, with our dear “patient” actually atop the table, (if not that for surgery):
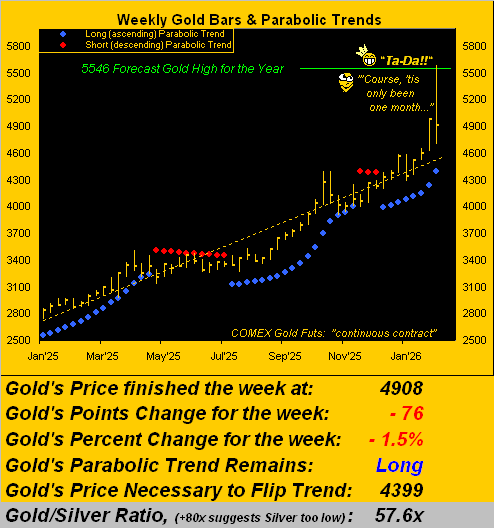
Next to Gold’s weekly bars we go, from one year ago-to-date. And notwithstanding yesterday’s record intra-day plunge (-14.2%), Gold now at 4908 still is +509 points above the parabolic “flip-to-Short” level of 4399. ‘Course, range has rapidly expanded: by the website, Gold’s EDTR (“expected daily trading range”) is now 218 points, although given Friday’s vast selling, we may see such range begin to narrow as folks (at least those who are still around), pull back a bit from the trading activity:
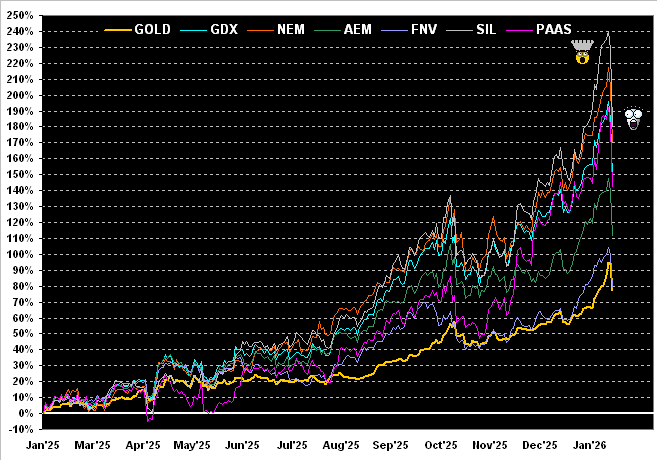
Remaining in the year-over-year mode, here we’ve this chart from our infamous “Live by the Leverage, Die by the Leverage Dept.” featuring the percentage tracks of Gold itself +77%, Franco-Nevada (FNV) +79%, Agnico Eagle Mines (AEM) +111%, Pan American Silver (PAAS) +142%, the VanEck Vectors Gold Miners exchange-traded fund (GDX) +149%, Newmont (NEM) +170%, and the Global X Silver Miners exchange-traded fund (SIL) +180%. Yesterday’s falls make Niagara Falls appear but a trickle:
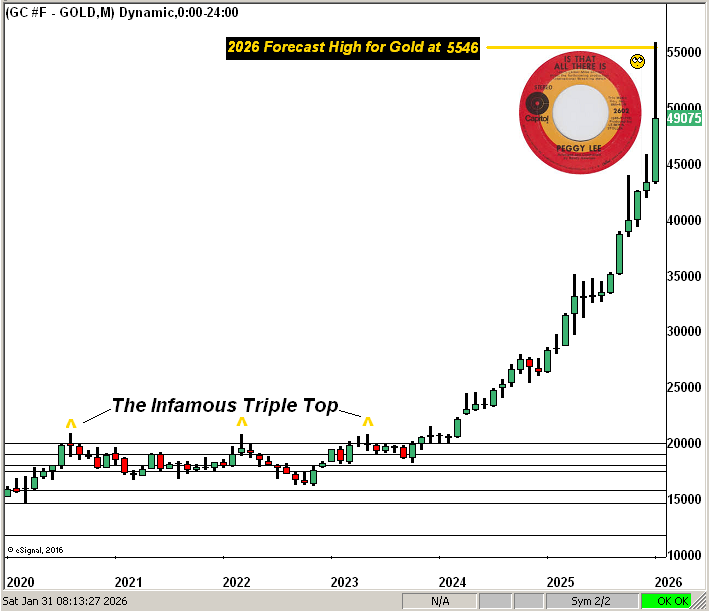
Even more broadly as again ’tis month-end, we’ve our recently revised Gold Structure graphic featuring the Peggy Lee tune crooned back in ’69. Some might consider that tall “wick” on the rightmost January candle as “technical damage” given there is arguably a dearth of monthly structural support until the 3500 area; (but’s let’s not go there, please):
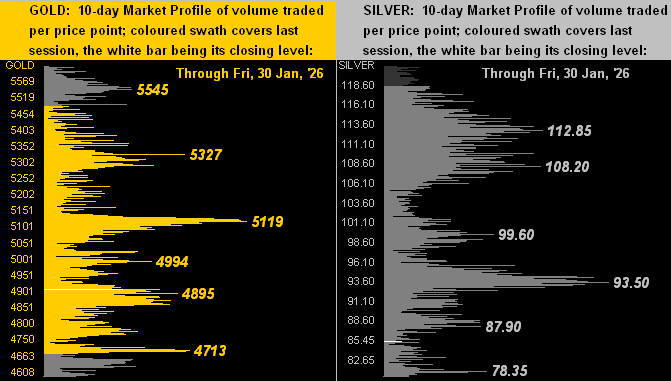
From the broad-term past to the near-term now we’ve the 10-day Market Profiles for Gold on the left and Silver on the right. And the pre-fallout low-to-high tracings are remarkable, respectively at +23% for Gold and for Silver a stunning +62% just in ten trading days! In both panels we’ve selectively labeled prominent volume-dominant price levels. And the barely visible wee white line for each market is Friday’s settle:
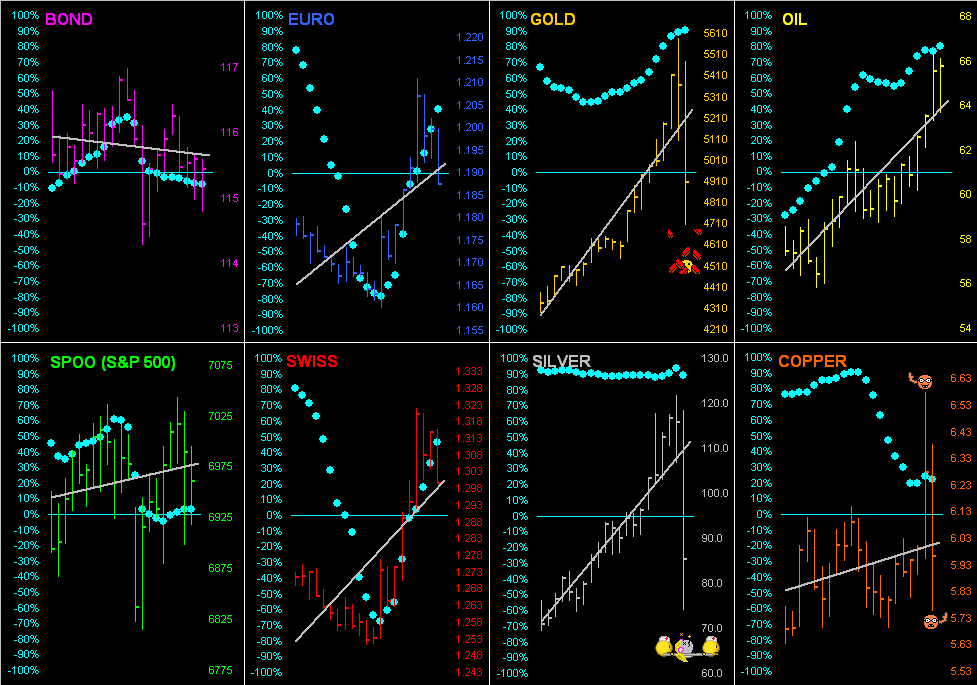
For the BEGOS Markets as a whole across the past 21 trading days (one month), here we go ’round the horn for all eight components with their diagonal grey regression trendlines and baby blue dots depicting the day-to-day consistency of each trend. And not to be left out of the tumbling Metals Triumvirate, along with the yellow and white metals, so did the red see its price shred, Copper therein high-to-low losing -13.7% of its value. Metals’ mania mayhem, indeed!
Meanwhile through the midst of it all, the S&P 500 — despite marginally flirting above a record 7000 for 26 minutes on Wednesday — hasn’t really moved about to any material extent. Again by the deMeadville Market Ranges page, of the eight BEGOS markets, the S&P and the Bond are the most subdued of the bunch. As expected, the Federal Open Market Committee voted (albeit not unanimously) to maintain the interest rate on FedFunds in the 3.50%-3.75% target range. Too, Q4 Earnings Season (with about one-third of S&P constituents having reported) is running at an above average year-over-year improvement pace. And the Economic Barometer is continuing to climb upward. Thus, geo-politics and a FedChair pick aside, there’s not really that much goin’ on out there. And specific to the Econ Baro, of the past week’s 11 incoming metrics, just two were worse period-over-period. Here’s the one-year view:
Note in the Baro the reference to inflation. Friday {finally} brought wholesale inflation data for December via the Producer Price Index. Both the “headline” and “core” readings came in at five-month highs, respectively annualized at +6.0% and +7.2%, (the 12-month summations being a less daunting +2.6% in each instance). And directly from the first paragraph of the FOMC’s Policy Statement: “Inflation remains somewhat elevated”, that release being two days prior to the PPI report. Fundamentally, that can be construed as a Gold-negative, should the Fed have to reverse rate gears and raise ’em. Either way, in muted response to the FOMC, the net change in the S&P from Wednesday through Friday was just a wee -0.6%. But by our indicatively leading MoneyFlow page, the change “ought have been” -3.1%. As folks later figure that out, a lower S&P near-term is likely. Too, the “live” price/earnings ratio of the S&P remains a “lofty” (kind understatement) 47.7x.
To close, we go to the “Now What? Dept.” Per our title, has the metals’ mania maxed? As stated, the selling into week’s-end was record-setting. Yet certainly so across the past five months had been the buying. And ’tis said that “What goes up must come down” … or at least not ridiculously stray from valuation. So as to near-term direction, mind near-term trends for protection. For the moment (as these always are evolving), our best pure swing Market Rhythm for Gold is its 30-minute MoneyFlow, and for Silver her four-hour Price Oscillator. (Do try not to get carried away).
And specific to geo-politically influenced metals’ mania, not only have we in other missives proven (in nauseatingly numerical detail) that such rallies are relatively short-lived with price returning down from whence it came (and then some), but also that regressing a Gold price to geo-politics is absurdly abstract. For at the end of the day, it simply comes down to how much dough (or lack thereof) is there to go ’round, and thus, how much need be printed to make everyone sound. Per the opening Scoreboard, that S&P 500 market capitalization-to-liquid money supply ratio of 2.7x is worrisome. Is your broker liquid?

Now as we prepare to publish, we are learning of disturbing geo-political events this weekend from Gaza to Iran. So should the metals be maxed or otherwise: aren’t you glad you hold Gold?
Cheers!
…m…
www.TheGoldUpdate.com
www.deMeadville.com
and now on “X”: @deMeadvillePro
********

Mark Mead Baillie has had an extensive business career beginning in banking and financial services for two years with Banque Nationale de Paris to corporate research for three years at Barclays Bank and then for six years as an analyst and corporate lender with Société Générale.
For the last 22 years he has expanded his financial expertise by creating his own financial services company, de Meadville International, which comprehensively follows his BEGOS complex of markets (Bond/Euro/Gold/Oil/S&P) and the trading of the futures therein. He is recognized within the financial community of demonstrating creative technical skills that surpass industry standards toward making highly informed market assessments and his work is featured in Merrill Lynch Wealth Management client presentations. He has adapted such skills into becoming the popular author each week of the prolific “The Gold Update” and is known in the financial website community as “mmb” and “deMeadville”.
Mr. Baillie holds a BS in Business from the University of Southern California and an MBA in Finance from Golden Gate University.


