Behold The US Dollar


 The purpose of this article is to illustrate the continuous strength of the US Dollar from back in September 2014 -- and how we are not even at the half way point yet for this current move. The US Dollar Index is thought to be in a bull market for another 5-7 years, so as analysis will show today, the top in the US Dollar appears to be setting up for mid-term top this coming September, rather than November as previously reported.
Currencies
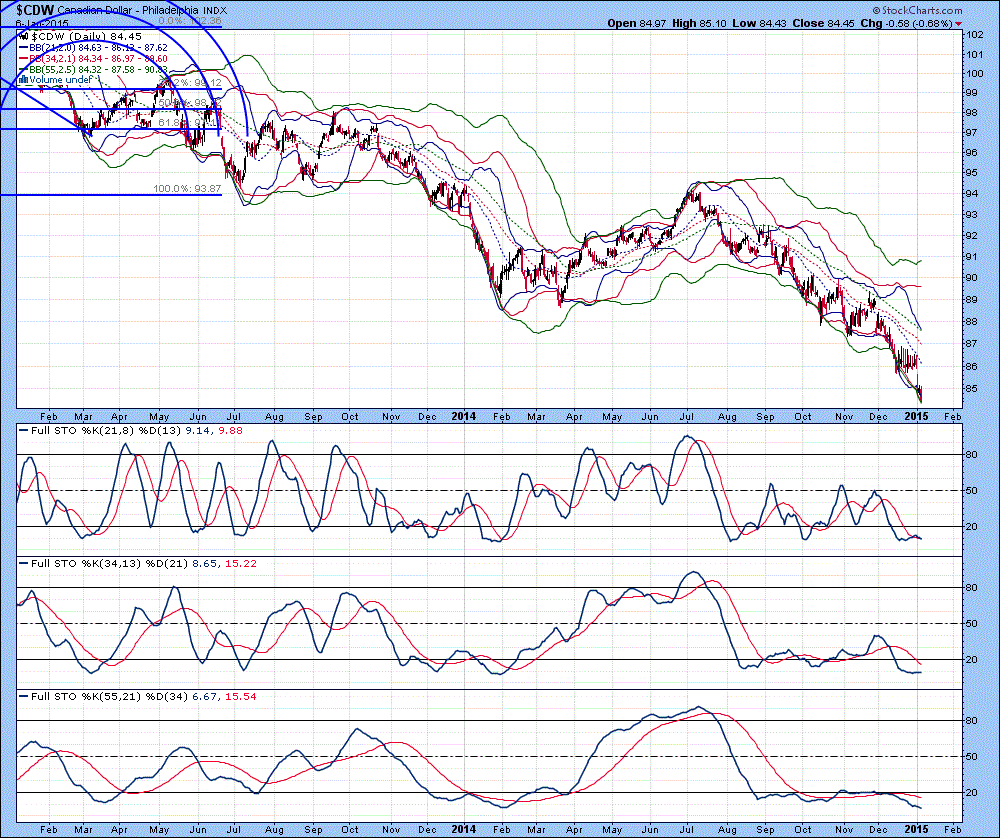
The daily chart of the Canadian Dollar Index is shown below, with the lower 34 MA Bollinger Band® marginally beneath the 55 MA Bollinger Band indicates an oversold condition, albeit, weak. Full stochastics 1, 2 and 3 are shown below in order of descent, with the %K beneath the %D in all three instances. A price excursion beyond the lower 21 MA Bollinger Band for 3 days suggests a short-term oversold condition has been generated. It is really important to realize that the Loonie still is viewed as a Colonial Currency and because of that, weakness in commodities will be reflected in its value relative to the US Dollar. The ultimate low for the Loonie could be back at 63 cents again towards 2020, but the Intermediate term low is expected around 77 cents towards the end of this year. I do want to stress however, that if the US Dollar continues to exert strength above 92.0 (I originally thought it would remain below this level until mid to late March) then the 77 cent target could be reached sooner rather than later.
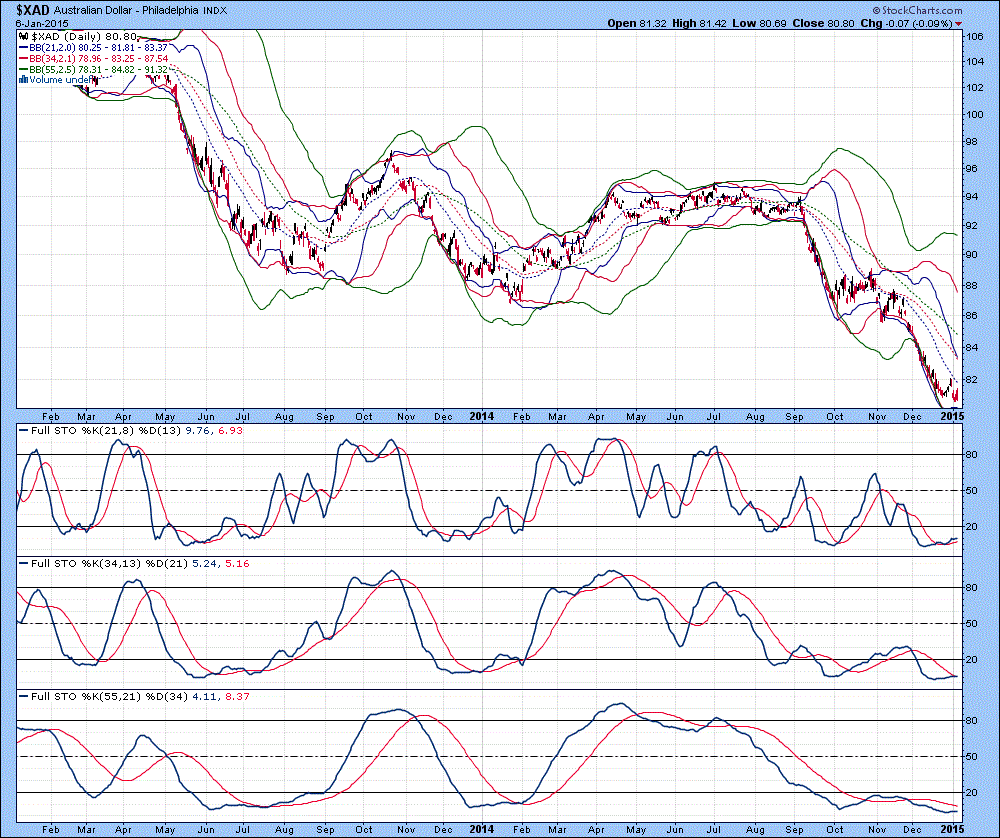
The daily chart of the Australian Dollar Index is shown below, with all lower Bollinger Bands in their proper order of alignment indicates no oversold or overbought condition exists. Full stochastics 1, 2 and 3 are shown below in order of descent, with the %K beneath the %D in 1 and 3 and marginally beneath the %D in 2. If the Aussie Dollar can maintain a trading range between 81.5 and 82.0 cents for another week, then lower Bollinger Bands would decline further to indicate that a short-term bottom was put in place. As per the Loonie, the Australian Dollar is likely to continue to remain weak (even weaker) as long as commodities remain under pressure as a whole.
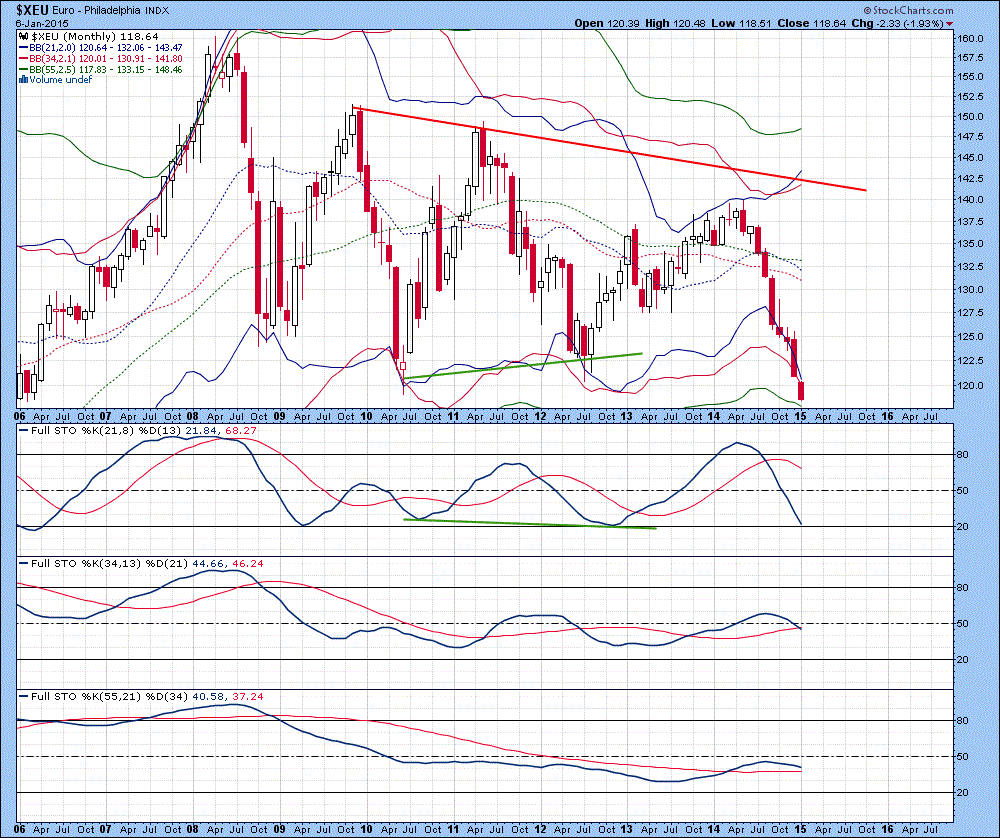
The monthly chart of the Euro Index is shown below, which represents the most important currency to examine, as it represents some 57% of the US Dollar Index basket of currencies. Triple support at 122.0 has been taken out, which was the “Kiss of Death”. There is now the setup for a move down to 100 at a minimum. All three upper Bollinger Bands have curled up, with the upper 21 MA Bollinger Band noticeably above the 34 MA Bollinger Band indicates an overbought condition still remains in effect. A price excursion beyond the lower 21 MA Bollinger Band has been in effect for 5 months now and indicates an oversold condition is developing alongside the overbought condition. These two factors are balancing each other out amidst weakness, which is likely to see only lower levels for most of this year. The minimum downside target in the Euro is 110-112, but if 110.0 is taken out on a weekly basis, it will decline to 100. Full stochastics 1, 2 and 3 are shown below in order of descent, with the %K beneath the %D in 1 and 2 and above the %D in 3. With a top in 2008 and nothing but lower highs until 2014 before breaking through 5 years of support, the decline ahead is likely to be just as severe as what was witnessed in 2014…avoid the Euro because more and more money from around the globe is going to pour into US Dollars to try and preserve value.
US Dollar Index
The daily chart of the US Dollar Index is shown below, with the upper 21 MA Bollinger Band above the 34 MA Bollinger Band for nearly 3 weeks indicates an overbought condition continues to remain in effect. Price excursions above the 21 MA Bollinger Band for 3 days further indicates an overbought condition is developing. Full stochastics 1, 2 and 3 are shown below in order of descent, with the %K above the %D in all three instances. Strong support for the US Dollar lies between 89.0 and 89.5 cents.
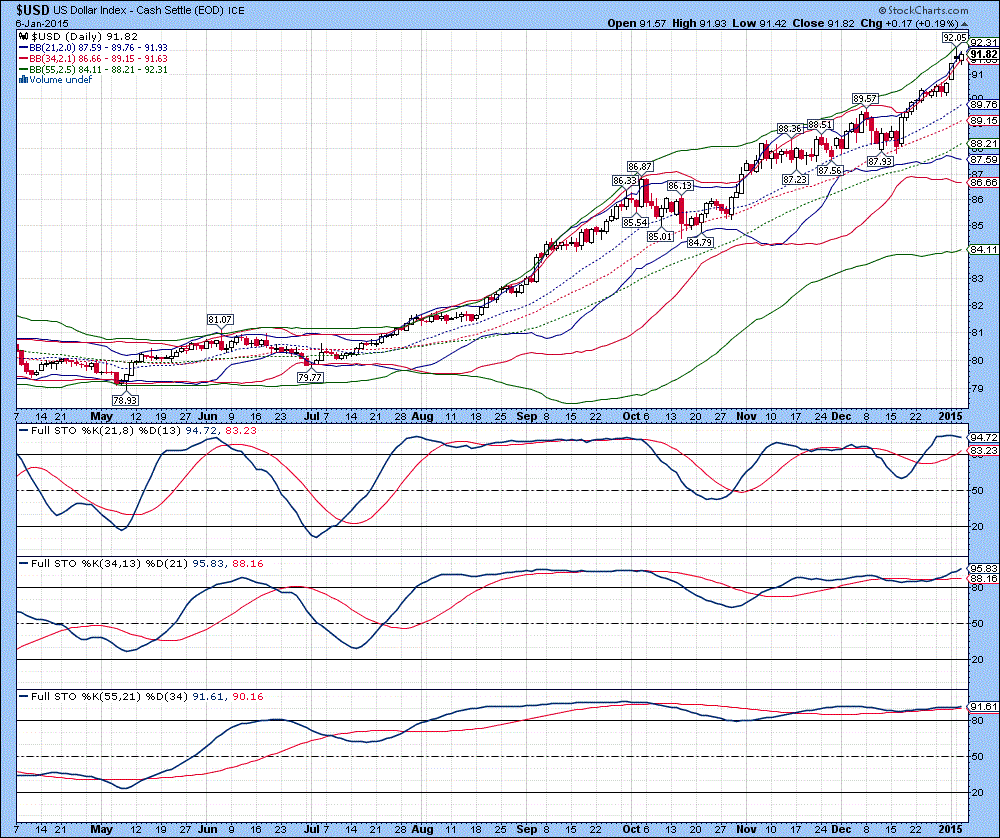
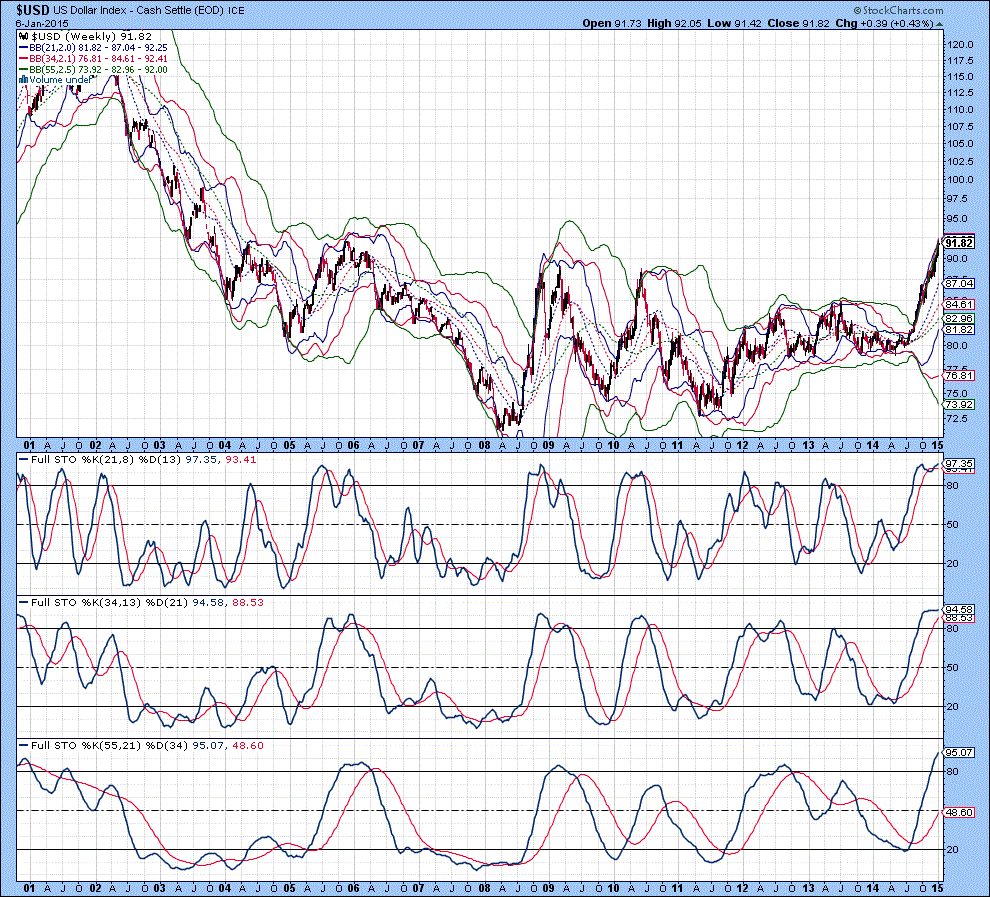
The weekly chart of the US Dollar Index is shown below, with the upper 21 MA Bollinger Band above the 55 MA Bollinger Band and the 34 MA Bollinger Band above the 55 MA Bollinger Band indicates an overbought condition continues to develop. The lower 55 MA Bollinger Band has yet to curl up and when it does, it should indicate a mid-term top. Full stochastics 1, 2 and 3 are shown below in order of descent, with the %K above the %D in all three instances. This is the most overbought the US Dollar has been in the past 14 years, but then again, the Euro is set to decline another 20 cents, which really adds pressure to extend this overbought condition. I remain invested in US stocks within my pension, as this move alone should preserve capital value by another 10% at a minimum.
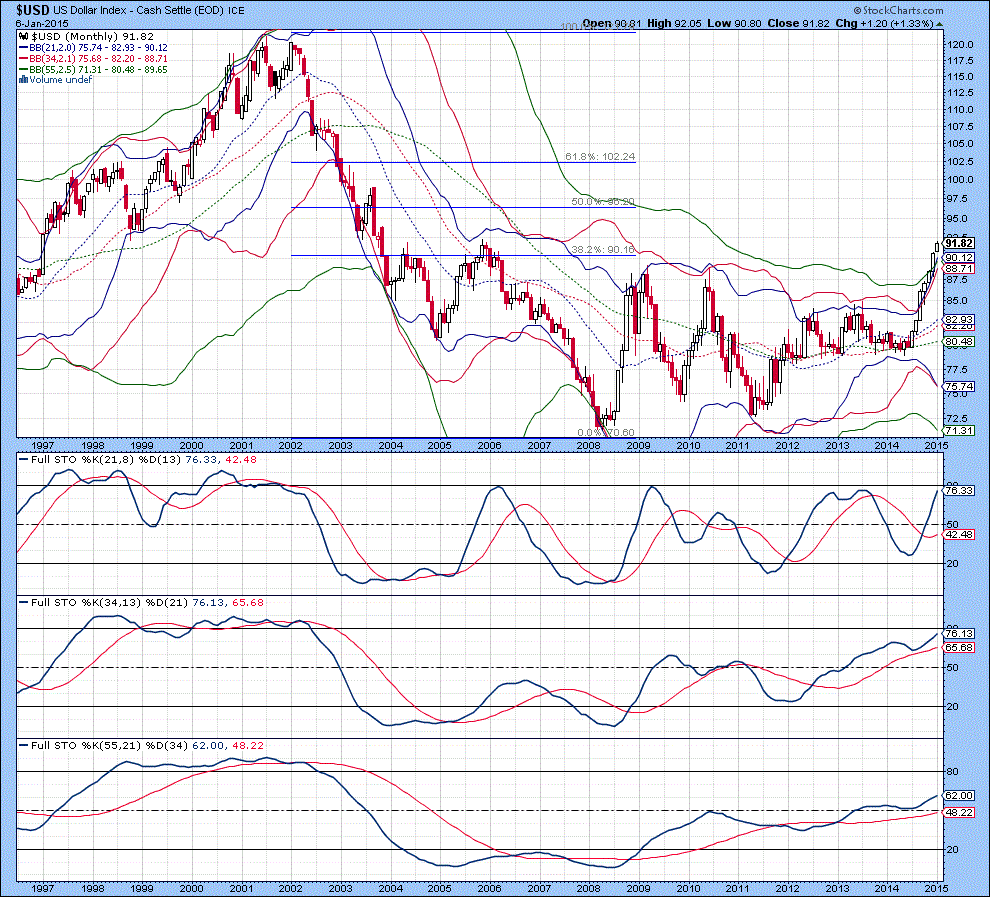
The monthly chart of the US Dollar Index is shown below, which represents the “Money Chart” out of everything covered in this update. The upper 21 MA Bollinger Band is above the 34 and 55 MA Bollinger Bands, and the 34 MA Bollinger Band is above the 55 MA Bollinger Band, indicating an extremely overbought condition continues to develop. Huge price excursions are now entering the second month, which suggests at least a pause in the trend for 2-3 months before moving higher…this would occur in normally trending markets, but we all could be very surprised with what happens (I had the US Dollar at 92.0 near the end of March to complete a rising correction, not 2.5 months early!!!!!). And probably the most important point to note for this chart is that all three lower Bollinger Bands continue to curl down and this is with a rising trend unlike the 2008 situation. Until the lower 34 and 55 MA Bollinger Bands curl up, there is no indication of any sort of a top being put in place. From the current point in time, any sort of a top is at least 10-12 months out and that is at a minimum. Based upon this one observation alone, it spells a much higher US Dollar towards the back end of 2015. Full stochastics 1, 2 and 3 are shown below in order of descent, with the %K above the %D in all three instances. Stochastics confirm another 9-12 months of further upside, so with both technical indicators in agreement, the trend is your friend and invest as to the direction the market is suggesting.
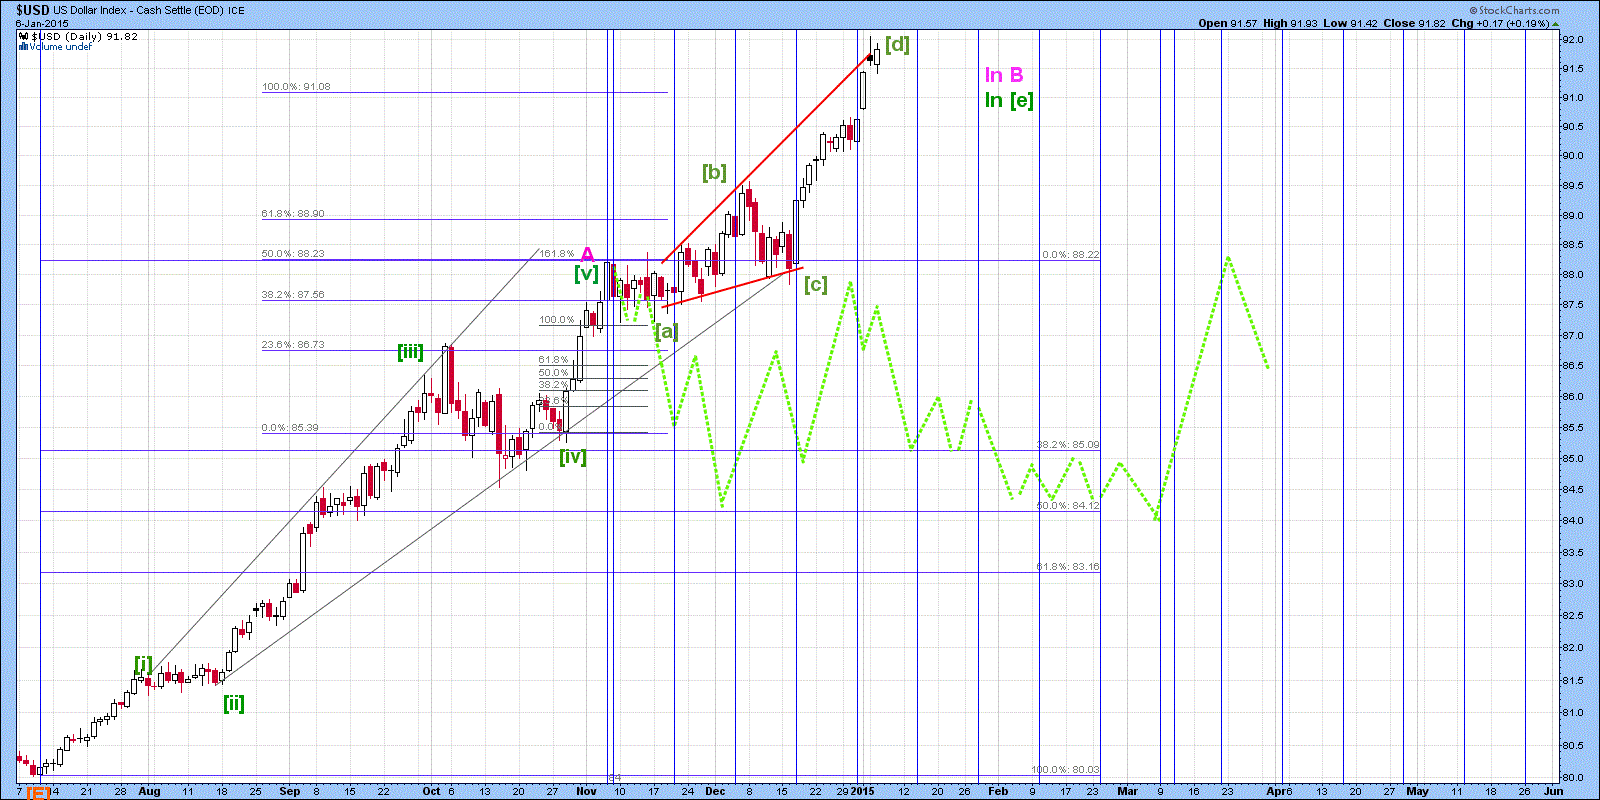
The short-term Elliott Wave count of the US Dollar Index is shown below, with wave [e] thought to be developing. With the wave structure forming, a Diametric triangle (7 legs) in the form of a diamond (as opposed to the form of a bow-tie (contraction followed by expansion), a rising pennant is likely forming until some point in mid-February. The mid to late March time frame was based upon equivalency between waves A and B. Completion of wave B in February would indicate wave C would be equivalent in time to the summation of waves A and B, or 7.5 months (September time frame). This is somewhat earlier than what I was thinking, but what I think is irrelevant…the market will always be right. So, if the scenario described above unfolds, we could see wave B complete around, 95.0, followed by a 13 cent upside move 108ish. The US Dollar is in a 5-7 year uptrend (since July 2014 ) and most people have failed to realize this…We are just nearing the mid-way point of this pattern, so it is going to be very interesting over the next 10 months to see how things unfold.
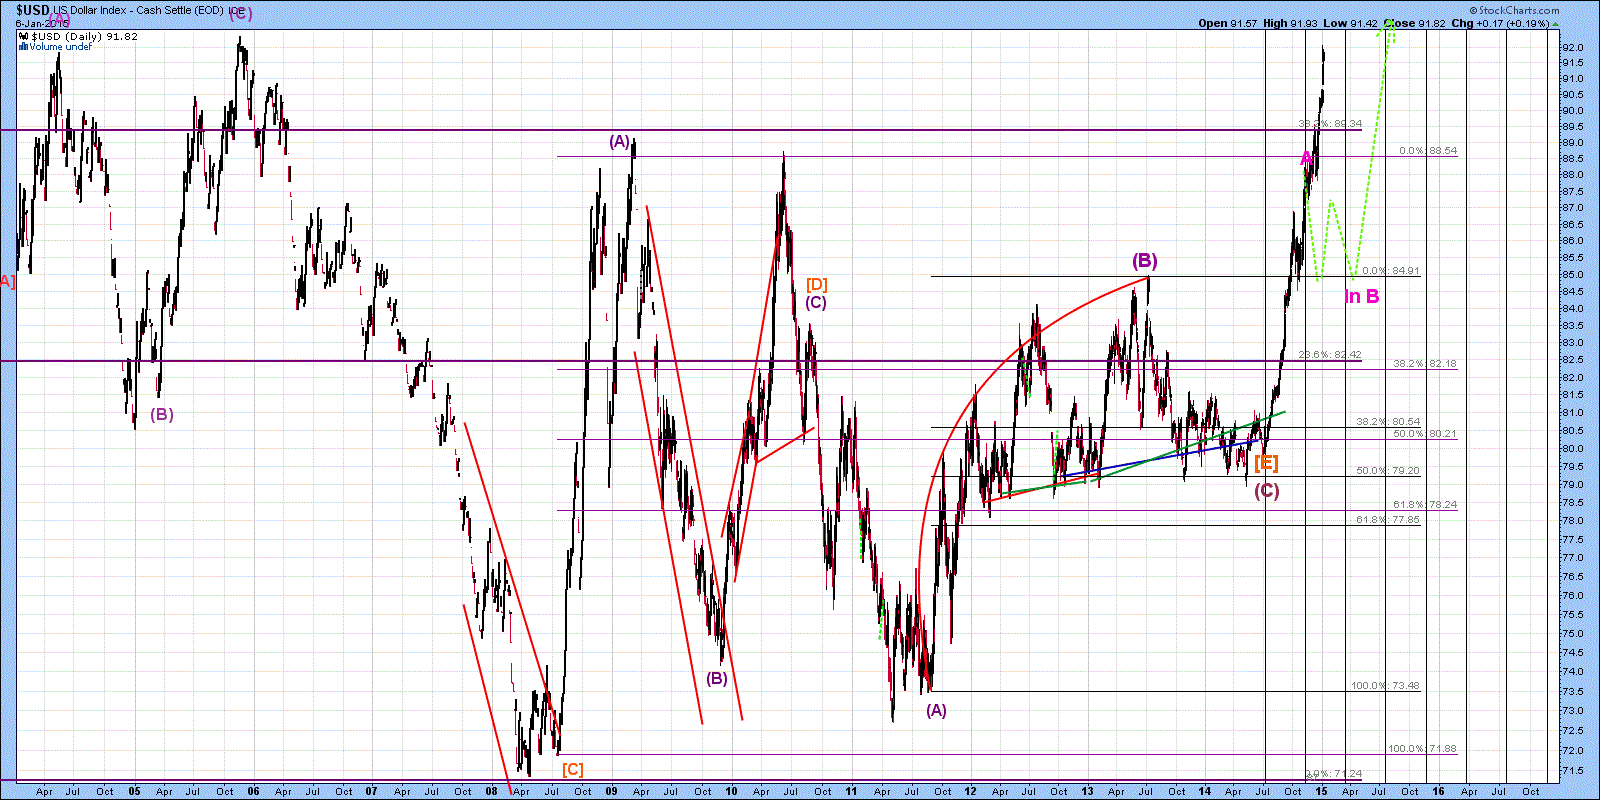
The mid-term Elliott Wave count of the US Dollar Index is shown below, with wave B thought to be underway in the form of a running correction. It is impossible to even conceive of this notion based upon this chart, which is why a shorter-term chart is required to examine the intricacies of what is happening. Wave [E] represented the end of a multi-year decline, which gave birth to the current 5-7 year bull market in the US Dollar Index now underway. Failure for the two back to back Head and Shoulders patterns to follow through reversed the downside energy to the upside, which is what we are now witnessing. Only expect much higher levels going forward for the US Dollar Index.
That is all for today…back tomorrow AM…Have a great day.
********
Copyright 2015 www.treasurechests.info All rights reserved.
Unless otherwise indicated, all materials on these pages are copyrighted by www.treasurechests.info. All rights reserved. No part of these pages, either text or image may be used for any purpose other than personal use. Therefore, reproduction, modification, storage in a retrieval system or retransmission, in any form or by any means, electronic, mechanical or otherwise, for reasons other than personal use, is strictly prohibited without prior written permission.
Disclaimer: The above is a matter of opinion and is not intended as investment advice. Information and analysis above are derived from sources and utilizing methods believed reliable, but we cannot accept responsibility for any trading losses you may incur as a result of this analysis. Comments within the text should not be construed as specific recommendations to buy or sell securities. Individuals should consult with their broker and personal financial advisors before engaging in any trading activities. We are not registered brokers or advisors. Certain statements included herein may constitute "forward-looking statements" with the meaning of certain securities legislative measures. Such forward-looking statements involve known and unknown risks, uncertainties and other factors that may cause the actual results, performance or achievements of the above mentioned companies, or industry results, to be materially different from any future results, performance or achievements expressed or implied by such forward-looking statements. Do your own due diligence regarding investment decisions.
 David Petch is a cofounder of www.treasurechests.info which has been in existence since 2003. His technical analysis focuses on Bollinger bands, stochastics (using daily, weekly and monthly charts), as well as extensive Elliott Wave analysis. His recent discovery of the Contracting Fiboancci Spiral the broad stock market indices are trapped in has indicated every major top since its inception in 1932. The CFS cycle also identifies expected major tops between now and 2020. David holds a BScH and MSc in Microbiology.


