A Big Advantage: Knowing Where You Are In The Cycle


Geoffrey Moore, the father of leading indicators, once said that it is a big advantage just to know where you are in the economic cycle, let alone trying to forecast where it is going.
Most investors or analysts don't have a concrete way to define where we are in the cycle and use common but silly analogies to the inning of a baseball game to identify the current standing of the economy. I have even heard some analysts describe the economic cycle as being in "extra-innings." I understand this mentality but chuckle at the framework as it has become such a consensus saying that all media pundits seem to have an answer as to the inning of the game.
The best way to measure where we are in the cycle today is to use a broad coincident index of data This coincident index should cover the critical sectors of the economy including sales, income, employment, and manufacturing. I use a coincident index that contains these four factors, outlined loosely by the NBER in a note that you can find by clicking here.
To be clear, this index is not used to forecast where the economy is going nor is it used for asset allocation. The purpose of this index is to confirm the direction of the leading economic indicators and identify where in the economic cycle we are today.
4 Factor Coincident Index Year over Year Growth (%):
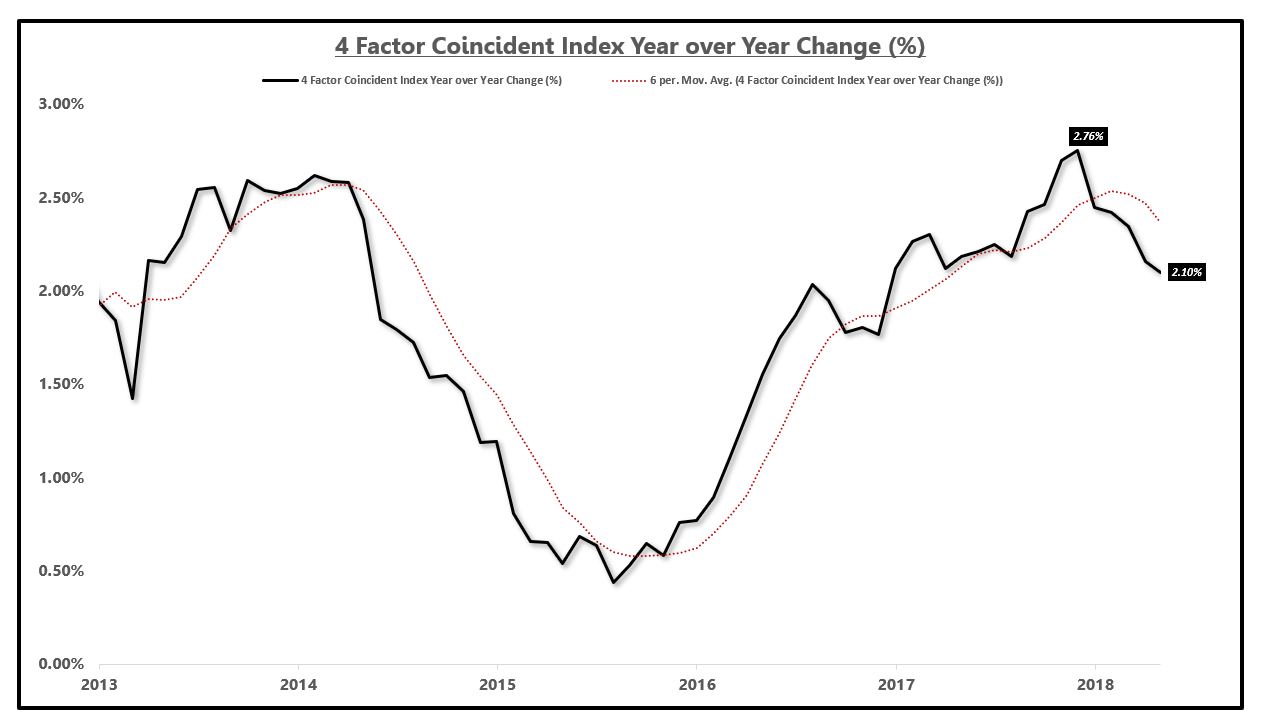
Source: BEA, BLS, Census Bureau, Federal Reserve
The chart above clearly shows the cyclical moves in the economy over the past several years
Despite popular opinion, a recession is not defined by two negative quarters of GDP. This is not a necessary nor sufficient condition for a recession. A recession is actually defined by a broad contraction in sales, income, employment, and manufacturing which can be identified by a negative year over year reading in the coincident index.
As the chart above shows, the 2015-2016 economic slowdown was quite severe but we did not see a contraction in the coincident index and thus, no recession.
GDP is a lagged quarterly data set and while the information is highly accurate (after revisions), the coincident index is updated monthly and tracks the direction of underlying economic growth.
Real Final Sales Vs. Coincident Index Growth Rate (%):
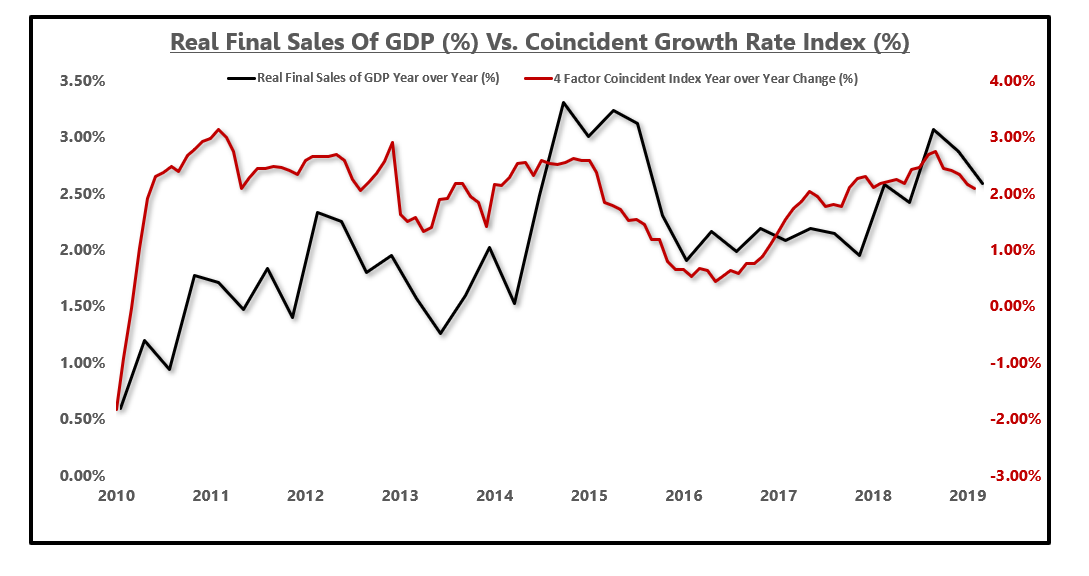
Source: BEA, BLS, Census Bureau, Federal Reserve
Knowing where you are in the economic cycle provides a substantial advantage over those who are still talking about the economic cycle in terms of innings in a baseball game.
Asset classes respond to shifts in the trending direction of economic growth. Therefore, if you can forecast where the coincident index will be going, you can forecast turbulence or success within assets.
The next step in this process is to have strong leading indicators that can forecast where the coincident data is going.
I use an array of leading economic indicators that allowed me to make the call at the end of 2017 that US growth was going to slow. As the coincident data shows, growth is indeed slowing.
What has been the result of this slowdown so far? Well, there has been a 10% and a 20% correction in the stock market and since the most pronounced change in the leading index, around January of 2018, the S&P 500 has only yielded a total return of 2.08%.
Sure, the S&P 500 is near all-time highs and the recent rally has been strong. I am not short the S&P 500 and in fact, I am long the S&P 500 in an appropriate weighting. I am long sectors that have massively outperformed the S&P 500 and short sectors that have massively underperformed due to spotting the inflection in the economic cycle.
Gaining just 2% in over a year with a 10% and 20% drawdown is not a good risk-adjusted way to manage money.
Over that same time period, you could have made 3% in long-term bonds with a max drawdown of just 7%.
Even better, you could have earned the same 3% in 5-year Treasury bonds with a max drawdown of just 2%.
Regional bank stocks have plunged more than 14% since the turn of the cycle.
Asset Class Returns Since The Cycle Turned:
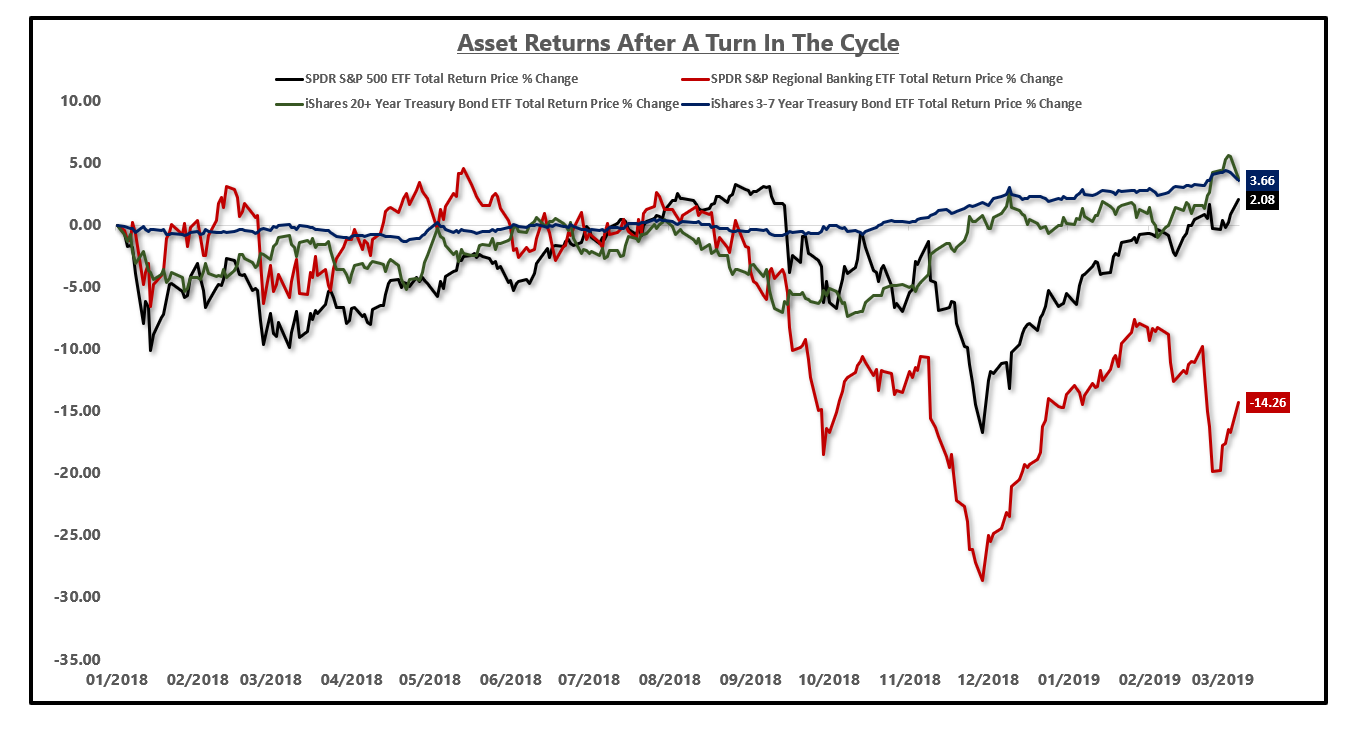
Source: YCharts
There are many ways to play a turn in the economic cycle but the process starts with having a coincident index to measure where we are in the cycle and then having leading indicators that can reliably tell you when the cycle may be turning.
If cycle turns don't matter, why are utility stocks up 18% in the past 15 months while regional bank stocks are down 14%? A 32% spread between a defensive sector and a cyclical sector should be telling.
Using baskets of leading indicators and measuring cycles is not difficult. The difficulty comes from having enough patience to allow the data to play out as you know it will in addition to creating a portfolio that still earns money while you wait for consensus to realize the inflection point in the cycle.
More on this to follow...
********


