The Bull Market in the Gold Mining Shares Has Only Started
Tedious – that’s how I’d describe the stock market for the past six weeks. Everything is on hold until Janet Yellen finds the courage to euthanize the bulls on Wall Street with a few rate hikes. It will be a real tear-jerker, but it won’t take much to get the job done. An increase in the Fed Funds Rate of a hundred basis points would do to the bulls on Wall Street what (God forbid) a hundred pounds of anthrax spores would do to the Wyoming beef industry.
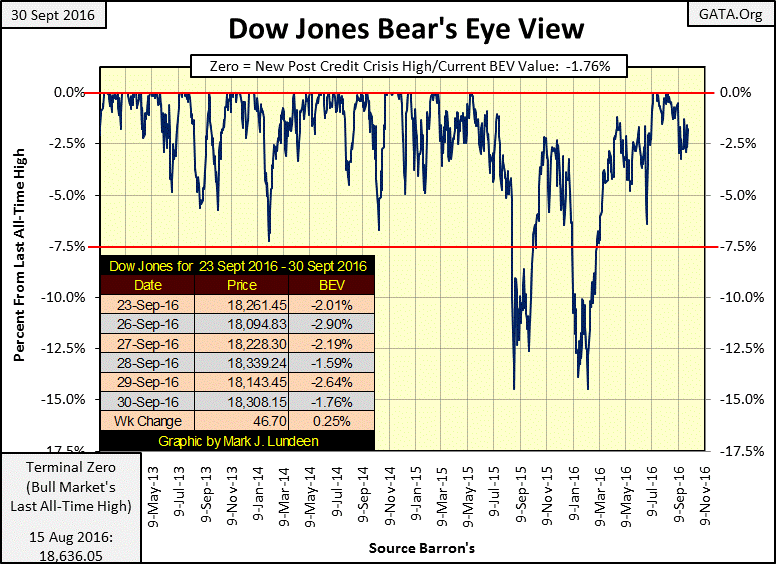
Then maybe Mr Bear intends to take this market down ahead of Yellen’s FOMC sham time table of raising short-term rates. Germany’s largest bank; Deutsche Bank, a huge player in the derivatives market has seen its share price sinking like a ship for months. Its derivative portfolio of seventy-trillion dollars has its tentacles attached to just about everything financial in our world.
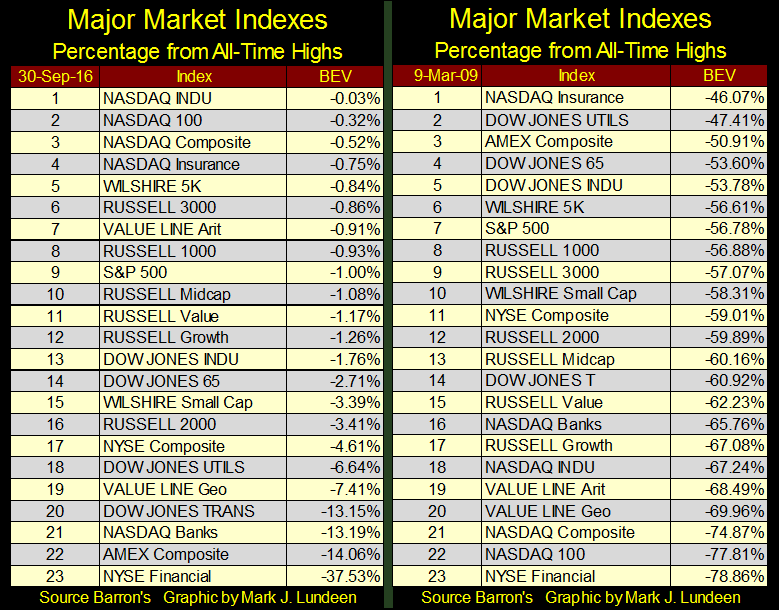
Unfortunately, the mystery of what happens when the counter-party of seventy-trillion dollars of notional value derivatives goes under will be revealed to all in the not too distant future. And it’s not just Deutsche Bank having problems in the market. The table below gives the BEV values for the major market indexes I track daily for the end of this week (left side) and at the bottom of the credit crisis bear market (right side).
On 9 March 2009, there were ten indexes 60% or more from their last all-time highs. That’s a big bear market bottom. In the past seven and a half years they have all moved up smartly, most making new all-time highs as they’ve advanced. But not the NYSE Financial Index; (#23) in both tables.
When we realize the trillions of dollars of subsidies, changes in accounting rules, and buy-side promotion these companies have benefitted from since the credit crisis, this shouldn’t be. What’s weighing American finance down? I suspect the same thing that’s caused Deutsche Bank to fall from grace; exposure to OTC derivatives by the tens of trillions of dollars.
This fatal flaw in the market isn’t apparent now, as the derivatives these banks are counter-partied to are currently not in the money. But when interest rates once again begin to rise, and the stock market begins to deflate, the specific performance obligations for these companies could go from zero one week to trillions the next.
The FOMC knows this. Last December they promised four rate hikes for 2016. But after nine months into the year have so far refused to raise interest rates even once as they are painfully aware that in doing so, the current members of the FOMC may be signing the Federal Reserve’s death certificate.
Small wonder the establishment is supporting Hillary in the coming presidential election. They must fear President Trump would use his Justice Department to finally prosecute Wall Street, and Washington’s market regulators for this historic criminal activity.
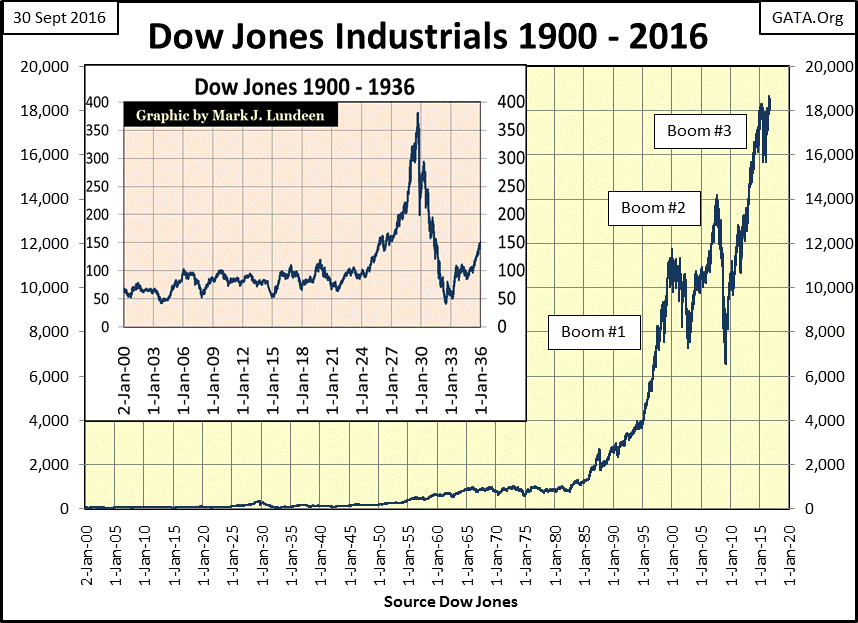
When Mr Bear finally does come to take Wall Street’s trash out, the effects of reinstating market hygiene will be impossible to hide. The financial bubble the “policy makers” inflated in the Dow Jones during the 1920s is seen below. The bull market of the Roaring 1920s was nothing but inflation. When Mr Bear finished taking the trash out in July 1932, he deflated the Dow Jones’ valuation to where it was in 1904. The trauma of the 1930s is still seared into our collective memories, though few living today have personal recollections of the Great Depression.
Looking at the inflationary gains the Dow Jones has seen since the dollar was decoupled from the Bretton Woods $35 gold peg in August 1971 (chart below), I can make the case for the Dow Jones closing well below 1000 at the bottom of the coming bear market. It doesn’t make me happy saying this; but the next chart scares the hell out of me, as it must Fed Chairwoman Yellen, who for years has refused to normalize the yield curve for fear of causing a market crash. Now in 2016, the Dow Jones at 18,000 is far above where it was in 1971.
Writing about the stock and bond markets depresses me; time to move on to gold, silver and the companies that mine them.
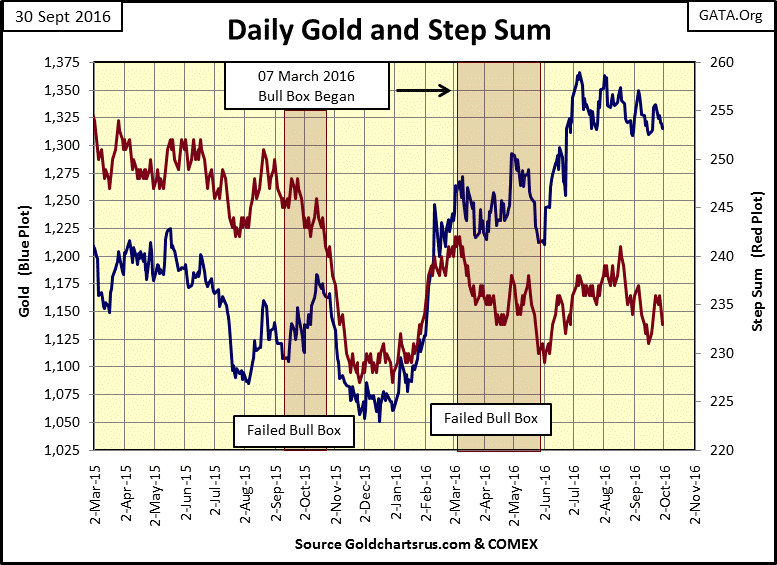
Gold and its step sum have become as tedious as the stock market. But for gold, I’m optimistic that better things are coming in the months and years to come. My ability to time markets has never impressed anyone. But then it’s hard outguessing financial institutions that have access to unlimited funds, and have corrupted the government’s market regulators to manage valuations in their favor. But I feel safe saying that the next big move in gold and its step sum will be up. That will be especially true when bond yields and interest rates begin to rise. When will that be? I believe by March we may see rates and yields rising, taking the old monetary metals up with them to much higher levels. Then maybe by the end of October we’ll see gold and silver much higher.
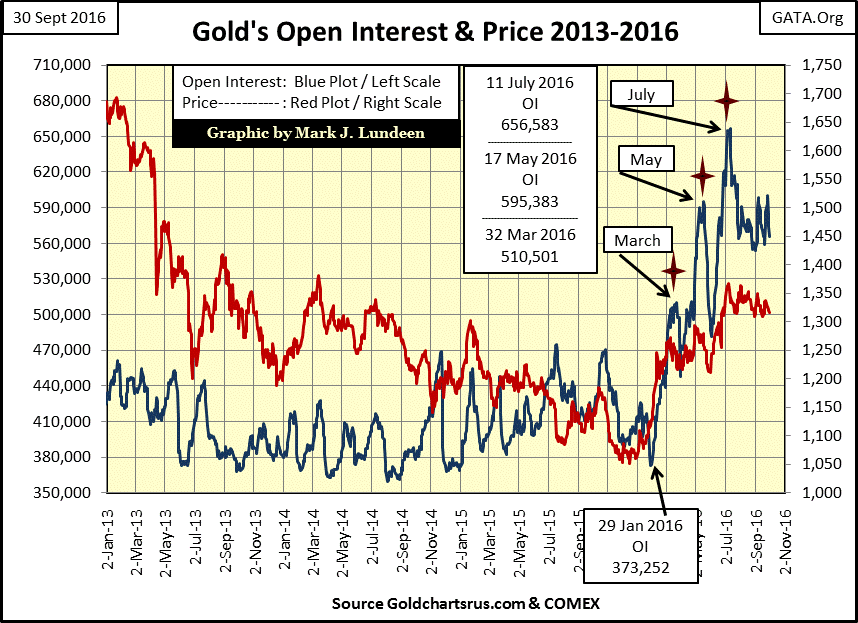
There is good reason to expect higher metal prices ahead; Wall Street’s willingness to increase COMEX open interest in the gold market (Blue Plot below) in excess to where they had it in July isn’t there. Three times this year, in March, May and in July the big banks ramped up OI, without much success in depressing the price of gold. That they haven’t done it for a fourth time should say something about their expectations for gold’s near term prospects.
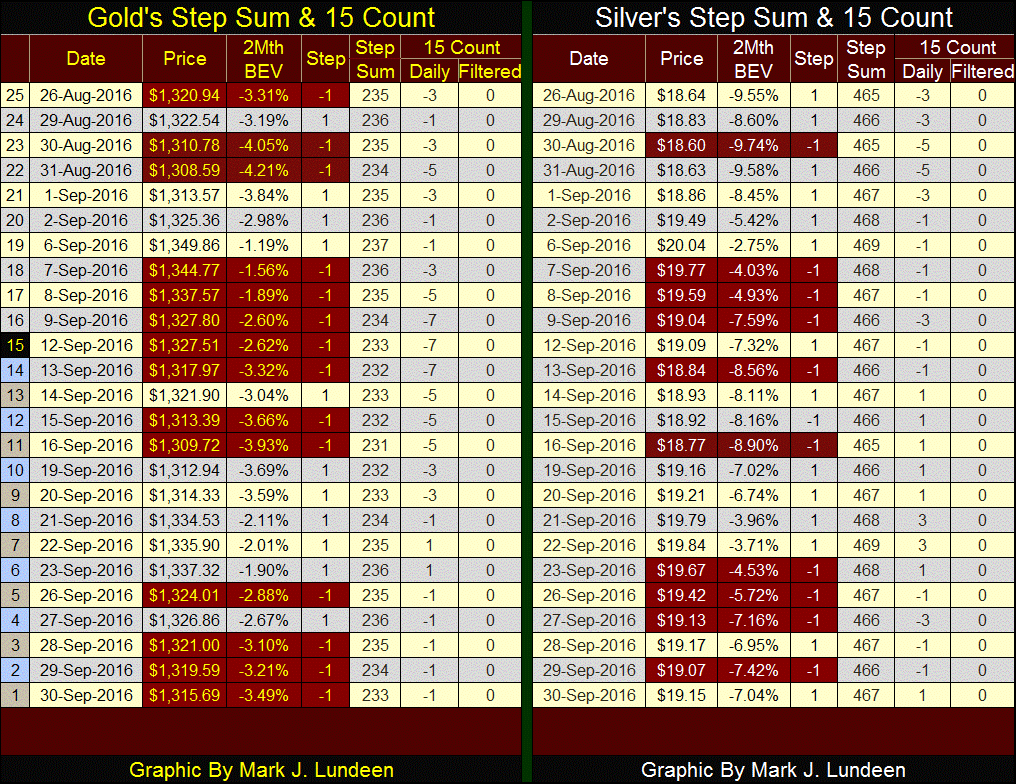
Gold and silver’s step sums and 15 counts, like everything else in this market, are just marking time before the November election.
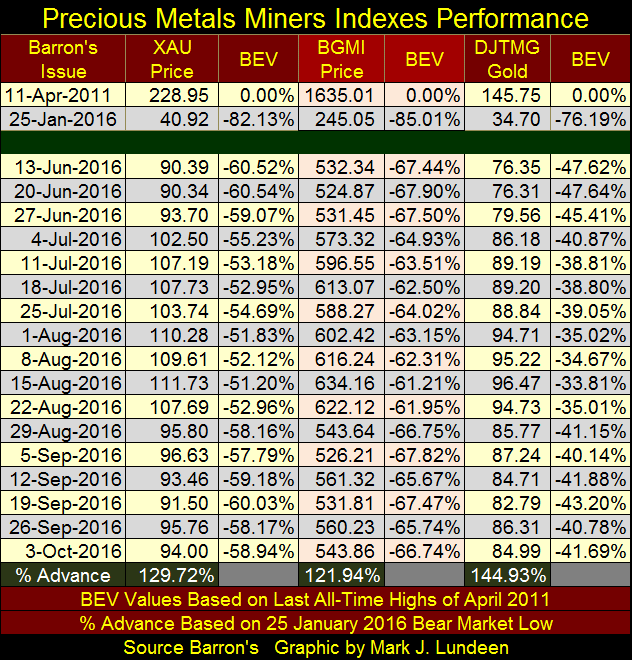
Ditto for the gold and silver mining indexes I follow below.
But this is how bull, and yes bear markets too operate; they don’t go from one market extreme to the other in a straight line. Markets seem to enjoy creating frustration for the people investing in them. Since 1920, the gold mining shares have excelled in doing exactly that.
Barron’s began publishing their Gold Mining Index (BGMI) in 1938. At the time it consisted of only two gold mining companies;
- Homestake Mining
- Alaska Juneau Gold
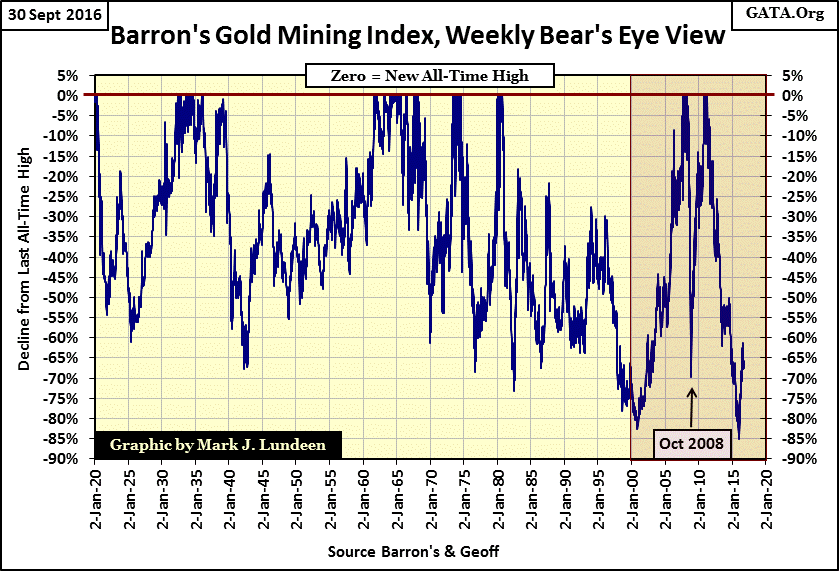
Geoff; a good friend from the land down under, made the effort and sent me weekly data for Homestake Mining going back to January 1920, which allowed me to push the BGMI back another eighteen years. Below we see the BGMI data in Bear’s Eye View (BEV) format.
During the Great Depression Crash; from September 1929 to July 1932 as the Dow Jones suffered an 89% collapse in valuation, the BGMI was either recovering from its 60% bear market bottom of 1925, or seeing one new all-time high (BEV Zeros / 0.00% in the chart) to the next from May 1932 to March 1936. Not for the last time the BGMI provided investors with an excellent counter-cyclical investment to the stock and bond markets during a time of market distress.
Still, the gold miners have their problems; the fact that stands out in BGMI’s BEV plot below is how volatile gold mining stocks have been in the past ninety-seven years. What other asset class routinely sees corrections during its bull markets in excess of 50%? The exception to that rule was during the period from the late 1940s to March 1968, when the BGMI advanced 690% with very little volatility. The Dow Jones was up 372% during these same two decades.
But all that changed on 14 March 1968, with the following press release issued from Buckingham Palace, United Kingdom.
“The London Gold Market will be closed today, Friday, March 15. This is at the request of the United States Government.
“At a meeting of the Privy Council held this morning at Buckingham Palace, Her Majesty the Queen approved a proclamation appointing Friday, 15th March, to be observed as a Bank Holiday throughout the United Kingdom.
“The banks are, however, being asked to provide their domestic customers with normal cash requirements in sterling.
“The authorities are requesting that the stock exchanges also be closed.”
With the March 1968 termination of the London Gold Pool, the “policy makers’” price fixing scheme for gold in the 1960s, volatility was once again introduced into the BGMI.
Which brings us up to 2001; the bottom of the 1980-2001 bear market in gold and the BGMI. At the end of this twenty-one year bear market, gold bullion was down 69% from its high of January 1980. The BGMI saw an 82% decline. For the past fifteen years the BGMI has been in what I call a historic bull market (Red Box in chart above), during which volatility became completely insane. Well it has been. From 2001 to 2007, the gold miners went from -82% in the BEV chart above to a BEV Zero (new all-time high). In dollar terms it went from 224 to 1528 (581%) in just seven years with zero promotion from Wall Street or the financial media.
Then, as the sub-prime mortgage crisis was breaking into the news cycle, the BGMI crashed 70% from March to October 2008. A 70% collapse in market value is a huge hole for any market to climb out of, especially one that occurred in just seven months. Yet the BGMI went on to new all-time highs just two years later (November 2010), again entirely under the radar of the general public. Next, beginning in April 2011, the gold miners began a five-year bear market that took the BGMI down a historic -85% decline in the BEV chart above; ouch!
What is going on here? In my opinion Wall Street and central bankers know the counter-cyclical nature the gold miners have to the broad financial markets that they operate in. These banks and their political supporters fear the consequences of deflating asset valuations, rising interest rates and bond yields should decades of monetary inflation currently residing in the financial markets begin an unstoppable flow into the precious metals and their miners. The volatility seen in the BGMI of the past fifteen years is their effort to keep investment funds in the general financial markets and out of the gold and silver mining stocks.
Since its historic 85% bear market bottom of January 2016, the BGMI almost broke above its BEV -60% line just a few weeks ago. That took a lot of buying to accomplish this feat of market strength in only eight months. We’re seeing history in the making in the chart above! Geeze Louise, look at BGMI’s BEV chart. In the past fifteen years the BGMI has seen one 70% bear market bottom in 2008, and two 80% bear market bottoms, one in 2001 and again in 2016. Since 1920, nothing like this has ever happen before, so I think something new is happening here.
I suspect the current flow of funds coming into the BGMI, beginning in January of this year, and other gold and silver mining indexes is coming from well informed money, and there is no money better informed than that coming from central and big NY banks.
After decades of running riot in the financial markets, these banks see a day of reckoning coming. Maybe sooner than they’d like should Deutsche Bank become the next Lehman Brothers. In the next financial panic, there is good reason for believing the BGMI will perform as it did during the Great Depression Crash, and again during the credit crisis (after October 2008); a superb counter-cyclical investment to the deflating bond and general stock markets.
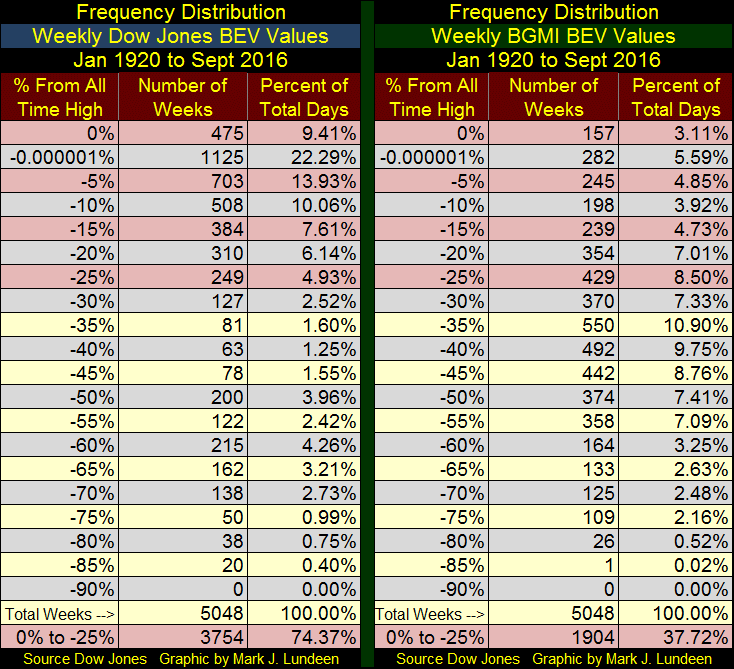
But the volatile nature of the gold miners won’t make it easy on investors’ psychology in the coming years. Below are the frequency distribution tables for weekly BEV data for the Dow Jones and the BGMI from 1920 to this week. The tables top two rows;
- 0.00%--------: new all-time highs
- -0.000001%: weekly closings short of a new all-time high, down to -4.99% from being one are remarkable in their differences.
Since January 1920, the Dow Jones has closed at, or within 5% of making a new all-time high for 31.7% of its 5048 weekly closes. The BGMI has only seen 8.7% of its weekly closings within 5% of a new all-time high since 1920.
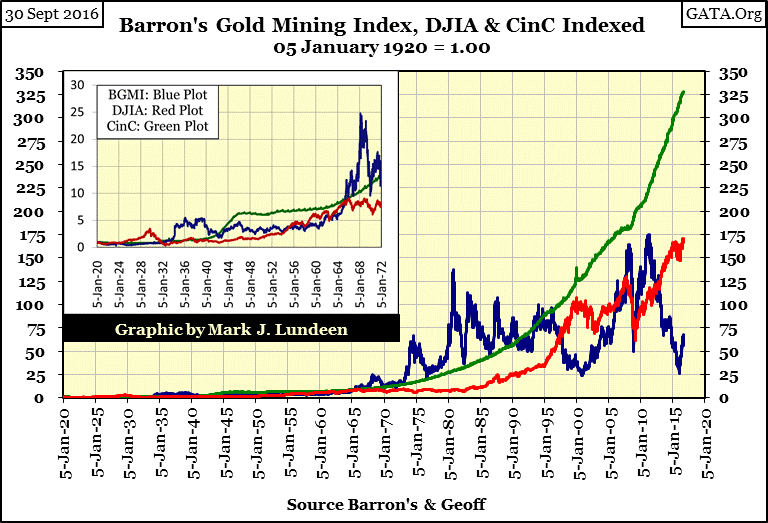
If the past ninety-seven years of market history seen in the BEV chart above, and the chart plotting the indexed value of the Dow Jones BGMI and CinC below are our guides, wild volatility or not, seeing the BGMI down from its last all-time high by 60% is a strong buy signal.
In the chart below, the Currency in Circulation (CinC / Green Plot) provides the data with an inflation reference. The BGMI (Blue Plot) has frequently outperformed the Dow Jones (Red Plot) for decades on an inflation adjusted return basis since 1920.
Seeing the Dow Jones currently near the top of a multi-decade bull market, a top that has fallen ever farther behind the inflation flowing from the Federal Reserve (Green Plot) is a warning the “policy makers” are losing their grip on the stock market.
In the chart above, it’s evident that for much of the past century the BGMI has not only outperformed the Dow Jones, but also inflation as measured by CinC. Since 2001, the BGMI has twice attempted to couple with the CinC plot above, and almost made it, while the Dow Jones since January 2000 keeps falling behind the rate of CinC inflation.
Using the indexed values seen in the chart above, in the table below we see how in April 2011 at its last all-time high, the BGMI exceeded the Dow Jones last all-time high seen just last month.
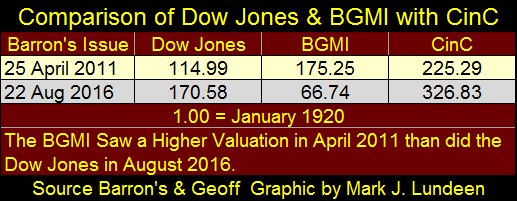
Look at CinC in the table above. In the past sixty-four months it’s increased by 44% and economists have the gall to tell the public the Federal Reserve can’t raise short-term rates because inflation is below 2%.
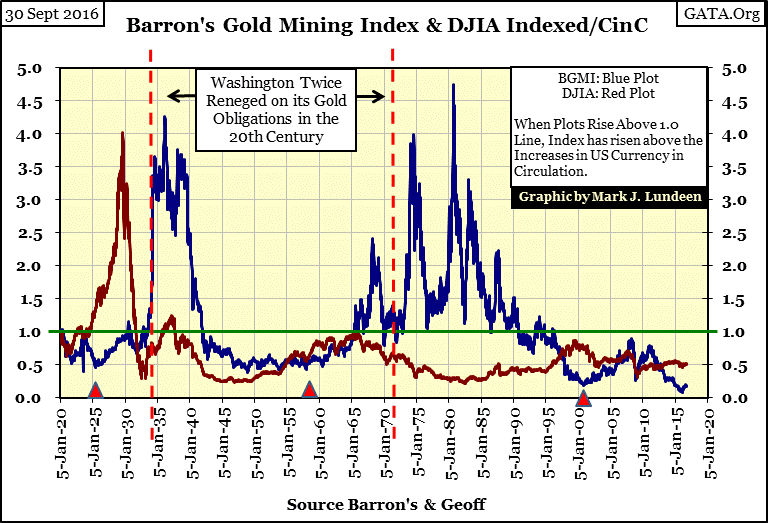
Below is another view of the data above, one that uses the Dow Jones and BGMI data as a ratio to CinC. Those weekly data points on the green 1.0 have inflated at the same rate as CinC, and those weekly data points in excess of 1.0 have seen gains in excess of the rate of CinC inflation. Note for the Dow Jones (Red Plot), the only bull market of the past one hundred years where the Dow Jones delivered capital gains in excess of the rate of inflation was during the Roaring 1920s.
Note too since the Dow Jones high-tech bubble top of January 2000, the market top for the sub-prime, and now for the post credit-crisis bull market has been less than the previous bull market top when adjusted for inflation. In inflation adjusted terms, the Dow Jones at the close of this week is actually down 36% from its January 2000 highs.
This chart highlights the counter-cyclical nature the BGMI has to the Dow Jones. To be sure there have been times when these two market indexes were in in sync with each other; as from 1945 to 1965. However, a quick study of this chart shows that the place to be in the 1920s was in the general stock market (Dow Jones). Then as Mr Bear deflated valuations in the Dow Jones during the 1930s, the BGMI provided wealth a safe and profitable harbor in the storm. But once the BGMI peaks in a bull market, gold mining becomes a dangerous place for personal wealth. However, as the BGMI hasn’t been above the green 1.0 line since 1996, twenty years ago, we don’t have to worry about that now.
Since 2001, the BGMI has twice attempted and failed to rise above the 1.0 line. When the “policy makers” market rig finally comes undone, the rapidity of the market gains in the BGMI will shock many, but not anyone who has studied this chart.
The BGMI closed the week at 546 with CinC at $1.48 trillion. For the BGMI to reach the 1.0 line in the chart above it would have to increase to 3,050. For it to increase to its last all-time high of 4.75, seen in October 1980, the BGMI would have to increase to 14,500. Is that possible? In a market meltdown, where hundreds of trillions in flight capital are looking for a safe place to wait out the storm, I wouldn’t rule out any potential valuation for the BGMI.
If the past is the key to the future, and it usually is, seeing the BGMI currently at historic lows, relative to CinC inflation, strongly suggests gold and silver miners are a historic buy at today’s prices.
Mark J. Lundeen


