Bull Market? Not According To The Dow's Step Sum And NYSE 52 Week Highs - Lows


From the crash of October 2008 until August 2010, I wrote a weekly report comparing the crash of 1929-32 with our current bear market. I stopped my "Bear Market Race to the Bottom Report" because the Great Depression Bear from start to finish lasted only 149 weeks while our bear market still has a long ways to go. In other words, I'm thinking that even after the massive decline in the Dow Jones of -53.78% on 9 March 2009 (the second worst in history), the worst is still to come. Here is a table of every massive -40% Dow Jones bear market from 1885 to 2011. Only two of these bear markets lasted longer than our bear's 190 weeks.

So what do I see that few, if any market commentator are missing? Just the big picture! Bull and bear markets don't just happen; they are normal human reactions to unsound credit expansion and the resulting painful contraction of credit by an economy's banking system.
Even during the gold standard, credit creation by banks was a fact of life. For example, banks would take in a $20 double-eagle gold piece, and use it as reserves for as much as $200 in loans, via checks. So, credit isn't actually something the bank gives you, rather an economy's willingness to accept what its banking system claims to be money: someone else's debt. So, you think you have money in the money market at your broker; really? Currency in Circulation (CinC: US money in the form of paper and coins) is just over a trillion dollars. Yet just last week, the good people over at ICI reported $2.726 trillion dollars in money market accounts. Managed money, such as money-market mutual funds, don't hold cash-money, but short-term credit instruments -INTEREST BEARING DEBT. Ditto for savings deposits at your bank, and the several trillion dollars the S&P 500 companies are currently holding in "cash."
For every $1 in CinC; the Federal Reserve, and its banking system, expands that many times via loans. This is not necessarily a bad practice. When credit is properly managed, holding someone's debt can be a real blessing to the economy, and everyone making a living on it. However, credit creation as practiced by Doctors Greenspan and Bernanke has been one reckless Ponzi scheme after another!
Understand that loans are both a liability, and an asset. So, debt based assets are only as good as the ability of debtors to make good on their liabilities. When credit is expanded beyond the ability of the economy's debtors to service their debts, the economy enters into a boom-bust cycle. The upside to this cycle is a rip-roaring bull market; remember them? The down side is a bear market where credit contracts as defaults and bankruptcy becomes the new reality.
The great failing of the current generation of financial commentators is that since Alan Greenspan became Fed Chairman, they've credited vain human beings controlling the levers of power in government and finance with god-like powers. When the malignant narcissist in charge of the Federal Reserve made the following statement six years ago, the media (with few if any exceptions) passed on the new gospel on credit to the masses.
"Innovation has brought about a multitude of new products, such as subprime loans and niche credit programs for immigrants. With these advances in technology, lenders have taken advantage of credit-scoring models and other techniques for efficiently extending credit to a broader spectrum of consumers. These improvements have led to rapid growth in subprime mortgage lending . . . fostering constructive innovation that is both responsive to market demand and beneficial to consumers." -- Alan Greenspan (At the Federal Reserve System's Fourth Annual Community Affairs Research Conference, Wash D.C. April 8, 2005)
The dire implications of the above "multitude of new products" would have been instantly recognizable to financial commentators many decades ago. The very thought of extending trillions-of-dollars in credit to wage earners for consumption, or the belief that home construction could be a viable long-term economic "engine of growth" would have been ridiculed by past generations of economic observers, but not by today's college educated baby-boomers. We have computer programmers today that have it all figured out, unlike the stone-age of the 1950s, or so the theory modern finance goes.
My problem with the Dow's March 2009 low is that it's a false bottom in the stock market. We'd be foolish to believe Dr Bernanke and his ilk that the worst is over, since it's a documented fact that the market distortions, which caused the second worse decline in the Dow since 1885 were credit induced, and these credit problems have not yet been resolved, or even properly addressed. According to "government experts", the recovery began in Spring of 2009, but the figures on employment, housing, inflation, GDP and the National Debt tell a different story. Public and private sector debt created by Washington and Wall Street over the past two decades has reached obscene levels and now is a huge drag on the economy. Student loan debt recently exceeded credit-card debt for the first time in history. What a way to start out life: 22 years old and be a member of the growing class of highly educated but structurally unemployed, with a $60,000 barbed-hook permanently attaching a worthless education to your empty bank account.
Marking financial assets to market and liquidation of un-payable debt are necessary steps to unburden the economy if the world is ever going to get past its old mistakes in banking and move forward, as the above 22 year old will soon figure out! Since 1885, a rebound off the Dow's bear market bottom has marked the point in time where Mr Bear's torch has finally burnt away the last of the previous credit cycle's unviable debt. But this is not our current situation. The best minds in Washington and on Wall Street have not only circled their wagons to protect the illiquid debt that fouls the balance sheets of politically influential banks, but have actually doubled, and tripled down on their losing bets with bailout money from the Treasury, and handouts from Dr Bernanke's Discount Window. They know that even if they lose, the taxpayer will end up bailing them out again.
Well, I have news for you; it ain't going to work. This bear market won't be over until all of Congress & Greenspan's "multitude of new products" pass through Mr Bear's fire, or the US dollar is inflated to the point of being totally worthless. What that will mean in Dow points I don't know. But I do expect Mr Bear will eventually manage market psychology to a point where even the arrogant twits responsible for this mess are forced to face reality. Mr Bear is a bad dude! He took down the Roman Empire and the Soviet Union; both ended with their money worthless. He won't spare us if we continue to act like economic idiots.
So if things are so bad, what caused the Dow Jones to rise over 5500 points since its March 2009 lows? Two things:
- Trillions of dollars in "stimulation"
- Continuing widespread faith in the current system of credit creation
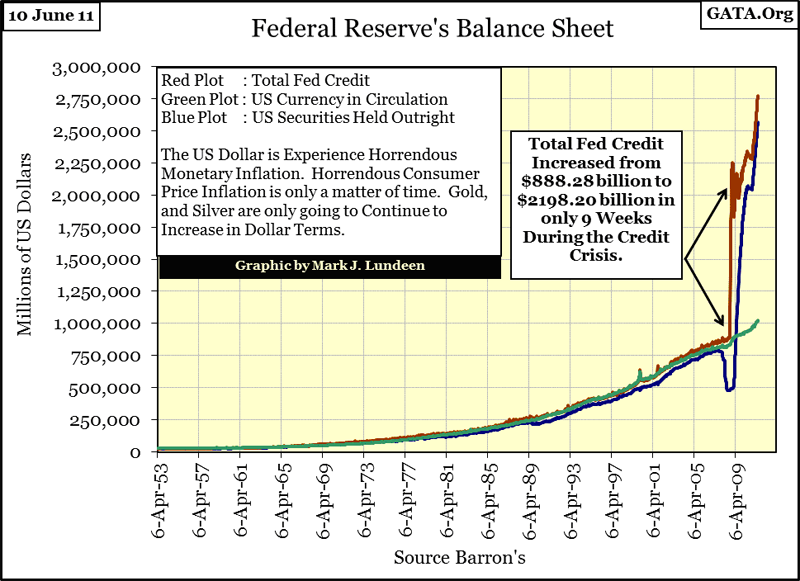
Both of these factors were needed to lift the financial markets up these last two years. Neither of these factors can be perpetuated indefinitely. Doctor Bernanke's "injection" of trillions into the banking system, most of which is used to purchase US Treasury Debt, will never produce actual economic returns, just more debt weighing down the economy. Future historians will record that the only thing "quantitative easing" (QE) accomplished was to provide more fuel for Mr Bear's bonfire at the actual bottom of this bear market. Also, credit systems based on faith (and they all are) are vulnerable to changes in public opinion. So, the thing to keep an eye on in early June 2011, is what happens to public opinion when the Fed ends its program of QE two weeks from now.
We can see what the termination of Quantitative Easing looks like by tracking the Fed's balance sheet (chart above), and the best method to follow the opinions of the only people who really matter in the market, the guys who are actually buying and selling stocks, is to keep track of the Dow Jones' Step Sum.
Dow Jones's Step Sum
A step sum is a single item Advance-Decline Line, using the daily, or weekly, ups and downs of a market index. Up days in the Dow adds a +1 to the step sum, down days adds a -1. So a step sum plot is the sum-total of all ups and downs of the market index being examined. As I'm expecting a decline in the Dow Jones similar to what occurred in the Great Depression, let's take a look at the daily Dow, and its step sum from 1928 to 1933.
Logic tells us that during bull markets we should see more up than down days, and that during bear markets, we should see more down than up days. But in fact, during both good and bad times in the stock market, there are as about as many up-days as there are down-days. As of 10 June 2011, the closing bell at the NYSE has rung 30,304 times since the first trading day of the 20th century on 02 January 1900. But when we subtract the down days from the up days in the stock market over the past 111 years, there has been a net of only 1,383 up days, as the Dow Jones Industrial Average rose from below 100, to over 12,000. Not only that, but during bull markets there are times when the market advances in price with more down days than up, and periods in bear markets where the market can come down hard, on more up days than down. There is nuance in this; the slight bias in the up and down days contains information on market sentiment, as is evident below in the interplay between the Dow Jones and its step sum.
We can break the Dow's action from a year prior to the September 1929 top, to the Great Depression's bottom in July 1932 into five major thrusts. Eighty some years later, there isn't much new to say about the Dow's Great Depression price trends. One was either on the right side of the market or not. But when we think of the Dow's step sum as an indicator of market sentiment, a means of seeing if the buyers and sellers were net bullish or bearish, in spite of what the price of the Dow Jones was doing, a new insight into market sentiment becomes apparent. I'll mark these moves in the Great Depression's bear market in terms of trading days, as shown in the chart below:
Day 300-0: Dow Up, Step Sum Up
Day 0-60: Dow Down, Step Sum Down
Day 60-180: Dow Up, Step Sum Up
Day 180-436: Dow Down, * Step Sum Up, then Sideways * Wow!
Day 436-845: Dow Down, Step Sum Down
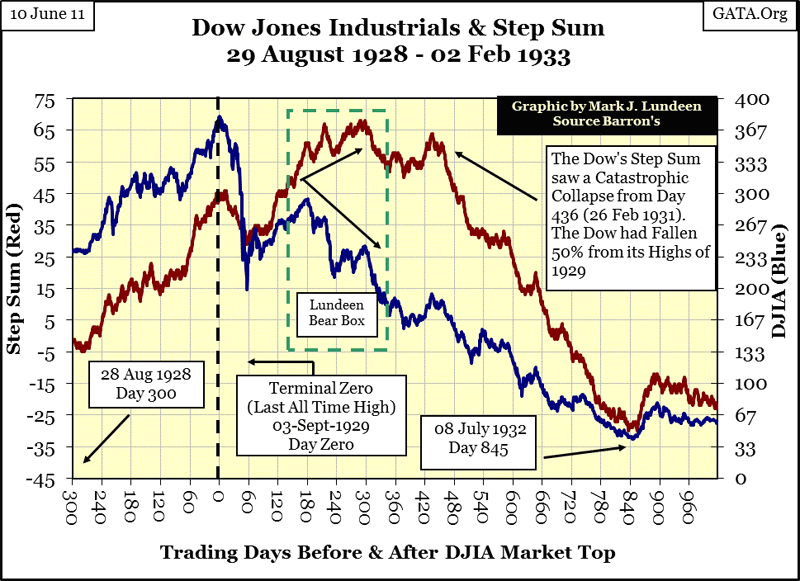
From August 1928 to July 1932, trends in the Dow's price and its step sum coincided, except from day 180 to 436. Why did investor sentiment (step sum) diverge from the Dow's price trend? We can see why by revisiting my table of Dow Jones -40% Bear Markets at the top of this article. From 1885, to November 1929 (Day 60) the Dow Jones had never seen a bear market decline deeper than 49% from a bull market high. During the market crash of October, November 1929, the Dow fell to 48% from its High of September. From the perspective of investors in November 1929 (Day 60) the worst must have been over! Who could have predicted that over the next two and a half years, the Dow Jones would continue its decline to the ultimate bear market bottom of 89%? The "smart money" was returning to the market for some bargain hunting, as clearly seen in the Dow's step sum!
This bullish market sentiment is very evident from day 180 - 300, a period when the Dow revisited its lows of November 1929, as the NYSE actually saw more up than down days, as shown by the Dow's step sum. I placed a green box around a technical formation I call a Lundeen-Bear Box, where investor sentiment, as recorded in the step sum, diverges from the primary trend of the market. Such divergent patterns identify those market periods where market sentiment has misjudged the future direction of the primary trend in the market. From day 300 to 436, the step sum was no longer making new highs. The bulls, one by one, were slowly figuring out what was coming their way!
From Day 436 - 845 the step sum entered into its CATASTROPHIC COLLAPSE, the step sum's terminal phase that coincides with the end of every major -40% Dow Jones bear market. This catastrophic collapse is * NOT * pertaining to the final collapse in market valuations. Typically most of the price correction in the market is completed before the step sum collapses, but not always as was the case in 1929-32. Nope, the catastrophic collapse in the step sum corresponds with market sentiment. At the start of the step sum's collapse on day 436, hope in a market rebound was still alive. At the end of the step sum's collapse on day 845 with the Dow reduced to only 11% of what it was just a few years before, Mr Bear had finally convinced the bulls to abandon all hope of survival, that no prisoners were to be taken alive. Then, just like that, the big furry guy got into his truck and departed Wall Street, leaving the Dow Jones to begin the best year in its history, a twelve month gain of 160%.
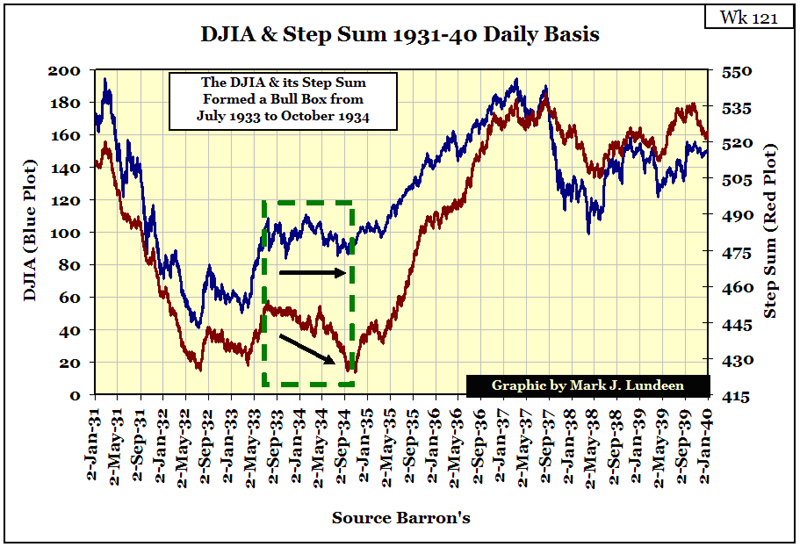
The stock market in the 1930s suffered from battered-investors syndrome. A chart from my Bear Market Report for Week 121 shows that even though Mr Bear was far away from Wall Street, the stock market's memory of his hot breath on the back of its neck was still fresh, as seen in the Lundeen-Bull Box of July 1933- October 1934. The Dow Jones trended sideways, as its step sum fell into a post-traumatic, catastrophic collapse. This chart shows the utility of the step sum in understanding future trends in the market. The fact that the NYSE saw so many more down days, than up for those 14 months, with so little effect on the valuation in the Dow Jones, was a strong indicator that the Dow Jones was only taking a break in its 1932-37 bull market. As soon as the market players wised up that the Dow was still in a bull market, the Dow and its step sum resumed their bullish trends.
Let's compare the Dow's step sums for the 1st and 2nd all time largest Dow Jones bear markets: the Great Depression and the 2007-11 bears. The chart below only shows the Dow Jones' * step sum plots * of the two bear markets, not the Dow Jones!
We see the different nature of market sentiment for the two bears. In the first half of the Great Depression bear, there were more up days than down, until investor sentiment saw its catastrophic collapse. Investor's sentiment for our bear market is amazing. No matter how badly Washington and Wall Street has screwed-up the economy with their toxic debt and derivatives, the public still believes the academics given air-time on CNBC, that that everything is well in hand. The Dow's 2007-11 step sum is telling us that the biggest bull market in 2011 is in forlorn hope!
The people today are really stupid, or something. After the high-tech wreck, and mortgage booms/busts, any other generation of Americans would have figured out that people in high places, and positions of public trust had betrayed them. But as we see in the Dow's step sum below, retail investors still have faith in the system. Somewhere on Gold Eagle, I did a study of the Dow Jones -40% Bears listed in the table at the top of this article. Some had Bear Boxes, and some didn't, but every one of them saw a notable collapse in their step sum, except ours - so far!
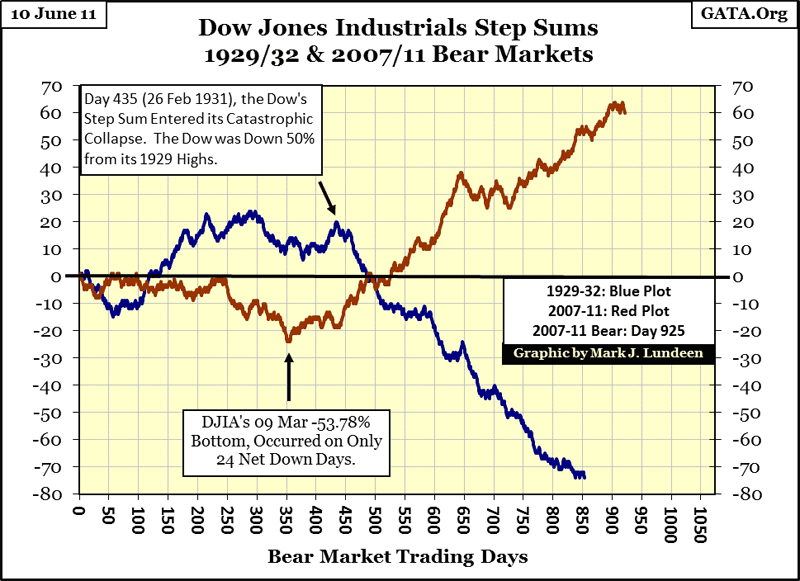
The chart below for our current bear market shows the Dow in a BEV format, plotted against its step sum. Within the bear box, the Dow's step sum was flat for the first year of the bear market, until the Dow had already fallen 40% in October 2008. Another example in the stock market where denial can be much more than just a river in Egypt! Incredibly, the second deepest bottom in the Dow Jones since 1885, occurred during a 17 month, massive decline in the Dow with the step sum falling only 24 net-down days! Sorry, but that doesn't look anything like the catastrophic collapse that developed at the end of the other major Dow Jones 40% bear markets!
I expect to see this Dow Jones 40% bear market (see table above for the list) to end like all the others: with Mr Bear burning away all the bad debt accumulated during the previous bull market, or marking the US dollar down to nothing, with the Dow's step sum COLLAPSE CATASTROPHICALLY, as beleaguered investors and market commentators see visions of their doom flash before their eyes.
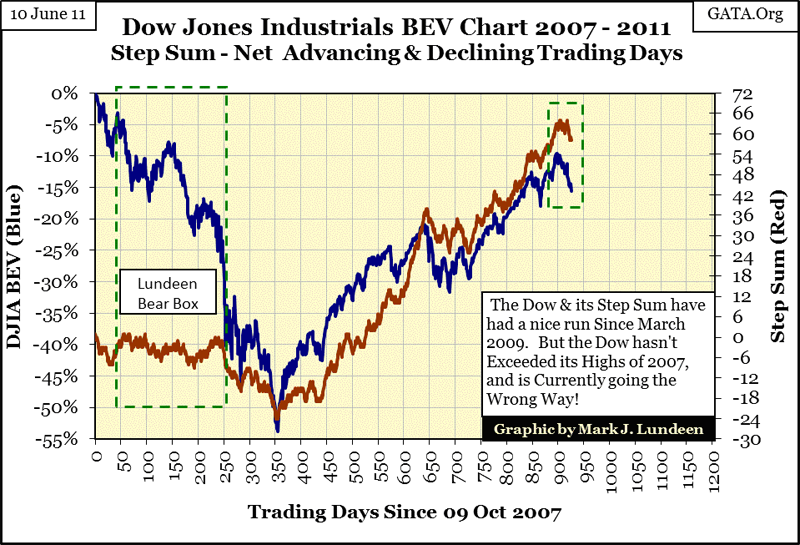
It's interesting to note what the Dow and its step sum have done since their March 2009 bottoms. The BEV plot shows how the Dow rose to within 10% of its highs of October 2007. When we consider how the Dow's step sum has advanced from -24 on 09 March 2009 to +64 just a few weeks ago, that's an awfully wimpy price advance by the bulls on so many net up days. With a bullish bias of 88 up days in the Dow's step sum, plus a few-trillion-dollars spent on supporting the financial markets in the past two years, the bulls (Geithner, Bernanke and the rest of the guys injecting go-juice into the rump of the old bull) should have pushed the Dow over the top months ago. But they didn't. They may still send the Dow on up to new highs. But the Federal regulators apparently know just as much about veterinary medicine as they do about monetary policy. By now their bull must be suffering from an enlarged heart, and massive liver & kidney damage.
Ground Zero for the market crash, and the market-recovery activities of the "policy makers" has been in the Financial Stocks, and the NYSE Financial Index, its step sum isn't looking so good. The NYSE Composite Index's step sum looks much better. But suspiciously, between the two vertical lines marking the October 2007 top and the March 2009 bottom, its step sum was basically unchanged during the second deepest bear market since 1885! I expect we'll see these indexes' step sums experience a catastrophic collapse before Mr Bear is finished.

Here is a price chart of these NYSE indexes, in case you're curious.
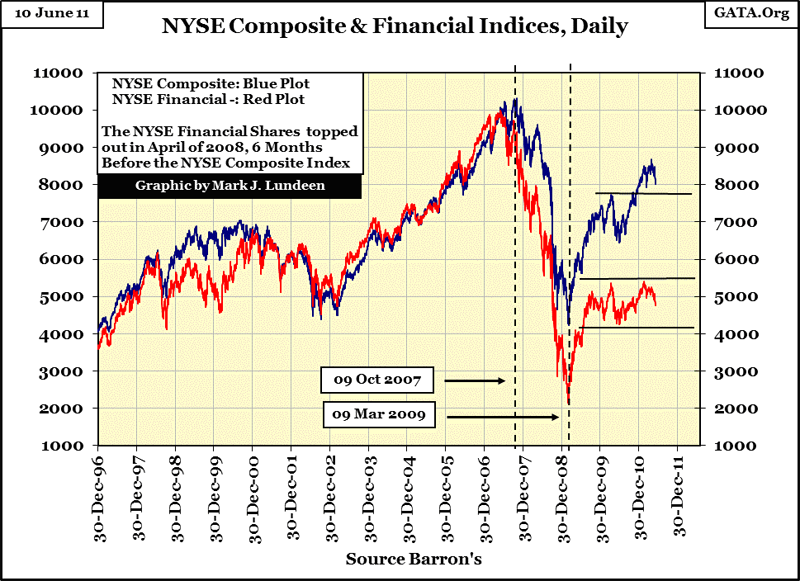
Like the Dow, the NYSE Composite can't seem to go on to new highs, and the NYSE Financials have been stuck in a trading range since August 2009. Both have turned down in the past two weeks, as the end of Dr Bernanke's QE2 looms over the markets.
The market appears to be at the cusp of a significant change in direction: from a market that was going up - to a market that will be going down. I can't see into the future, but I've given you some of my reasons for expecting the stock market to see a soft patch in the months ahead. Maybe even a major decline by November that will rival the losses seen from October 2007 to March 2009. With the termination of QE2, a horrific decline in the Dow Jones is real possibility, maybe one of those "way-better-than-house-odd's-possibilities." But if you decide to short the stock market, don't do so on my recommendation. If you're not a market insider, don't risk shorting the market! Me? I'm still recommending junk grade silver coins, and gold bullion.
Mark J. Lundeen
[email protected]
[email protected]


