Catch the Next Gold Bull Market


The next gold bull market could be just around the corner and with thought in mind; it has many traders and investors on edge, because they are worried they could get left behind. In the past few months, gold has been extremely volatile, making it difficult to hold a position for those of us who think gold could push much higher still.
We all know the market is moved by greed and fear and making decisions based on greed and fear, 9 times out of 10, leads to a bad decision, AKA a losing trade. Below is a simple strategy to average into gold, so that you will catch the next gold bull market.
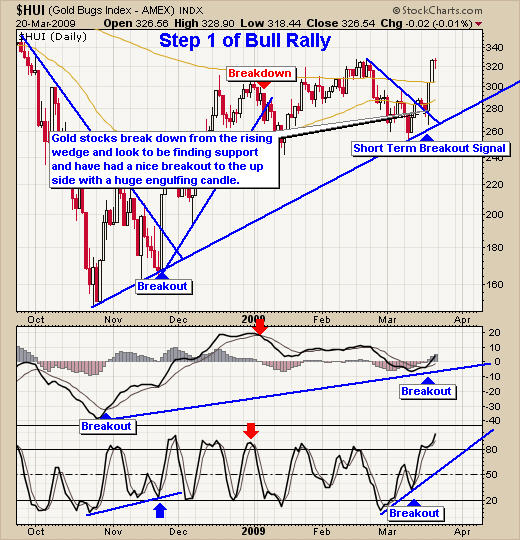
Signal #1 - The Short Term Gold Trade, Daily Chart
These trades happen once every month or so for long and short trades, depending on how aggressive you are. Some of these setups carry a high risk level, which is over 3% in my opinion, so I tend to only catch the odd trade here an there. I measure risk from my support trend line or where I would place my stop order, if the trade was to go against me. Keeping risk low is critical, because it is very easy for us to be forced out of a position due to wild price swings.
The hui chart below is an example of a short term buy signal, which happened last week. When the hui generates a buy signal, traders can purchase gold ETF's, gold stocks or bullion with a small position of their capital. These trades generally only last 2-20 days and I like to take some profits on the first sign of weakness, like a reversal candle. But sometimes other time frame charts align, giving some short term signals a very strong signal for higher prices, which is what we have going on now. These signals are shown in the next couple charts.
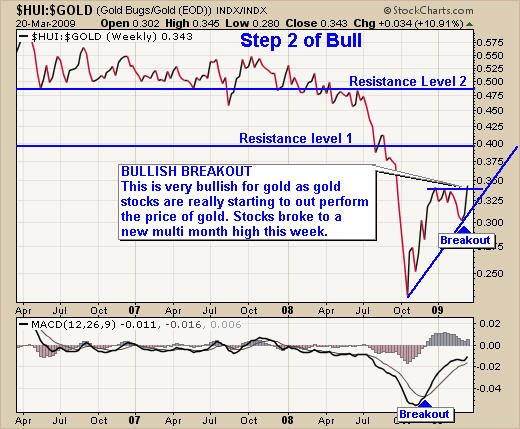
Signal #2 - The Weekly HUI:GOLD Breakout, Very Bullish
This is a very bullish sign, but until we see a clean move higher, we will not know for sure if this is a head fake or not. This chart shows the strength of gold stocks compared to the strength of gold bullion. As gold stocks start to perform better than the price of gold, this chart moves higher. Gold stocks generally lead the price of gold, so this is very bullish for this chart to breakout to a new multi month high. This chart helps tell us how strong a possible short-term trade could be.
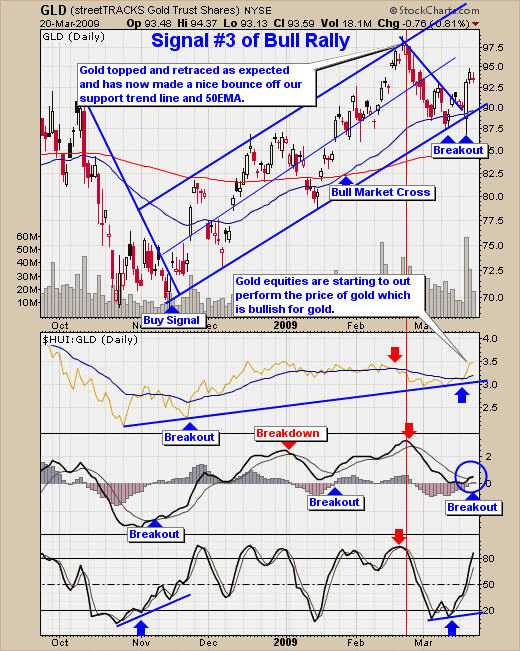
Signal #3 - Buying More on Dips, Daily Gold Chart
Signals 1 & 2 have confirmed its time to start to accumulate more of a position on pull-backs to the 50EMA and trend line support zones. This chart shows many things and could be a little over whelming, but just focus on the right hand side of the chart for the most recent setup/signal. You will notice how gold has a 50 & 200 moving average cross over, which puts gold back into a bull market. It also shows everything starting to align for a 50 moving average bounce, which also happens to be trend line support. The large reversal candle signals a buy position here. Risk is currently over 3%, so you will be trading at an increased risk.
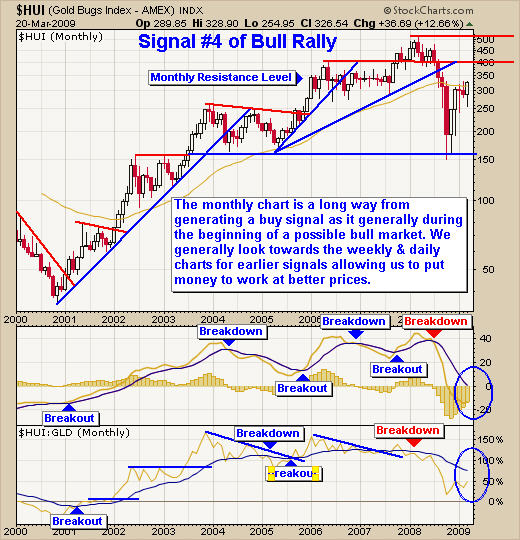
Signal #4 - The Monthly Long Term Investing Signal
Currently the monthly chart is several months away from any buy signal. We will focus on the bullish looking daily and weekly charts for entry points, while keeping an eye on the monthly chart of gold stocks.
Gold Trading Conclusion
Gold and gold stocks look to be very bullish on a short to intermediate time frame. Both have generated a buy signal in the past week and with the HUI: GOLD ratio chart breaking to a new high along with the HUI (gold stocks index) making a new multi month high, things look bright for gold.
Gold trading does carry a relatively high-risk level and that is why I focus on my trading model, which keeps risk low. My focus is to keep my risk per trade under 3% and by doing so, I can afford to have some losing trades, which still allows me to average up in gold, as it moves through the bottoming cycle towards a possible bull market again. I do the same but in reverse, when gold or oil look to be nearing a bull market top.

Chris Vermeulen has been involved in the markets since 1997 and is the founder of Technical Traders Ltd. He is an internationally recognized technical analyst, trader, and is the author of the book: 7 Steps to Win With Logic
Through years of research, trading and helping individual traders around the world. He learned that many traders have great trading ideas, but they lack one thing, they struggle to execute trades in a systematic way for consistent results. Chris helps educate traders with a three-hour video course that can change your trading results for the better.
His mission is to help his clients boost their trading performance while reducing market exposure and portfolio volatility.
He is a regular speaker on HoweStreet.com, and the FinancialSurvivorNetwork radio shows. Chris was also featured on the cover of AmalgaTrader Magazine, and contributes articles to several financial hubs like MoneyShow.com.


