This Chart Proves The Gold Market Is Bottoming


Last week's trading saw gold forming its high in Tuesday's session, here doing so at the 1879.80 figure. From there, a sharp decline was seen into late-week, with the metal dropping all the way down to an early-Friday low of 1826.80 - before bouncing off the same into the daily/weekly close.
Gold, Short-Term
From the comments made in recent articles, the last short-term bottom was expected to come from the combination of the 10 and 20-day time cycles - which forecast a rally into the first week or so of this month, with resistance to that rally noted at the upper 20-day cycle band, shown below:
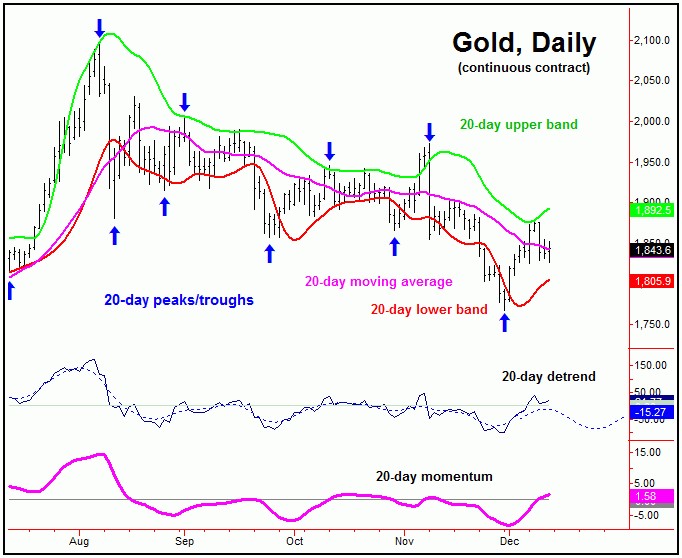
In terms of price, our minimum expected magnet with the recent rally was to the 18-day moving average, which will be seen on 85-90% on the upward phases of the 20- cycle. Having said that, last weekend I noted that additional strength was likely to be seen, due to the fact that the upper 20-day cycle band also has a strong tendency to attract price - and will also act as a resistance level.
With the above said and noted, last Tuesday's rally took gold right back to its upper 20-day band, also finding key resistance at the same. With that, the metal turned sharply lower off that band into late last week. In terms of time, we mentioned our December 9th 'reversal date' as the potential for a short-term turn in the gold market, with the next turning point noted for December 15th, plus or minus a day.
In terms of patterns, due to the configuration of the larger 72 and 154-day waves, the overall assumption was that the last rally phase with the 10 and 20-day cycles would end up as countertrend, holding below the 1904.30 figure, the prior (minor) swing top, which has so far been the case.
Stepping back then, our next larger-degree bottom is due to materialize at anytime, with at least some potential that this low formed with the recent tag of the 1767.20 figure - though there is yet no confirmation of the same. With that, the ideal path would be for the metal to drop back to or below the lows again into later this month, before the next bigger trough attempts to form.
The Chart That Proves That Gold Is Bottoming
For the mid-term, as mentioned above the next key low is expected to come from the combination of 72-day and 154-day cycles. Shown again below is the larger of these two waves, the 154-day cycle component:
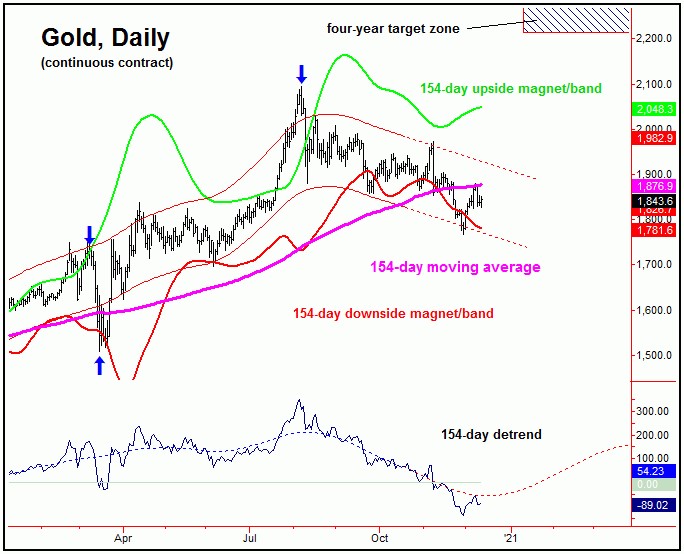
In looking at our 154-day cycle chart, of note is that our cycle/detrend indicator is forecasting the low for this wave to materialize at anytime, and with that is projecting higher prices for the coming months. In terms of time, we have a key date that we are focusing on for either a new low in price to materialize - or else a hard re-test low to occur - with the exact details noted in our Gold Wave Trader market report.
In terms of price, the downside risk was recently noted to the mid-1700's for gold. Having said that, the upside potential is to the 2212.00 - 2340.56 region going forward, which is an open target from the largest cycle that we track, the four-year component.
Adding to the notes above, the minimum upside potential - once this 154-day wave starts to turn higher - is to the upper 154-day cycle band, currently at the 2048 figure - but which is rising daily. With that, we have been advising to scale into longs into the recent weakness, in the anticipation of higher highs to follow.
Gold 2200 May Come Sooner Than Most Think
As mentioned last weekend, gold 2200 (or higher) may come sooner than most people think it can! For the longer-term view, the larger cycles are pushing higher into the late-2021 to early-2022 region. With that we see the bigger bull market as being intact, though we expect the next major peak to also occur into that same timeframe, before giving way to a larger-degree decline (with the four-year cycle) into late-2022 to Spring of 2023. Stay tuned.
Jim Curry
The Gold Wave Trader
http://goldwavetrader.com/
http://cyclewave.homestead.com/


