COMEX Gold Into Summer


Five weeks ago, we wrote that sharply negative real interest rates were going to drive prices higher in the weeks ahead, and so far that forecast is playing out as expected. So what happens next? That's the subject this week.
So I guess that, first of all, we should start with the link to that post from April 13. The price of COMEX gold had clearly double-bottomed at the expected support level of $1680. However, price had only recovered about $60 at that point and many "experts" were calling for even deeper lows in the weeks ahead. I strongly disagreed with that for reasons explained in this post:
In short, the March CPI had jumped to +2.60% and, with 10-year treasury note rates at 1.65%, the inflation-adjusted or "real" interest rate had suddenly fallen to -0.95%. This was noteworthy because the last time real rates were near -1.00% was August of 2020. And what was COMEX gold trading at then? All times highs near $2100.
This created an obvious market inefficiency that would soon be exploited and corrected. What you've seen in the five weeks since is a closing of this gap.
However, real interest rates have only gotten more deeply negative, too, as the April CPI that was released last week showed an annualized inflation rate of +4.2%. With the yield on the 10-year note still at 1.65%, this places the inflation-adjusted return at -2.55%! Awareness of this is slowly seeping into the general investment world, but it seems that many are still enchanted by Chairman Powell's "transitory" nonsense.
Real yields are getting more negative again, even as nominal 10-year Treasury yields remain somewhat rangebound.
— Lisa Abramowicz (@lisaabramowicz1)
And maybe I should stop here to explain two things about this "transitory" stuff.
- The bludgeoning use of "transitory" is only Powell's first foray into jawboning Yield Curve Control. He's trying to convince bond investors to keep buying U.S. debt with less than a 2.0% yield by reassuring them that inflation is not going to stay at the current levels.
- The inflation you're seeing is NOT transitory. The U.S. is currently experiencing BOTH inflation drivers. And what are those? The "cost-push" inflation of rising input costs such as copper, lumber, sugar, corn, soybeans, etc. But also "demand-pull" inflation where government transfer payments and higher wages leads to too many dollars chasing too few goods.
So real rates are going to stay negative, and they'll move even more negative in the weeks and months ahead. This makes physical gold (and silver) look extremely attractive when compared to the traditional bedrock /foundational investments in U.S. debt. Higher demand equals higher prices, even in the Den of Thieves and Vipers that is the COMEX.
But gold is also making a move on the chart that we've been monitoring at TF Metals Report since mid-April. And what's that? Back on April 15, and with price at $1755, COMEX gold broke up and through its 50-day moving average. Was this a big deal? YES! Why?
The chart below is what we caught that day. The year 2019 was a strong continuation of the bull market for gold that began in November 2018, when nominal and real (there's that term again) rates peaked and The Fed was forced to shift policy and move toward easing. Twice in 2019, the price of COMEX gold broke down below its 50-day moving average and then moved sideways and down in what's called a "bull flag consolidation". As you can see below, both of these consolidations ended after about 90 days and then price began to trend higher again.
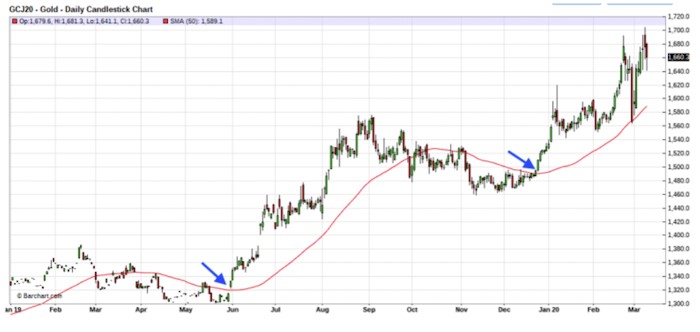
If you look closely, the first post-flag rally was about 19% in 90 days and the second was about 13% in 80 days. So I asked the TFMR members...Since we're still in a bull market, and since it's clear that we just ended another bull flag consolidation with that double bottom in March, why shouldn't we now expect a rally into early summer?
And if, from $1750 on April 15, the price of COMEX gold was to rally 15% over the next 80-90 days, where would that put it? As such, our target has since been $2000 by early July.
You might note next that, as of this moment on Tuesday, May 18, we're about 40% through the timeframe and price is about 45% to our target.
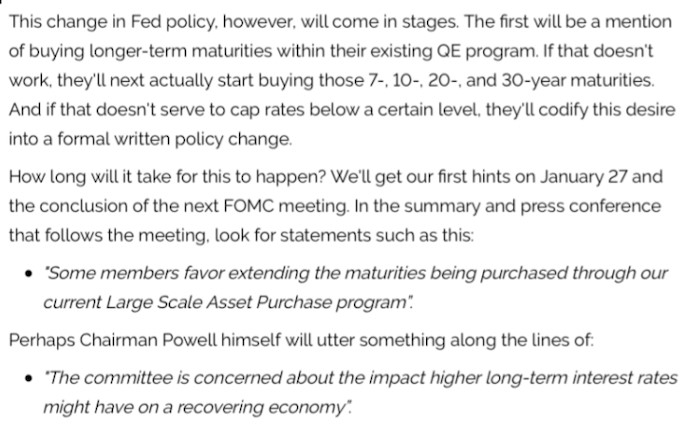
What's next that will drive price to our early summer goal? More inflation and a June FOMC that will NOT include any discussion of "QE taper" or a fed funds rate hike. Instead, you're going to hear about this little beauty that was released late last Friday - and went largely unnoticed by the global investment community.
And what's that? Remember, "transitory inflation" is simply Powell's first move at jawboning Yield Curve Control. Step number two is an adjustment to the current QE program where The Fed moves toward buying more longer-term maturities. This move will ease the current crowding out pressure on short rates while providing some buying support for longer rates. And that's exactly what The Fed announced last Friday! So here's another link. This was posted on January 19, and it certainly seems to be working out pretty well:
So let's put all of this together...
- Inflation is here to stay and getting higher.
- By holding long-term rates flat below 1.75%, The Fed is promoting sharply negative real rates.
- The chart suggests at least another $100 of price rally over the next six or seven weeks.
And finally, this is all playing out as we forecast back in January. The move back to $2000 will not be the highs of the year. Price may pause there for a few weeks and move to consolidate again, as that's just simply how markets operate. However, as we move into August and then Q4, price will rally again and the targets we laid out in January will come into view.
What does this mean for you? Now is not the time to be waiting for a pullback in price to add some physical metal. I'm not waiting for any dips to add to my mining shares, either. All of our forecasts and goals for 2021 are still in play, and I fully expect them to be realized in the months ahead.
*********
 Craig Hemke began his career in financial services in 1990 but retired in 2008 to focus on family and entrepreneurial opportunities. Since 2010, he has been the editor and publisher of the TF Metals Report found at TFMetalsReport.com, an online community for precious metal investors.


