The Coming Market Crash Will Set Off The Biggest Gold Panic Buying In History


The leverage in the economic system has become so extreme; investors have no idea of the disaster that is going to take place during the next stock market crash. The collapse of the U.S. Housing and Investment Banking Industry in 2008 and ensuing economic turmoil was a mere WARM-UP for STAGE 2 of the continued disintegration of the global financial and economic system.
While the U.S. and the global economy have seemingly continued business as usual since the Fed and Central Banks stepped in and propped up the collapsing markets in 2008, this was only a one-time GET OUT OF JAIL free card that can’t be used again. What the Fed and Central Banks did to keep the system from falling off the cliff in 2008 was quite similar to a scene in a science fiction movie where the commander of the spaceship uses the last bit of rocket-fuel propulsion in just the nick of time to get them back to earth on the correct orbit.
Thus, the only way forward, according to the Central banks, was to increase the amount of money printing, leverage, asset values, and debt. While this policy can work for a while, it doesn’t last forever. And unfortunately, forever is now, here….or soon to be here. So, it might be a good time to look around and see how good things are now because the future won’t be pretty.
To give you an idea the amount of leverage in the markets, let’s take a look at a chart posted in the article, A Market Valuation That Defies Comparison. The article was written by Michael Lebowitz of RealInvestmentAdvice.com. I like to give credit when credit is due, especially when someone puts out excellent analysis. In the article, Lebowitz stated the following:
The graph above highlights that valuations using this measure dwarf any prior valuation peak since at least the 1950’s. At over 350% above the mean, stock investors are currently paying significantly more for a unit of economic growth than at any time in the last 70 years. To extend the analysis, we estimated the adjusted CAPE level of 1929, as shown on the graph, and come to the same conclusion.
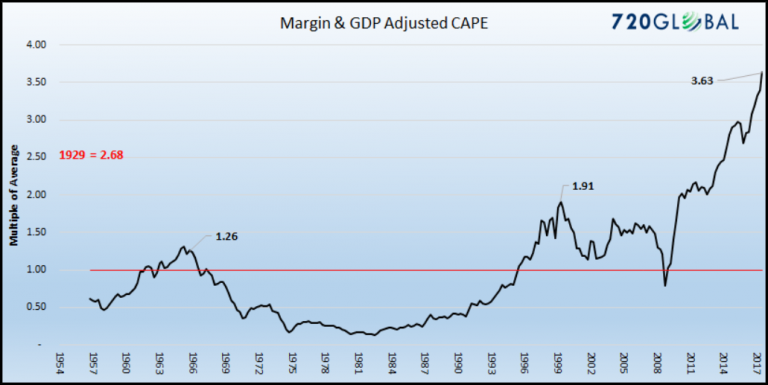
Most astute investors know that stock valuations are at or near historical highs. Even these investors, however, may be unaware that today’s valuations, when adjusted for the level of economic growth and heightened profit margins, defy comparison with any prior period since the Great Depression. The simple fact is that investors are paying over three times the average and almost twice as much as the prior peak for a dollar of economic growth. Furthermore, it is happening at a time when we are clearly late in the economic cycle and the outlook for growth, even if one is optimistic, is well below that required to justify such a level.
The ratio in the chart comes from companies’ profit margins and the GDP (Gross Domestic Product) adjusting CAPE (cyclical average price to earnings). The important takeaway in the chart is that this ratio today (3.63) is much higher than in 1999 (1.91) or right before the 1929 Great Depression (2.68). Thus, the author is suggesting that investors are paying over three times the average for a dollar of economic growth. While this can continue a bit longer, the higher it goes, the bigger correction and return back to normal levels.
When the markets correct, I believe they will correct violently…. or most likely crash at some point. Thus, the next market crash will cause the largest panic gold buying in history.
Setting Up The Foundation For Coming Gold Panic Buying Market
To understand the staggering amount of investor gold buying during the next market crash, we need to take a look at past trends in the gold market. For example, there are three different volumes of global gold investment. Actually, there is a fourth, Central Bank gold demand, but I am going to exclude it to focus only on private investment.
First, we have total global gold coin and bar demand. As we can see in the chart below, global gold coin and bar demand increased significantly during the 2008 U.S. Housing and Investment Banking Collapse. Gold coin and bar demand nearly doubled to 875 mt (mt) in 2008 from 442 mt in 2007:
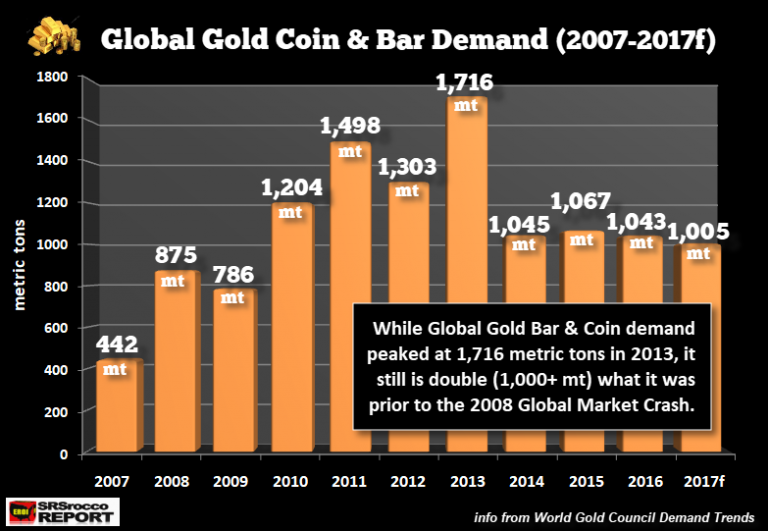
As the gold price reached a peak of nearly $1,900 in 2011, gold coin and bar demand shot up to 1,498 mt. However, as the price of gold fell by $500 in the first half of 2013, investors seeing an excellent bargain, purchased a record 1,716 mt of physical gold investment. But as the gold price continued to fall and remain weak in 2014, 2015 and 2016, gold coin and bar demand stayed flat at a little more than 1,000 mt.
Furthermore, as the stock market took off after the election of President Trump to the Whitehouse and as Bitcoin and the Cryptocurrencies experienced nosebleed percentage gains, demand for physical gold investment fell even lower in 2017.
Even though physical gold investment demand over the past four years is less than during the 2010-2013 period, it is still more than double than what it was in 2007, before STAGE 1 of the Collapse… the infamous Subprime Housing Meltdown.
Global Gold ETF Demand… The Nasty Wild Card
While many investors in the alternative media community don’t believe that the Gold ETF’s hold all the gold they report, I look at this market as one of the most important indicators, or better yet, the critical Wild Card. I really don’t care if these Gold ETFs hold all the metal they claim. If you are a prudent precious metals investor, you will hold most (if not all) of your gold physically. However, the Gold ETFs provide us with the most important indicator in the gold market.
Why, because a large percentage of Gold ETF demand comes from retail investors. Most precious metals diehard investors only believe in purchasing real physical metal. So, when we see significant changes in the Gold ETF market, then it means the 99% of retail investors in the market are waking up. The two largest increases in Gold ETF demand (and their inventories) were during two fearful market events… Q1 2009 and Q1 2016:
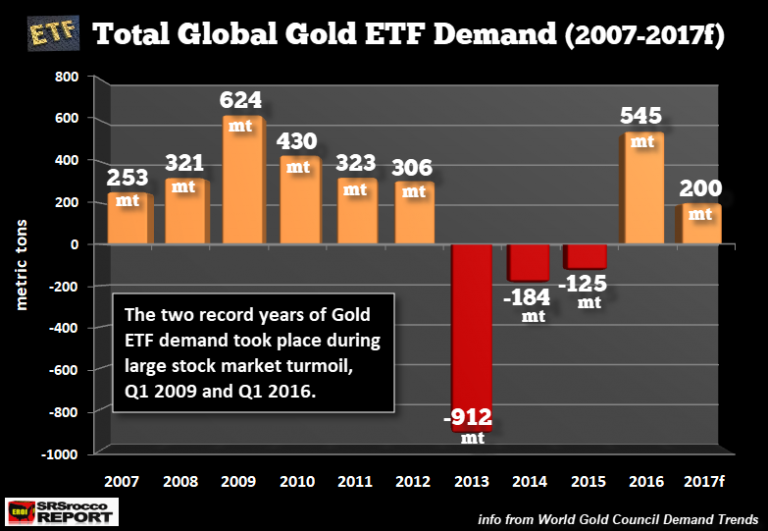
Of the total 624 mt of Gold ETF demand in 2009, 465 mt of that amount took place during the first quarter when the Dow Jones Index was falling to its gut-wrenching lows of 6,600. Retail investors were in panic mode, so they were moving into Gold ETFs in a big way. Thus, 75% of total Gold ETF demand in 2009 took place during the first three months of the year.
The next highest amount of Gold ETF demand was in 545 mt in 2016. However, 350 mt or 64% of total Gold ETF demand that year also took place during the first quarter when the Dow Jones Index fell 2,000 points. Something seriously spoked retail investors to plow back into gold during that period. Moreover, as the Dow Jones was falling 2,000 points, the gold price was shooting higher by $200. So, individuals who believe gold will selloff down to $750 with the next market crash, need to REREAD the sentence above.
Okay, getting back to the Gold ETF chart. As the stock markets recovered in 2010, even as the price of gold surged to $1,900, Gold ETF demand continued to fall to a 306 mt in 2012. However, as the gold price lost $500 in 2013, retail investors sold off their Gold ETF investments in record numbers. As we can see, Gold ETF inventory liquidations were a stunning 912 mt in 2013. As retail investors were selling their Gold ETF investments, precious metals investors around the world were buying physical gold, HAND OVER FIST. It was in 2013 that global gold coin and bar demand surged to 1,716 mt.
After the initial gold price smash in 2013, Gold ETF liquidations were reduced to only 184 mt in 2014 and 125 mt in 2015. Again, it wasn’t until the stock market suffered what investors thought as a worrisome correction, did Gold ETF demand returned in a big way in 2016. And as the stock and crypto markets shot up towards the moon and stars, Gold ETF demand declined considerably in 2017.
Again, I am not going to debate whether or not the Gold ETFs hold all the gold they claim. If you are smart, you own physical gold and if you want to trade profits, then using Gold ETFs for that purpose is understandable… but not to PROTECT WEALTH, only to trade for profits.
Total Gold Investment Demand Fluctuates Due To Fickle Retail Investors
If we combine gold coin and bar demand with Gold ETF demand, we have another chart. This chart represents the NET global gold investment. As we can see, total global gold demand was the highest in 2011 when the gold price shot up to $1,900 in September of the year:
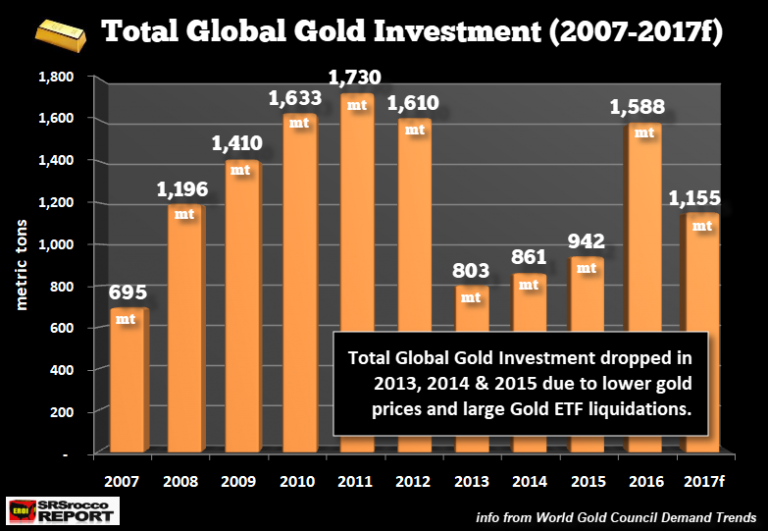
After the 2008 U.S. Housing and Investment Banking collapse, and as the gold price recovered, total global gold investment increased from 695 mt in 2007 to a peak of 1,730 mt in 2011. It wasn’t until 2013 when the gold price lost $500 did the massive global Gold ETF liquidations impact overall demand by cutting it in half to 803 mt versus 1,610 in 2012. And as I mentioned above, total global gold investment didn’t rise until FEAR in the markets reappeared at the beginning of 2016 when retail investors flocked back to Gold ETFs.
While global gold investment is forecasted to decline in 2017 to 1,155 mt, due to investors placing their bets in the rapidly rising stock and crypto markets, I believe this is the CALM before the STORM. Unfortunately, retail investors have been lured to sleep by rising asset values that they don’t realize the market is setting up for one hell of a correction-crash.
What Record Gold Investment Will Look Like When The Markets Finally Crash
By looking at previous record years of gold coin and bar investment as well as Gold ETF demand, we can estimate how much total gold investment will increase during the next market crash. For example, there was 624 mt of Gold ETF demand in 2009 and 1,716 mt of gold coin and bar investment in 2013:
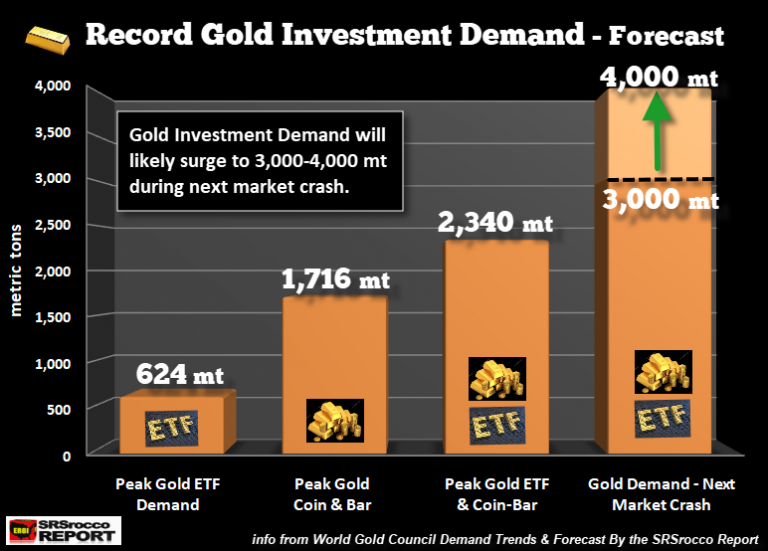
If we add these two previous record years together, we end up with a total of 2,340 mt of total gold investment. Now, this figure represents what has already taken place in the gold market during both peak periods of gold investment demand. However, if we estimate the kind of demand that would take place during the next market crash, it can undoubtedly reach 3,000 mt or even 4,000 mt during a full-blown market meltdown.
Investors need to realize that the decade-long Fed and Central Bank band-aid of massive money printing and exponentially rising debt levels since the 2008 market crash has not fixed the problem, it has only made it worse. They have inflated asset values of stocks, bonds, and real estate to such high levels; a normal market correction will turn into a panic crash. The next market crash will be like nothing we have witnessed before. Thus, panicked investors will move into the safe-haven gold market in record numbers.
I believe we could easily see 1,000+ mt of global Gold ETF demand and 2,000+ mt of gold coin and bar investment during the next market meltdown. However, total global gold investment demand could approach 4,000 mt and exceed it if the Fed and Central Banks lose control of the markets. And, it’s not a matter of “IF,” it is a matter of “WHEN.”
According to the World Gold Council, total gold demand in 2016 was 4,350 mt, with total gold investment demand of only 1,587 mt. Thus, gold investment accounted for only a little more than a third of overall gold demand last year. When global gold investment demand surges to 3,000 or even 4,000 mt, where is the supply going to come from when investors around the world realize the GIG is up?
Lastly, the critical WILDCARD in the gold market is the retail investor. The retail investor accounts for 98-99% of the market. So, when the retail investor gets spooked as FEAR starts to motivate their investing decisions, we could see insane Gold ETF demand. Unfortunately, there may not be enough physical gold to go around. Thus, Gold ETFs may not be able to access the metal to increase their inventories in relationship to rising demand.
So, it makes perfect sense that the real FIREWORKS in the gold market will take place where 99% of the market makes the decisions. While the 1-2% of precious metals investors would most certainly increase the gold and silver holdings during the next market crash, it’s the retail investors that will totally overwhelm the gold market.
Keep an eye on Gold ETF demand as it will be the crazy WILDCARD.
COURTESY OF SRSrocco Report.

Independent researcher Steve St. Angelo (SRSrocco) started to invest in precious metals in 2002. Later on in 2008, he began researching areas of the gold and silver market that, curiously, the majority of the precious metal analyst community have left unexplored. These areas include how energy and the falling EROI – Energy Returned On Invested – stand to impact the mining industry, precious metals, paper assets, and the overall economy. He has written scholarly articles in some of the top precious metals and financial websites. Visit his website SRSrocco Report.


