Consolidations and Corrections


The gold market lately has left many veteran analysts and gold experts baffled, and made many of them look amateurish, as many have advised their readers to exit the market in anticipation of a sell off. My articles are never intended to criticize, as a technician, I'm the first to admit that technical analysis has its limitations. I've been wrong before, and I'll be wrong again, but if you have read any of my previous articles, you know I make my calls and I stand by them. I have no trouble admitting when I am wrong, and have less trouble exiting the markets when proven wrong. Pride has zero value in the market place. Many subscribers and readers of my articles are eager students of the markets, and the one topic which raises a lot of interests is: what is the difference between a consolidation and a correction, and how can we recognize it in a timely manner? The current gold market provides us an opportune time to examine these issues, as learning in real time makes more sense than looking at past data, I do not believe in back testing.
Consolidations and corrections
Others may have their own interpretations, but for me, this is how I look at them.
Consolidation - is a price congestion which may violate vertical support (VS), but not horizontal support (HS). Consolidations could appear in patterns of a flag, pennant, triangle, channel, and sometimes, what technicians call a "running correction".
Correction - is a price retracement which may violate both VS and HS. Corrections within a bull market often retrace to test the 50ema, and if support fails, all the way back to the 200ema.
Obviously, in a raging bull market as gold is in right now, we want to hold our positions during a consolidation, to take advantage of the eventual breakout and higher prices. But corrections in bull markets could be very severe and punishing for late comers, therefore, taking partial profits is prudent. The ability to recognize the difference could help us to better bottomlines, and to avoid any unnecessary fancy maneuvers.
Consolidation
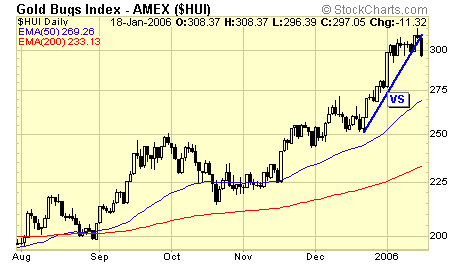
A couple of weeks ago, $HUI violated VS, or commonly referred to as trendline support among subscribers. My advice was to stay the course, and not to take profits until HS has been violated…
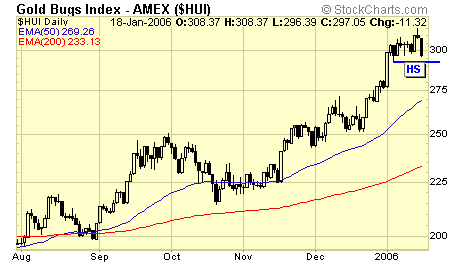
Until HS is violated, the best assumption we have is a consolidation or running correction taking place, and not the beginning of a correction, therefore, hold all positions. The 4% drop in one day was enough to entice even the seasoned traders to leave the market.
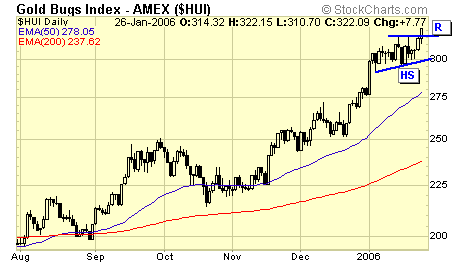
The market obliged, and we have a breakout, not a breakdown as some analysts have anticipated. HS held and resistance was broken.
Correction
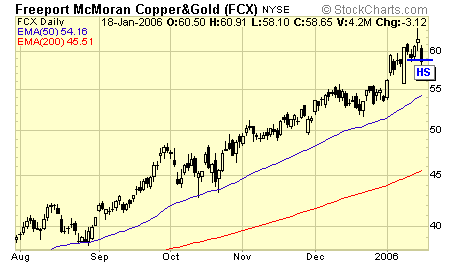
FCX violated HS on 1/18, therefore, a correction was in progress and the likely target was the next HS near $55 and near the 50ema.
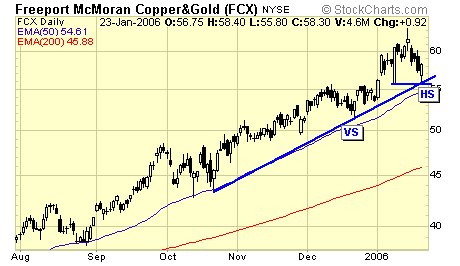
And when prices corrected to the next HS, and finds congruent support with VS just above the 50ema, the reversal on 1/23 provided us a low risk set up to buy the FCX, and a buy alert was sent out to be executed MOC (market on close).
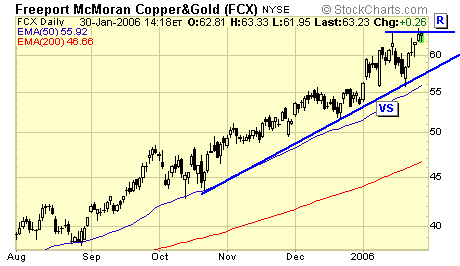
The call was timely, and prices are now at resistance. Nimble traders can take partial profits and buy back upon a small consolidation, and conservative traders simply place a stop at breakeven and enjoy the ride.
Summary
Technical analysis has a poor reputation among conventional investors because most associate TA with market forecasts. Many turn to TA thinking that there must be a way to decipher past patterns so that they can predict future patterns. The gold market is now in territories that many of us are not familiar with, and trying to pick a top based on past patterns is doomed to fail. At Traderscorporation, we simply follow price action and stay invested in the market, for as long as it will allow us. Guessing when gold will top is not an alternative.
Jack Chan at www.traderscorporation.com
31 January 2006

Jack Chan is the editor of Simply Profits, established in 2006. Chan bought his first mining stock, Hoko Exploration, in 1979, and has been active in the markets for the past 37 years. Technical analysis has helped him filter out the noise and focus on the when, and leave the why to the fundamental analysts. His proprietary trading models have enabled him to identify the NASDAQ top in 2000, the new gold bull market in 2001, the stock market top in 2007, and the US dollar bottom in 2011.


