Corporate Bond Yields Are Spiking - Again


Monday was an interesting day in the stock market, for what’s it’s worth – as reported by CNN Business.
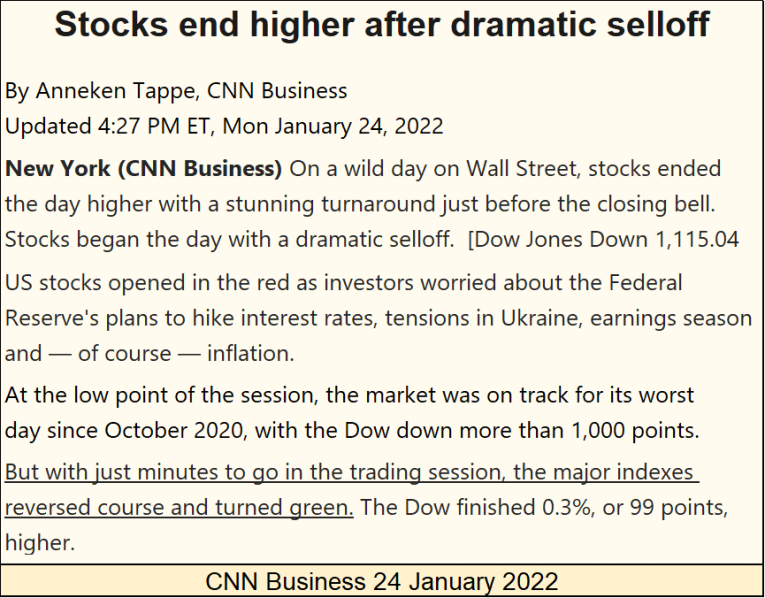
https://www.cnn.com/2022/01/24/investing/dow-stock-market-today/index.html
Monday, January 24th the Dow Jones saw another miraculous ascension. After the Dow Jones deflated 1,115 points from its previous close, it closed up 99 points for the day. The recovery may have been from “investors” wanting to scoop up the “incredible bargains” they saw at the bottom of the trading day. This was a common thread I heard in the financial mainstream media.
But that isn’t the way I see it. Nope, I’m with George Stephanopoulos of ABC News below, where on his show; Good Morning America’s program of 17 September 2001, George talked about the Plunge Protection Team, and what the PPT does when markets begin free falling.
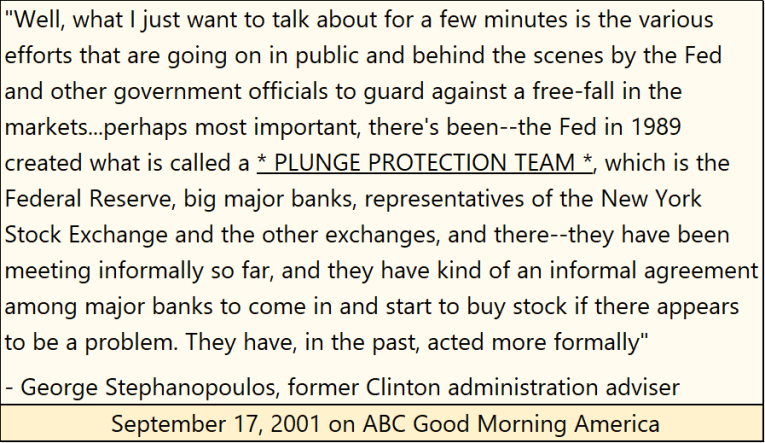
George was talking about the PPT twenty years ago during the January 2000 to October 2002 High-Tech Bear Market. Since then, there has been the October 2007 to March 2009 Sub-Prime Mortgage Bear Market and the February - March 2020 flash crash.
No 21st century bear market has been allowed to bottom at the lows natural market forces would have insisted upon. Bear-market lows necessary to clear the financial system of past ill-considered investments by banks, corporate officers and yes – the public. Instead, for over twenty years the financial establishment has been practicing bear-market interruptus, where officialdom enters the markets and aborts the bear market before term with massive “injections of liquidity.”
In effect, the PPT, which ABC News admitted existed over twenty years ago, was created to “monetize” financial-toxic waste created during the stock market’s boom phase. Financial toxic-waste which threatens to upset the “policy makers” control of the financial system during the bust phase of the stock market.
The idiot savants at the FOMC do what no sane money-manager would, or could ever do. During periods of market distress, they purchase trillions-of-dollars of junk assets at full-face value; such as non-performing mortgages and junk-grade corporate bonds issued by zombie corporations. Their purchases funded with monetary inflation.
Doing this (purchasing {monetizing} worthless assets at face value) solves no actual problem present in the economy. No, doing this they instead create a vastly larger problem; that of pushing the confidence backing the fiat US dollar to its breaking point.
Luo Ping, director general of the China Banking Regulatory Commission, way back in February 2009, during Dr. Bernanke’s first quantitative easing clearly defined the dollar’s problem in the quote below.
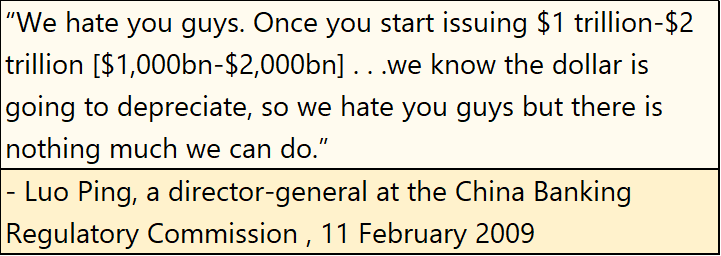
Back in February 2009, this quote by Luo Ping inspired some humor in the financial media when it became public. I didn’t think it was funny. None of it; the above quote, Bernanke’s QE #1, or the financial media’s reaction to it.
Thirteen years, and seven-trillion dollars of additional QE later (Chart below), apparently the idiot savants at the FOMC, and members of the financial main stream media, still don’t understand this reckless expansion of dollars’ connection to CPI inflation, and its ultimate impact on the purchasing power of the dollar. Or they do, but don’t care about the ever-shrinking purchasing power of the dollar they are charged with protecting.
What they, and most people do care about is keeping financial assets’ over inflated valuations – over inflated. If the FOMC has to blowout their balance sheet to even more grotesque levels by purchasing additional garbage assets, as seen below, to keep market valuations overvalued, be assured, this is one commitment they will keep.
I usually save any ranting I do for the bottom of my articles. But seeing what happened last Monday really got to me. But now here we are, with the Dow Jones’ BEV Chart below.
The Dow Jones’ last BEV Zero (new all-time high) was seen three weeks ago on January 4th. Since that time, the ability for the Dow Jones to remain inside scoring position (within 5% of its last all-time high) has diminished.
Yesterday, the Dow Jones closed with a BEV value of -7.17%. Seeing the Dow Jones with a BEV of -7.17% during a bull market usually isn’t something to comment on, or be concerned about, as one expects that to happen. But from November 2020 to November of 2021, for a full year the Dow Jones didn’t close below scoring position, making yesterday’s BEV of -7.17% something to take note of.
And it isn’t only the Dow Jones having an increasingly difficulty time staying above their BEV -5% lines.
Below I have two tables for my Major Market Indexes BEV Values. The upper table was from the first week of last November. The lower table for the close of this week. In the first week of early November, these indexes made sixty-two new all-time highs (Pink BEV 0.00%) in the table above.

Comparing the top table with the lower, the stock market in 2022 is beginning to have difficulty remaining inflated.
I believe the problem with the stock market can be seen below, comparing the performance of the major market indexes to commodity prices since the first week of last November, twelve weeks ago. The major market indexes (Left Table) have only one index with positive gains; the Dow Jones Utility Average. All other major market indexes are down from where they were last November.
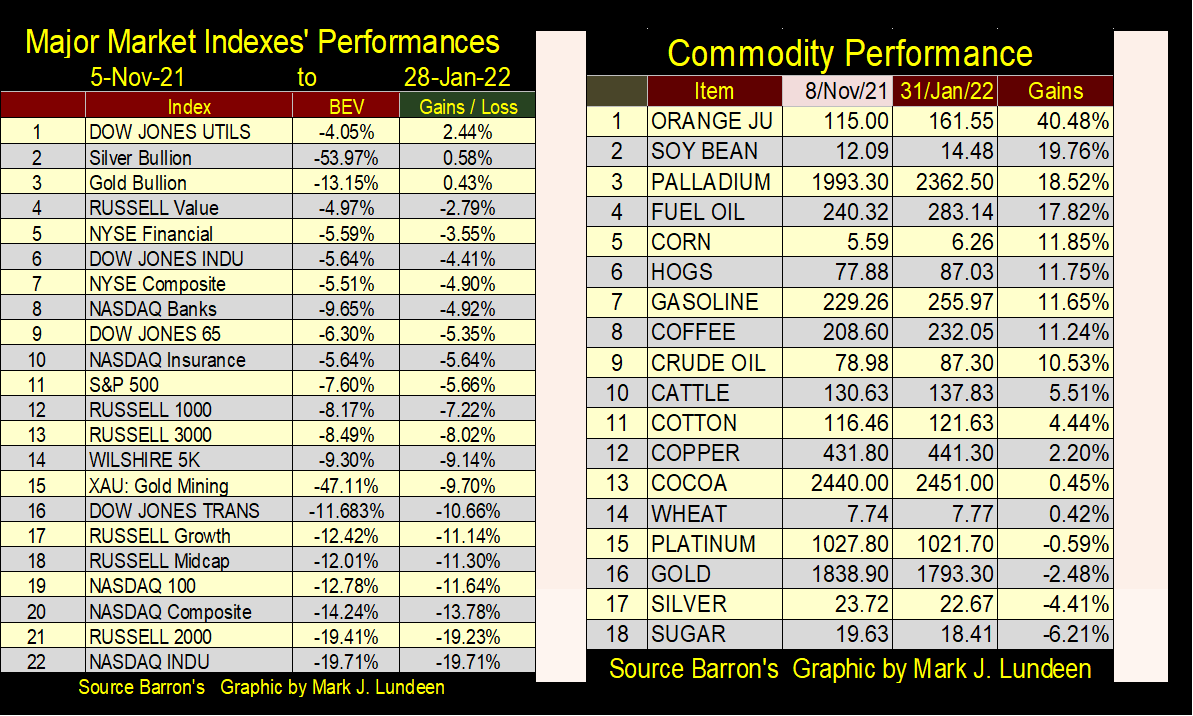
Now compare the market indexes to the gains seen in commodity prices on the left side of the graphic above. After forty years, CPI inflation has once again raised its ugly head, and the stock market doesn’t like it.
The performance for gold and silver in the tables above are not identical, as in the left table they are spot price taken on Friday. In the right table they are futures prices (nearest contract) taken on Thursday.
Moving on to the Dow Jones in daily bars below, this week saw crazy volatility to the downside, but recouped most of their losses before the close of daily trading, or actually saw the day close to the upside.
Look at what happened this week in the black rectangle. I can’t recall five consecutive days’ trading that could compare to what I’m looking at in the chart above. I believe the FOMC’s idiot savants had a busy week.
Looking at the weekly changes in the Federal Reserve’s balance sheet below, last week they “injected” an additional 86.27 billion dollars into the financial system, this week only 16.53 billion. I say only 16.53 billion for this week as that is how things now roll in our world. But before the sub-prime mortgage bear market, before October 2007, the FOMC used to inject into the financial system around 2.75 billion dollars * A MONTH *.
Looking at the size of the FOMC’s periodic “injections of liquidity” into the financial system over the decades (chart below), it’s evident the “policy makers” have never recovered from their 2002 to 2007 sub-prime mortgage debacle. And since they’ve had to terminate their Quantitative Easing abruptly in October 2019, and Fed Chairman Powell was forced to implement his Not QE#4 to first rescue the overnight repo market in October 2019, and then the stock and corporate bond markets in March 2020, I don’t think being a central banker is much fun as it was before.
Looking at Kitco.com’s gold chart below, gold almost broke above $1855 on Tuesday this week (Blue Plot). The “policy makers” couldn’t live with that. Gold was down the next three days, with Friday’s action not shown below.
What was so problematical with gold closing above $1855? This problem can be seen in gold’s BEV chart below. Gold closing above $1855 would have had gold within the psychologically important 10% from its last all-time high of August 2020. And every idiot at the FOMC knows this was something that cannot be allowed.
I’m not worried about what a bunch of idiots thinks of this, that, or the other thing in the financial markets. Gold is going to breakout and zoom past its last all-time high of August 2020, just as surely as the stock market has a day-of-reckoning with Mr Bear sometime in the future.
Why believe this? Go back and take another look at the performance between the major market indexes and commodity price increases in the graphic above. Rising CPI inflation is going to crash the stock market as soon as the bond market once again demands an inflation premium. When bond buyers demand a yield higher than the rate of inflation, a yield that provides a real world, profitable rate of return. Because right now buying bonds at current yields is a mug’s game.
In fact, as seen in the chart below, since the first week of January, corporate bond yields are actually spiking upwards right now. We see the yield spike in March 2020, as the stock market was in the grip of its flash crash. The table on the left side documents the magnitude of the “injections of liquidity” required to reinflate the stock market * AND * “stabilize yields” in the corporate bond market.
Two years later in January 2022, the yields for Barron’s Best Grade Corporate Bonds (Blue Plot Below) have begun spiking once again. They’ve doubled since the first week of January, rising from 1.32% in Barron’s 03 January 2022 issue, to 2.60% in this week’s issue. This is a massive spike in bond yields in only a few weeks! Should this yield spike level out, it most likely will be no big thing. But due to the market’s justifiable concerns of rising price inflation, I’m expecting more, much more to come as 2022 moves ever closer to 2023.
But then, we see above how the “policy makers” stabilized bond yields in March / April 2020 with their Not QE#4. Will we see another Not QE to “stabilize” these bond yields once again? I suspect we will.
Gold in its step sum chart below could look better. Gold’s price plot (Blue / Market Reality) should be above its last all-time highs of August 2020. But it’s not as the price of gold is fixed in the paper futures market, which are dominated by bearish goons, the hired guns of the “policy makers.” But this too shall pass.
Gold’s step sum (Red Plot / Market Sentiment) is rising, indicating market sentiment for gold is positive, and for good reason as laid out above.
Alfred below remains confident the bull market for the Dow Jones continues. And he may be right to believe this. Yes, there are a multitude of market trends now in motion to justify a bearish stance on the stock market.
But I’m stubborn. I want to see a few days of extreme volatility; Dow Jones’ 2% days before I give up seeing additional new all-time highs for the Dow Jones. I keep in mind how the Dow Jones is still within 10% of its last all-time high, 7.17% to be exact. The stock market at this week’s close may be down from its highs of early January, but it’s too early to speculate whether the Dow Jones now in a bear market.
But, isn’t selling near the top of a bull market always more profitable than waiting to exit during a bear market? Yes it is. So, if my readers wanted to sell everything, and go into precious metals assets, or even cash in the next few weeks, I wouldn’t attempt to talk them out of doing so.
Last, but not least are the step sum tables for gold and the Dow Jones. For gold, on Tuesday it almost slipped above its BEV -10% level. But as noted earlier, that was not to be, at least not this week. Still, gold is looking positively neutral, something the Dow Jones side of the table below doesn’t look like. The big price advances for gold may be just days away. And then again, maybe not.
This week the Dow Jones’ 15-count declined to a very oversold -9. That is something not seen every day, as seen in how frequently the Dow Jones has closed with a -9 15-count in the last half century. In the table above, the Dow Jones has closed at a -9 15-count for only 110 daily closings since December 1970. And as also seen above, these 15-counts come in groups of two or more. So maybe the Dow Jones has seen these groups of -9 15-counts less than forty times since December 1970.
Seeing the stock market this oversold should indicate it’s due for a nice bounce off its lows. During a bear market, maybe the bounce will only be a bullish correction within the context of the larger bear market. But a bounce is a bounce, as the stock market doesn’t like being this oversold.
But since the Dow Jones last all-time high on January 4th, the Dow Jones has only declined 7.17% from it. We’re very near to a market top for the Dow Jones. How can its 15-count, now be a very oversold -9? And what kind of low is a BEV of -7.17% for a market this oversold to bounce off of?
Before the March 2020 flash crash saw a 15-count of -9, the Dow Jones was down by 14%. Before the sub-prime mortgage bear market saw a 15-count of -9, the Dow Jones was down by 40%. And here in January 2022, the Dow Jones has a 15-count of -9 before it has deflated below its BEV -10% line? Weird.
What kind of predictions can I make of all of this? Only that the Dow Jones in late January 2022 will continue to be very interesting.
Last, but not least is a forty-five-minute video of someone who has new information on the 1963, President Kennedy Assassination, and other items that could very well upset your world view.
https://2020electioncenter.com/watch?id=61f320322af2dd1fc0f48f26
Is all this real? Well, I wasn’t at JFK’s assassination so I can’t say. But considering all the dysfunctional activity happening in Washington DC, and Washington DC has been dysfunctional for many decades, I believe it could very well be. Take a look at it and come to your own conclusions.
If you like the above video, you’ll may also enjoy the one below on Dorothy Kilgallen. Dorothy Kilgallen was very well-known media personality in the 1950s and first half of the 1960s. She was also an influential columnist whose opinions were published in many of America’s newspapers. She had a voice that millions of Americans listened too.
She was a friend of President Kennedy, and she didn’t believe the official investigation’s conclusion that her friend’s death was by the hands of a single shooter in Daily Plaza in Dallas, Texas. Which I don’t either. Her book on the Kennedy assassination was never published as she passed away before her time, under mysterious circumstances.
This video is two hours long. If you have the time, it’s worth watching.
https://www.youtube.com/watch?v=VYDaqto22NY
Mark J. Lundeen


