Crisis Trading In Precious Metals


The word “crisis” in Chinese is danger/opportunity.
Ancient Chinese wisdom has taught us that when there is danger, there is opportunity.
1987.
2000.
2008.
Now.
Current market condition has wreaked havoc in all sectors, stocks, ETFs, currencies, and bonds.
Gold sector was enjoying a nice uptrend since bottoming in 2016, and that too, was derailed, as liquidity became tight.
We are still holding a 20% core position on GDX, and will continue to do so. However, we now see a great opportunity for trading the GDX, until a major trend is established again.
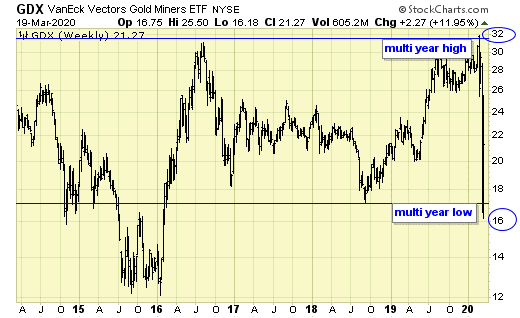
GDX reached a multi-year high of $32 in Feb, in a false breakout (hindsight), and then within three weeks, broke down to a multi-year low at $16.
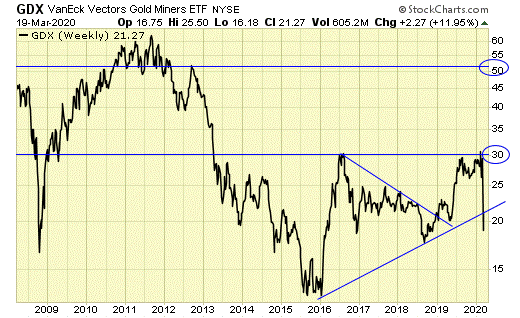
The major uptrend with upside target of $50 is now delayed. But we do have a trading range established, which is what we can do until a breakout at $32 and a new uptrend established.

The 2016 low is major support at $12, and the 2020 high is major resistance at $32. Therefore, we have a median price of $22.
For trading, we simply buy when prices are below $22, and sell when prices are above $22. But when?
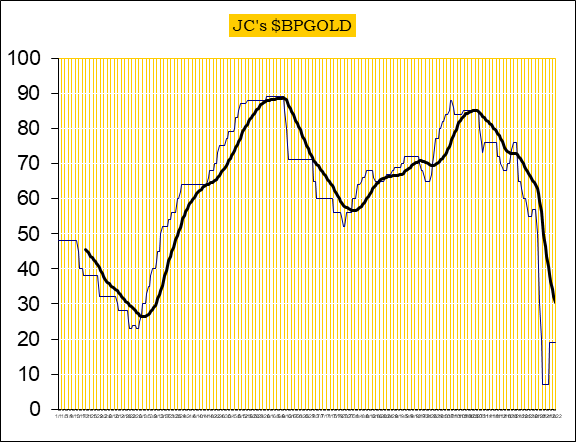
Our cycle indicator has been identifying the cycle tops and bottoms, and generally speaking, we see two or three of those cycles within a calendar year.
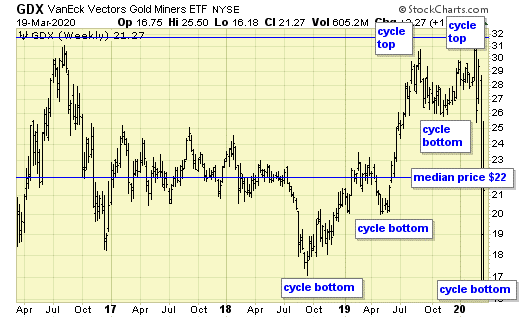
- Using the cycle indicator, we simply buy when we have a cycle bottom and when price is south of the median price of $22.
- We sell (take profits) when we have a cycle top and when price is north of the median price of $22.
- If and when we have a cycle bottom when price is above $22, we do not buy, because upside is limited.
- Currently our cycle indicator sits at a very low number of 8 and has curled up, which suggests that we are at or near another cycle bottom.
- Buy GDX below $22 with no stop and hold until the next cycle top.
Summary
We don’t know when GDX will break out of the current range between $16 and $32 and reach a new bull market high. Sitting and hoping is not the answer. But we do have an established price range, and with the aid of our cycle indicator, we can begin trading within this price range, which has a potential profit of 30% or more, and a potential drawdown about the same.
Disclosure
We do not offer predictions or forecasts for the markets. What you see here is our simple trading model which provides us the signals and set ups to be either long, short, or in cash at any given time. Entry points and stops are provided in real time to subscribers, therefore, this update may not reflect our current positions in the markets. Trade at your own discretion.
We also provide coverage to the major indexes and oil sector.

Jack Chan is the editor of Simply Profits, established in 2006. Chan bought his first mining stock, Hoko Exploration, in 1979, and has been active in the markets for the past 37 years. Technical analysis has helped him filter out the noise and focus on the when, and leave the why to the fundamental analysts. His proprietary trading models have enabled him to identify the NASDAQ top in 2000, the new gold bull market in 2001, the stock market top in 2007, and the US dollar bottom in 2011.


