Current Position Of The Market


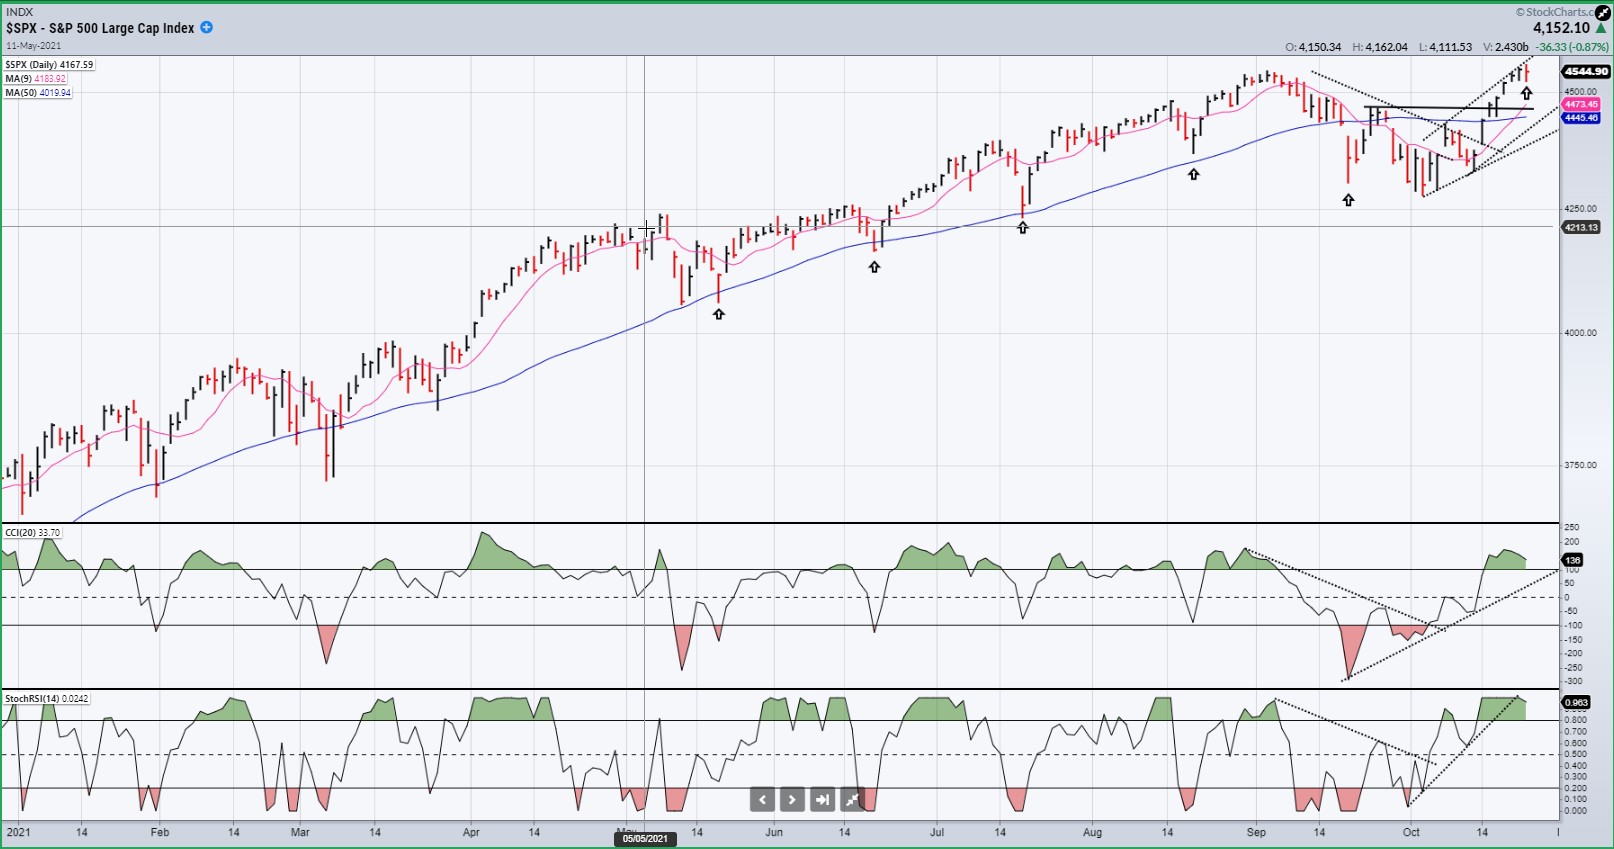
SPX Long-term trend: The 4540 projection which had been in effect since the March 2020 low has now been reached but appears to have been only an intermediate target. Higher levels should now be reached before an important top is struck.
SPX Intermediate trend: An intermediate correction has ended and given way to another intermediate uptrend.
Analysis of the short-term trend is done daily with the help of hourly charts. They are important adjuncts to the analysis of daily and weekly charts which determine longer market trends.
New Intermediate uptrend
Cycles: Looking ahead!
7-yr cycle – Last lows: 2009-2016. Next low: ~2023
Market Analysis (Charts, courtesy of StockCharts)
SPX daily chart
After reaching its 4546 projection, SPX underwent a moderate correction of 267 points that was, nevertheless the largest one in almost a year. It was halted by the bottoming of cycles of intermediate nature which turned prices up from a level a little higher than had been expected. Last week’s market action-- which has already brought SPX to a slightly higher all-time high -- confirmed what had been suggested by the price activity of the previous week: that a new intermediate uptrend had started. The base is large enough to take the index to a minimum of 4790 relatively quickly and perhaps as high as 4950 after some consolidation.
An initial phase projection of 4520 was ignored and the index pushed on to the next minimum target of 4550 where it paused to allow the short-term cycle to bottom. The strong uptrend completely overwhelmed the latter which was due to make its low on ~10/22 (marked on the chart by a small arrow) but it was finally allowed to bottom on time with a 35-point drop from the previous rally high of 4559. Now that the short-term cycle has bottomed, it could extend the uptrend to ~4580-4590 before a reversal takes place. When this occurs, prices should find support in the vicinity of the dotted line shown on the chart. A pullback to that level would also amount to a 50% retracement of the previous uptrend. Whatever the size of the correction, after it is over the advance should resume.
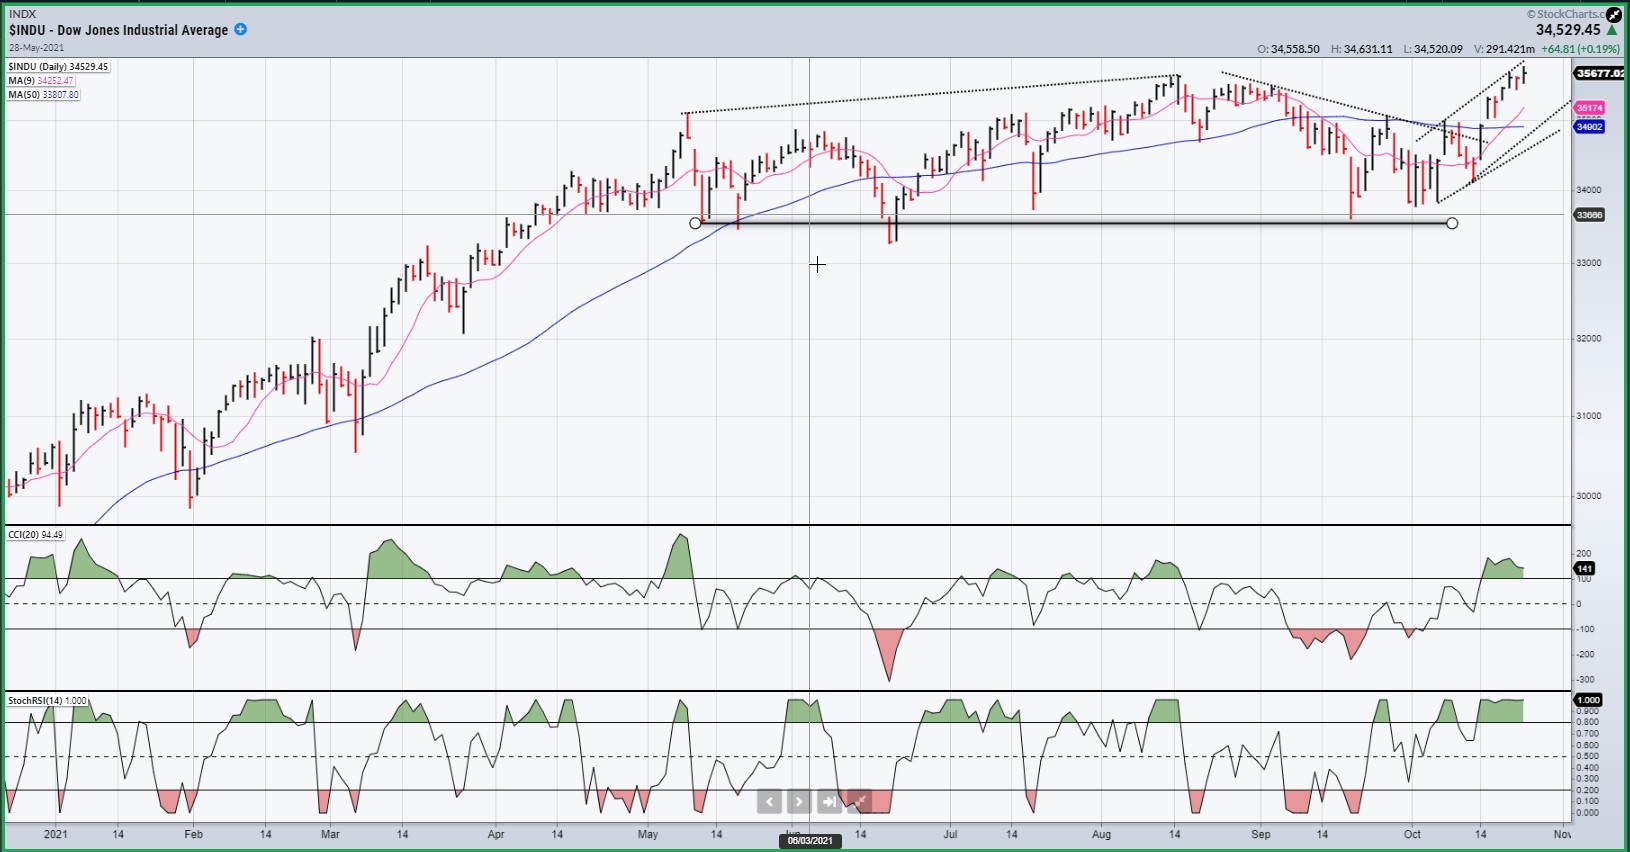
DJIA daily
The DOW, which preceded this new advance with what was essentially a five-month consolidation phase, has also already made a slight, new all-time high. Although the larger price pattern varies from that of SPX, the past two months are very similar, and the two indexes should progress in similar fashion from this point on.
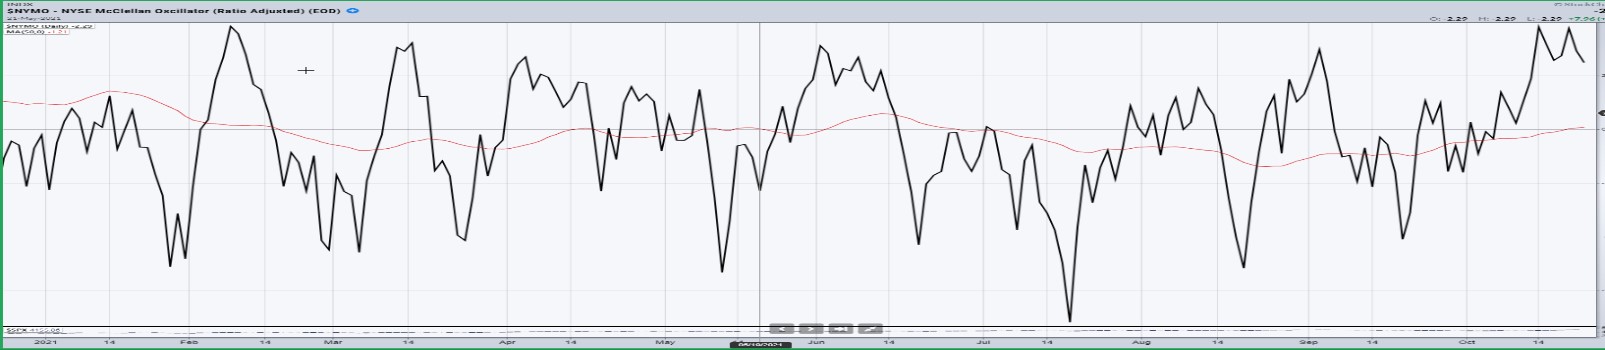
The McClellan (breadth) oscillator posted below shows that this indicator actually bottomed ahead of the price index, and it has fully confirmed the new uptrend by making a new high. It will probably be several weeks before it develops a deterioration pattern that will signal the end of this new advance.
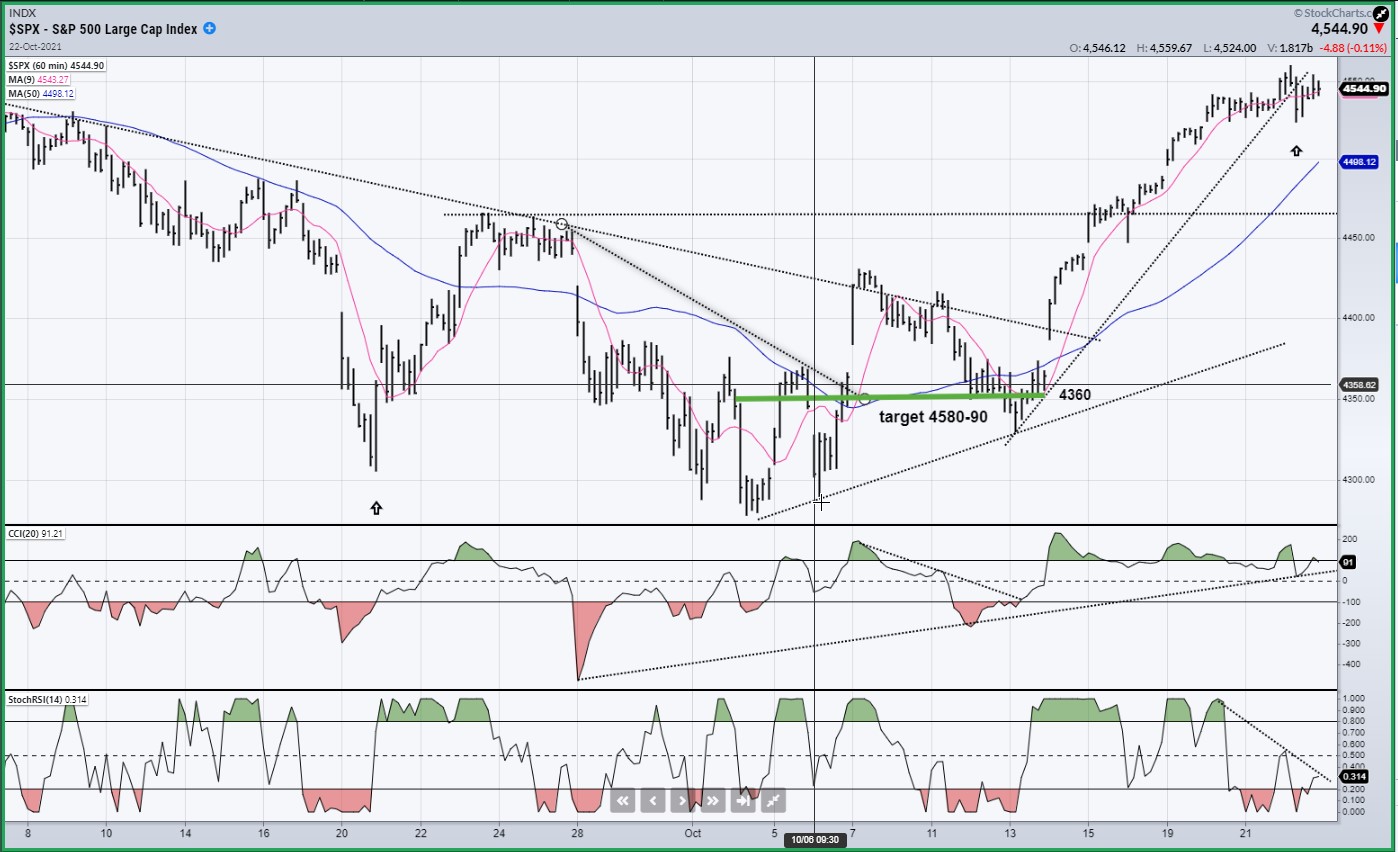
SPX hourly chart
Analyzing the short-term trend over the past couple of days was a challenge, primarily because of the surreptitious nature of the short-term cycle low which was significantly different from previous bottoms. If it turns out to have been Friday, October 22 at 4524, it will make what lies ahead easier to determine. Although the short-term cycle is a minor cycle, it is often crucial in evaluating the market’s short-term trend.
Richard Wyckoff believed that the best way to analyze the market was to combine conventional bar chart analysis with P&F projections. He also suggested that looking at a bar chart could help clarify and confirm a P&F count. The chart below is a good example of this technique. The green line drawn across the 4360 level to the last decline of the previous correction is what gives us a projection to 4580-90 on the P&F chart, making it clear that this is the most likely level that SPX will be trying to reach before correcting since it has already gone past 4520 which was the first potential target. Although the P&F chart pattern is relatively clear this time, there are instances when this process will be very useful to determine the start and end of separate phases. After the coming correction, the base can be extended to include the pattern formed by the decline into 9/28 which will give us a projection to ~4790.
If the short-term cycle did bottom on Friday (arrow) it could provide the additional oomph to take the index the rest of the way to the suggested price target.
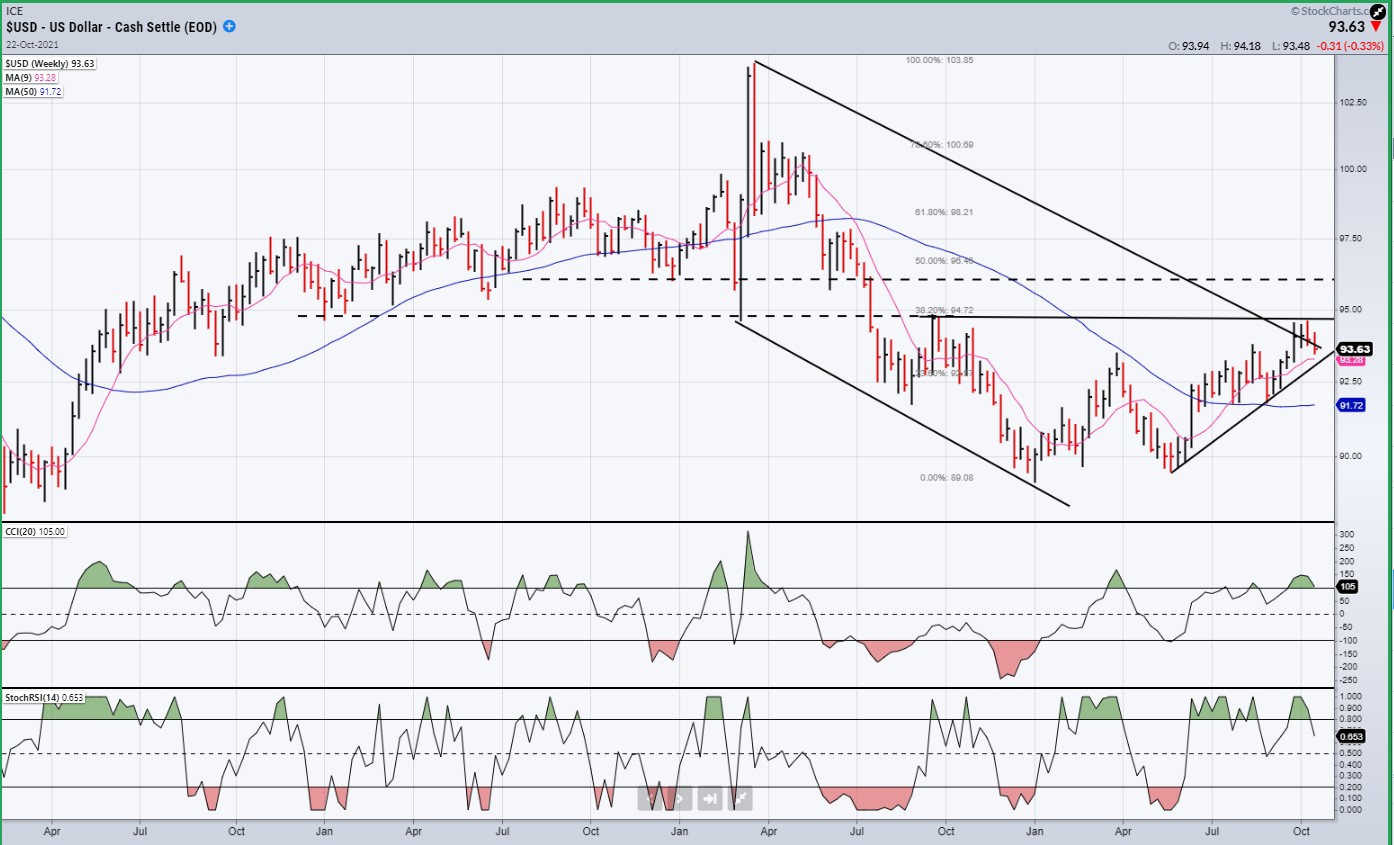
USD dollar daily
The dollar looks as if it has given up trying to break out of the corrective channel, at least for now. Perhaps it will try again if it can hold its correction above the 50-dma.
GDX gold miners daily
Failure of the dollar to extend its rally has helped GDX to move out of its corrective channel, pushing a little higher again this week. Trying to move above the resistance created by the former short-term top has failed initially -- although the index still closed higher for the day -- but it may try again; perhaps as early as Monday, especially if the dollar shows some weakness.

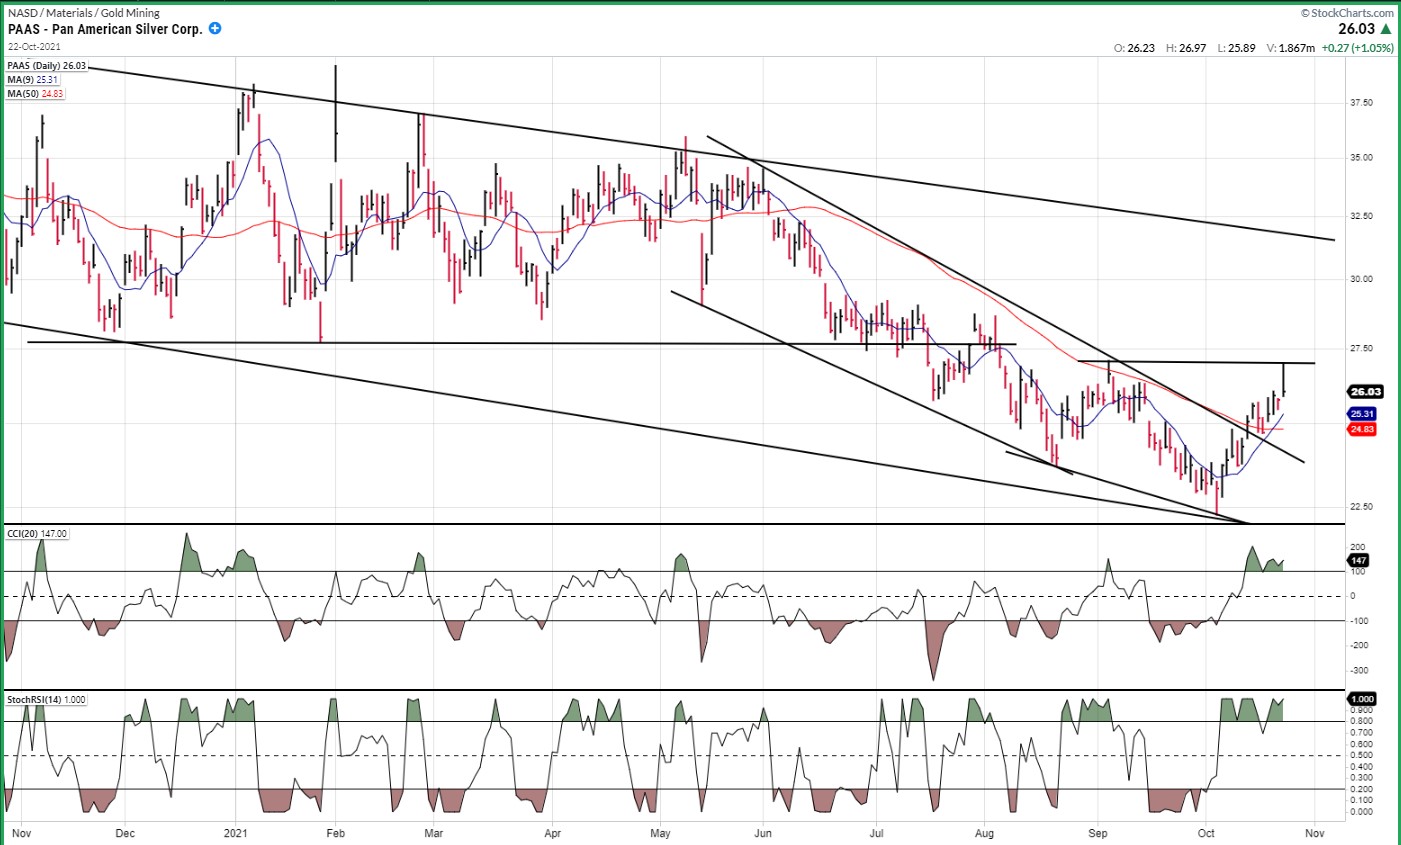
PAAS daily
PAAS also found resistance at a former short-term high which could require that it undergo a little consolidation before moving higher. While it is likely to succeed getting past that first resistance barrier, its future progress will obviously be hampered by what lies above.
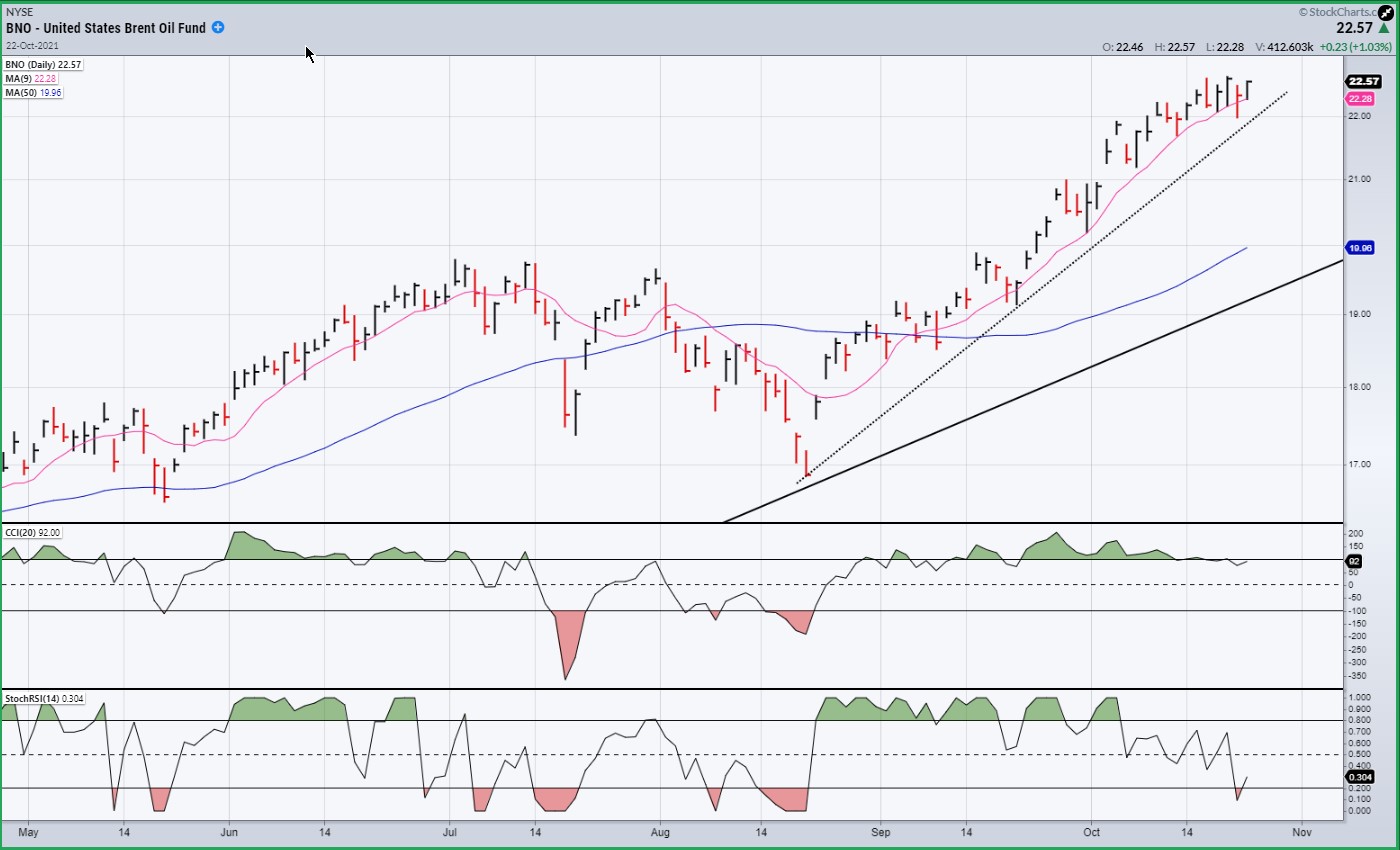
BNO Brent oil fund daily
BNO spent the past week creating what looks like a short-term top. If it cannot remain above the secondary trend line, it should start to correct. The condition of the indicators and the fact that it filled a short-term projection to 22 makes a price retracement likely.
SUMMARY
Last week’s price action confirmed that SPX has started another intermediate trend which should take it to a minimum of 4790 before running into significant selling.
Free trial subscription
With a trial subscription, you will have access to the same information that is given to paid subscribers, but for a limited time-period. Over the years, I have developed an expertise in P&F charting (price projection), cycles (timing), EWT (structure), and general technical analysis which enables me to warn subscribers of pending reversals in market trends, and how far that trend can potentially carry. For a FREE 2-week trial, subscription options, and payment plans I encourage you to visit my website at.
The above comments and those made in the daily updates and the Market Summary about the financial markets are based purely on what I consider to be sound technical analysis principles. They represent my own opinion and are not meant to be construed as trading or investment advice but are offered as an analytical point of view which might be of interest to those who follow stock market cycles and technical analysis.
********

When Andre Gratian was a stock broker years ago, a friend introduced him to technical analysis of the market. Consequently, it is not an exaggeration to say that Andre fell in love with this approach! Ever since then, it has become an increasingly important part of his professional life. Gratian has studied the works of Wyckoff, Edwards & Magee, Edward J. Dewey (cycles) and many others. However, one of my most profitable undertaking has probably been to study Point & Figure charting, which he finds invaluable in analyzing stocks and indices. If he were restricted to one methodology, this is the one that he would choose. This well-rounded background has given him what he feels to be a special insight into the stock market, facilitating the recognition of meaningful patterns and the ‘turning points’ in all trends, whether they be short or long term. Andre feels very comfortable discussing the stock market and passing on meaningful information to others. His subscribers include individuals and money managers throughout the world. Moreover, his Newsletters are currently published on several financial sites, here and abroad.
More from Gold-Eagle


