Current Position Of The Market


SPX Long-term trend: The 4540 projection which had been in effect since the March 2020 low has now been reached but appears to have been only an intermediate target. Higher levels should now be reached before an important top is struck.
SPX Intermediate trend: An intermediate correction has ended and given way to another intermediate uptrend.
Analysis of the short-term trend is done daily with the help of hourly charts. They are important adjuncts to the analysis of daily and weekly charts which determine longer market trends.
Nearing Short-term High
Cycles: Looking ahead!
7-yr cycle – Last lows: 2009-2016. Next low: ~2023
Market Analysis (Charts, courtesy of StockCharts)
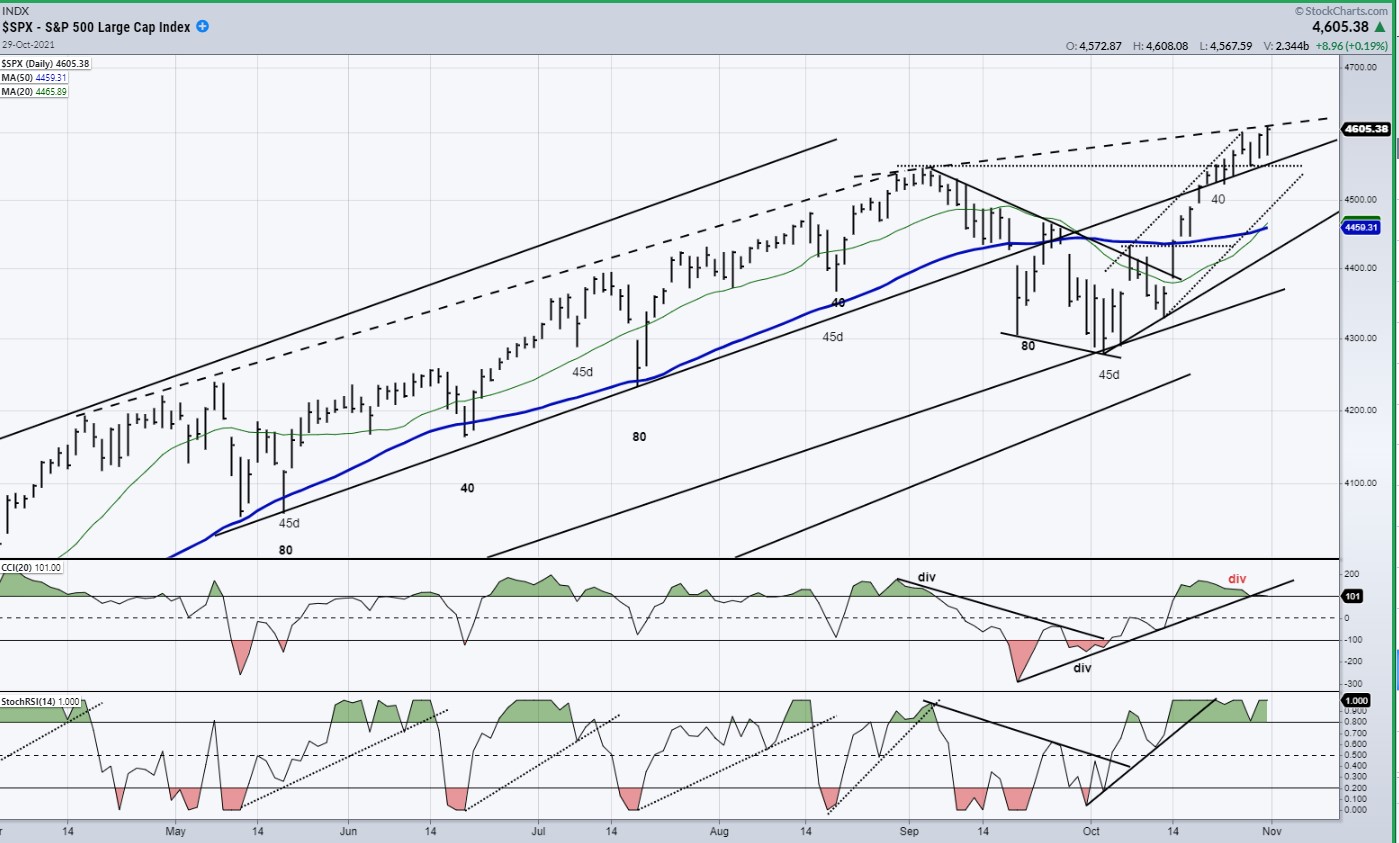
SPX daily chart
After a month-long correction -- its largest in about a year -- SPX rose to the all-time high of 4605 where it closed on Friday. The current short-term uptrend had an ideal projection to 4580-90, but after a 35-point re-accumulation pullback a renewal of buying lifted it to a new high. With the last short-term cycle making its low only a week ago, prices could still progress a little higher -- perhaps as high as 4620 before this cycle makes its high.
On the daily chart below, I have connected previous tops with dashed trend lines to show that a long-term deceleration process is starting to take place and that a rounded top is beginning to form. This would be even more apparent if the chart were extended back to the March 2020 low. While the current uptrend is limited in scope, after the next short-term cycle makes its low (most likely after mid-November) and a new re-accumulation phase has been formed, the base that was created in early October is large enough to push SPX to at least 4790. That base might even be stretched to give us a projection to about 4900, but that is far less certain. Whatever the final high turns out to be, it could be January and even February before a level is reached that will not be exceeded until well after the 7-year cycle has made its low (early 2023).
The CCI oscillator at the bottom of the chart is just beginning to show some negative divergence, suggesting that a final high for this short-term cycle is not too far away, but the SRSI is still positive, and we usually don’t get a sell signal until it has turned down and has become negative.
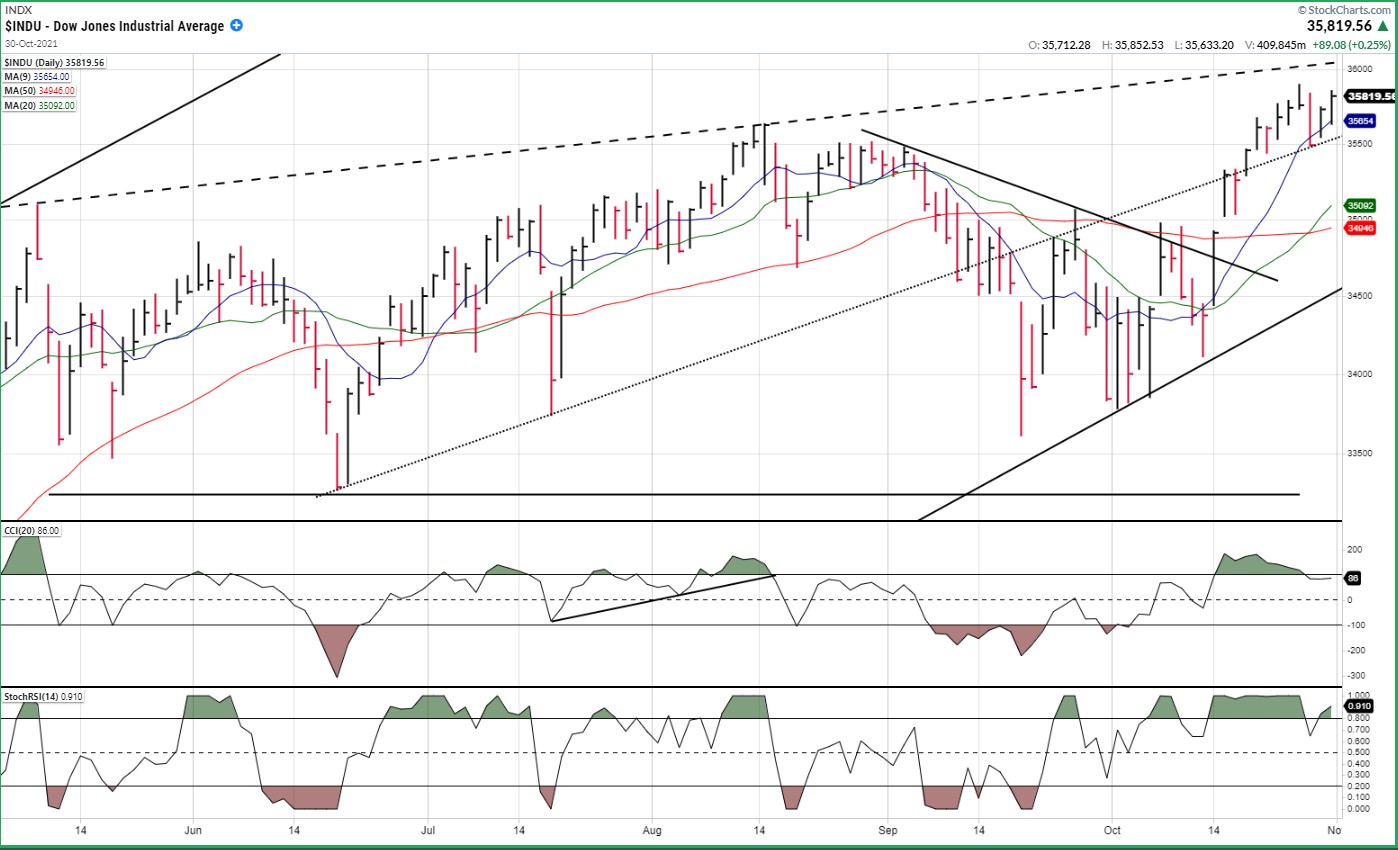
DJIA daily
If you compare the pattern made by DJIA to that of SPX, you can see that the topping formation in the former is far more advanced. This, as I have explained before, is because SPX benefited from a late surge in NDX when it made its previous high. Barring another strong move in NDX, the deceleration process will become more and more noticeable in SPX as we move into the end of the year.
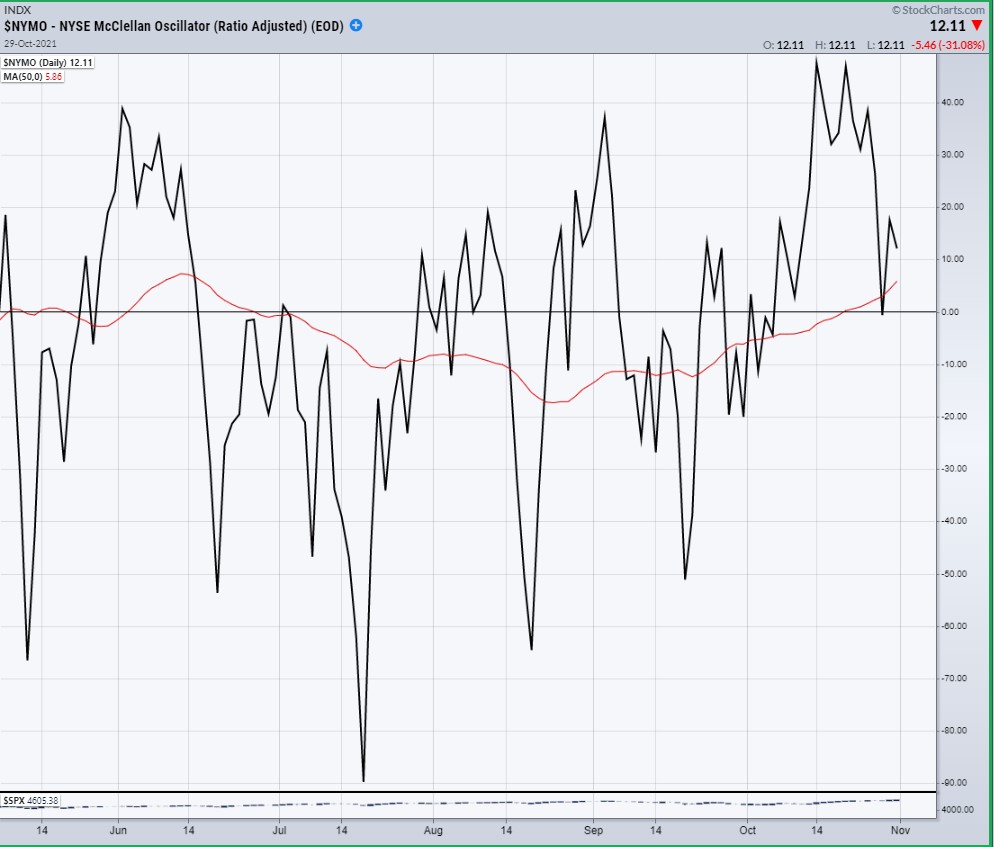
DJIA did not make a new high on Friday and, judging by the McClellan oscillator below which is rapidly losing its strength, that does not bode well for a strong extension of the DOW over the near-term. But we’ll be in a much better position to assess the remaining short-term strength in all three indices by the end of next week.
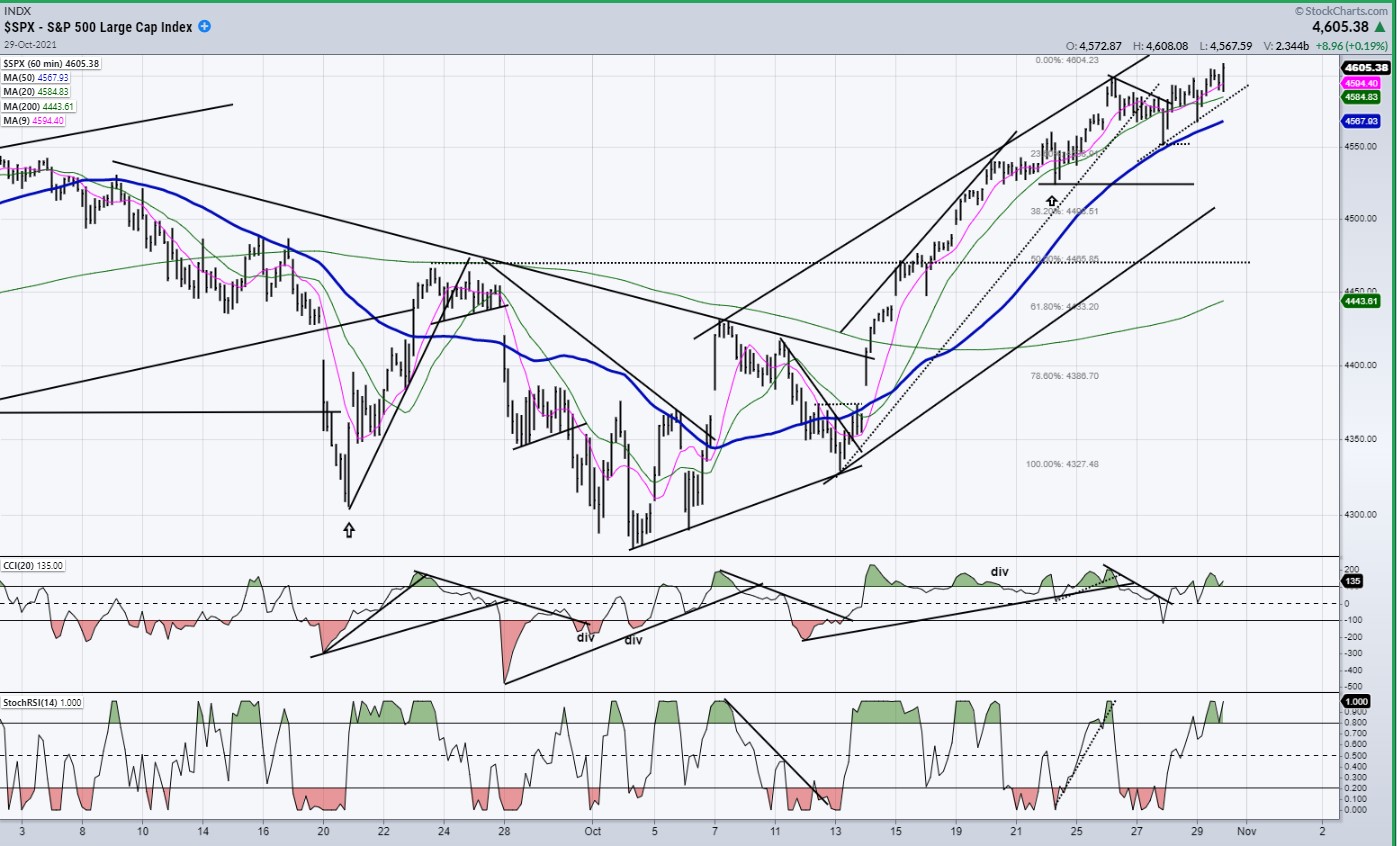
SPX hourly chart
The arrows on the chart show the respective positions of short-term Hurst cycles. To these, I have also added the last low of the 45d cycle (courtesy Jim Curry) which will make it even easier to determine the short-term pulses in the market. Two of these cycles should be making their lows during the last two weeks in November suggesting that the current uptrend is already living on borrowed time and, considering that SPX has already essentially filled the first phase of its October base, I suspect that even if it pushes a little higher, it is close to completing its topping formation.
If the short-term high takes place around this level, or even if it goes a little higher, a 50% retracement of the advance from 4330 would correspond roughly to the dotted line drawn across the 4465-top reached in late September. When we complete the current advance from 4330, that would be a good level around which to look for support after the next short-term correction.
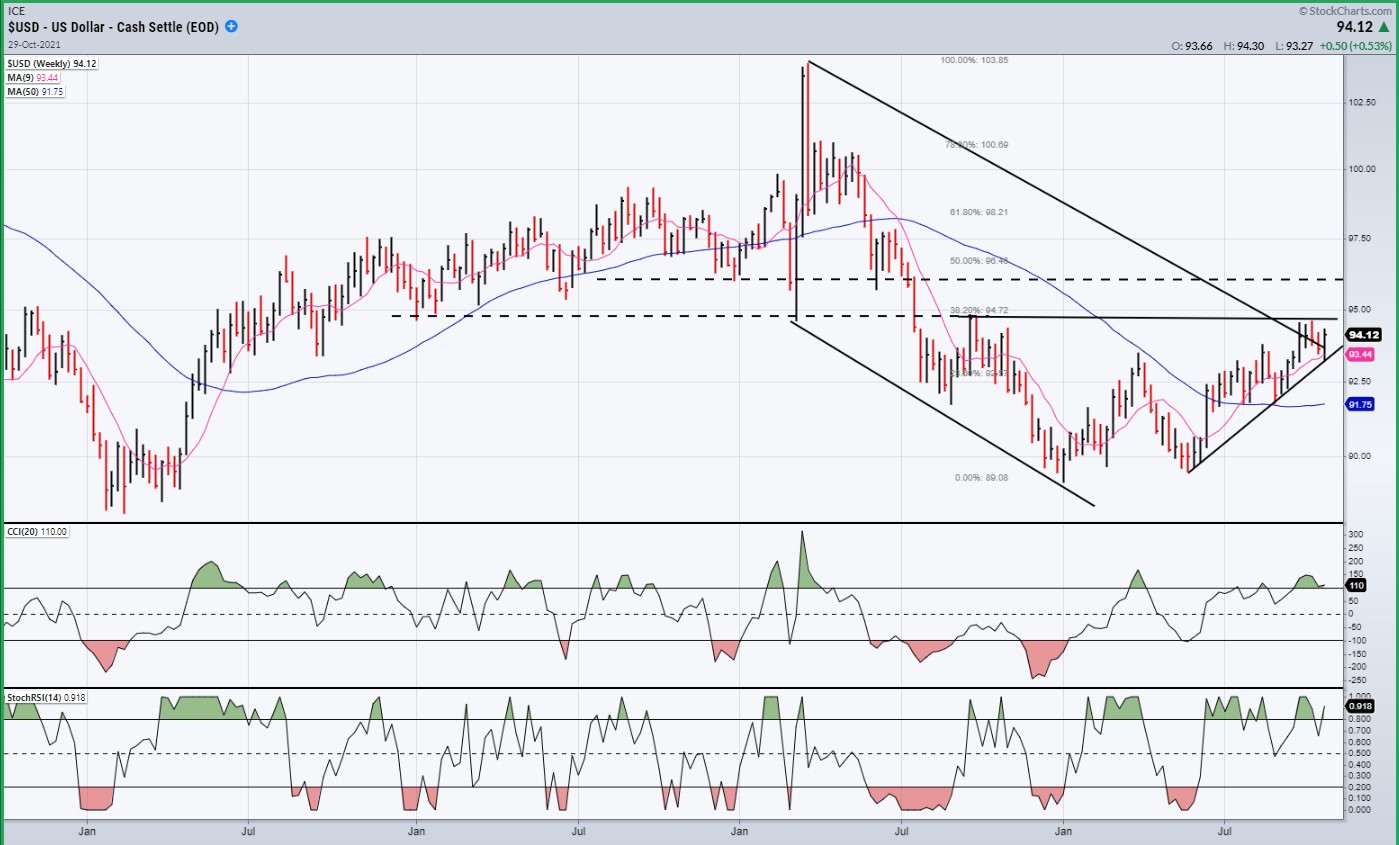
USD dollar daily
The dollar traded essentially sideways last week, finding support on its short-term uptrend, and closing near its closing high of a week ago. Looks like an extension of the short-term uptrend is in the cards -- perhaps up to the next dashed line where it should find more overhead resistance.
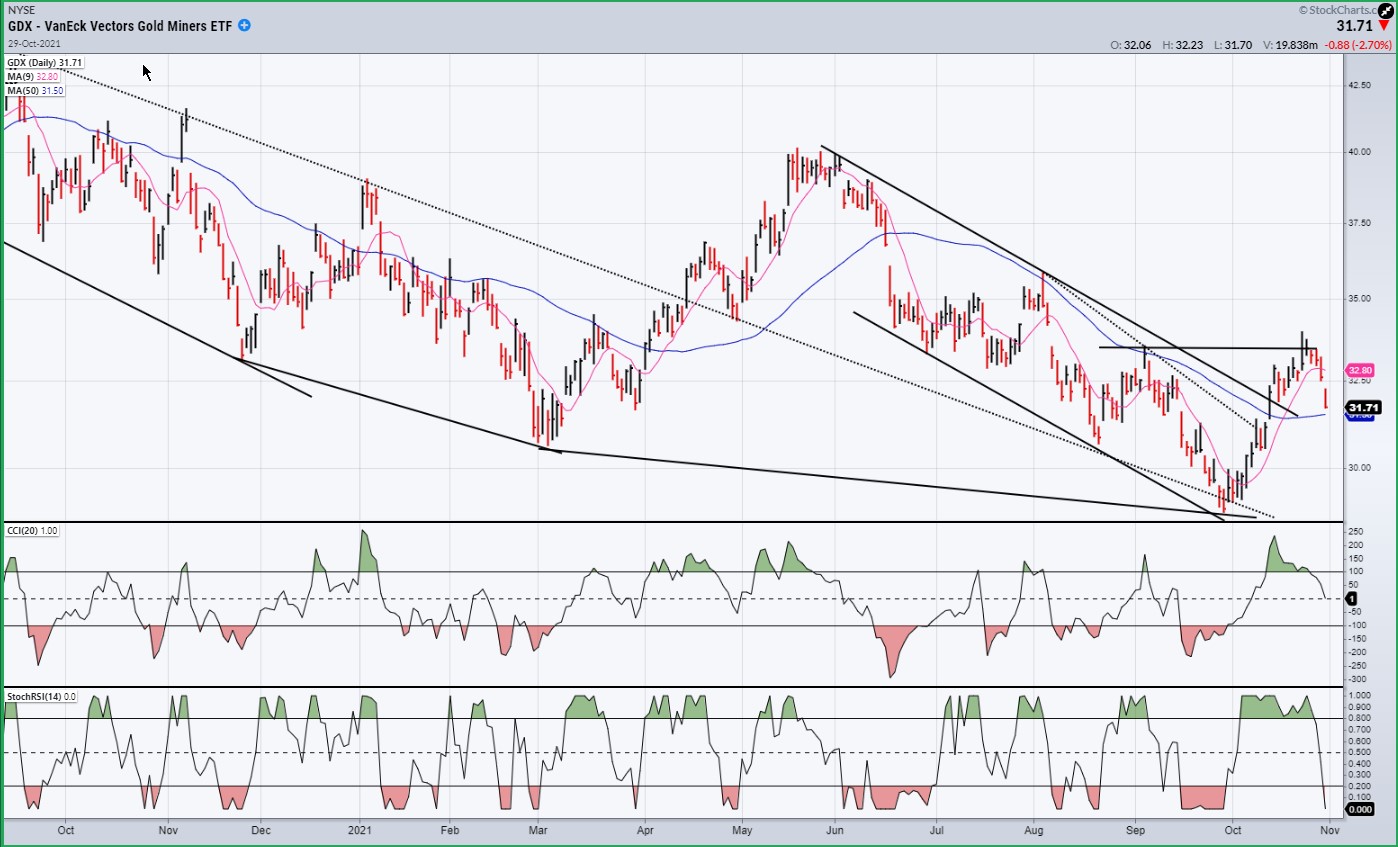
GDX gold miners - daily
GDX could not get past the first level of resistance and has started to pull back. This could turn out to be a beneficial consolidation if it is limited to about 30 since it would create the base which was lacking for the previous attempt to make some substantial headway.
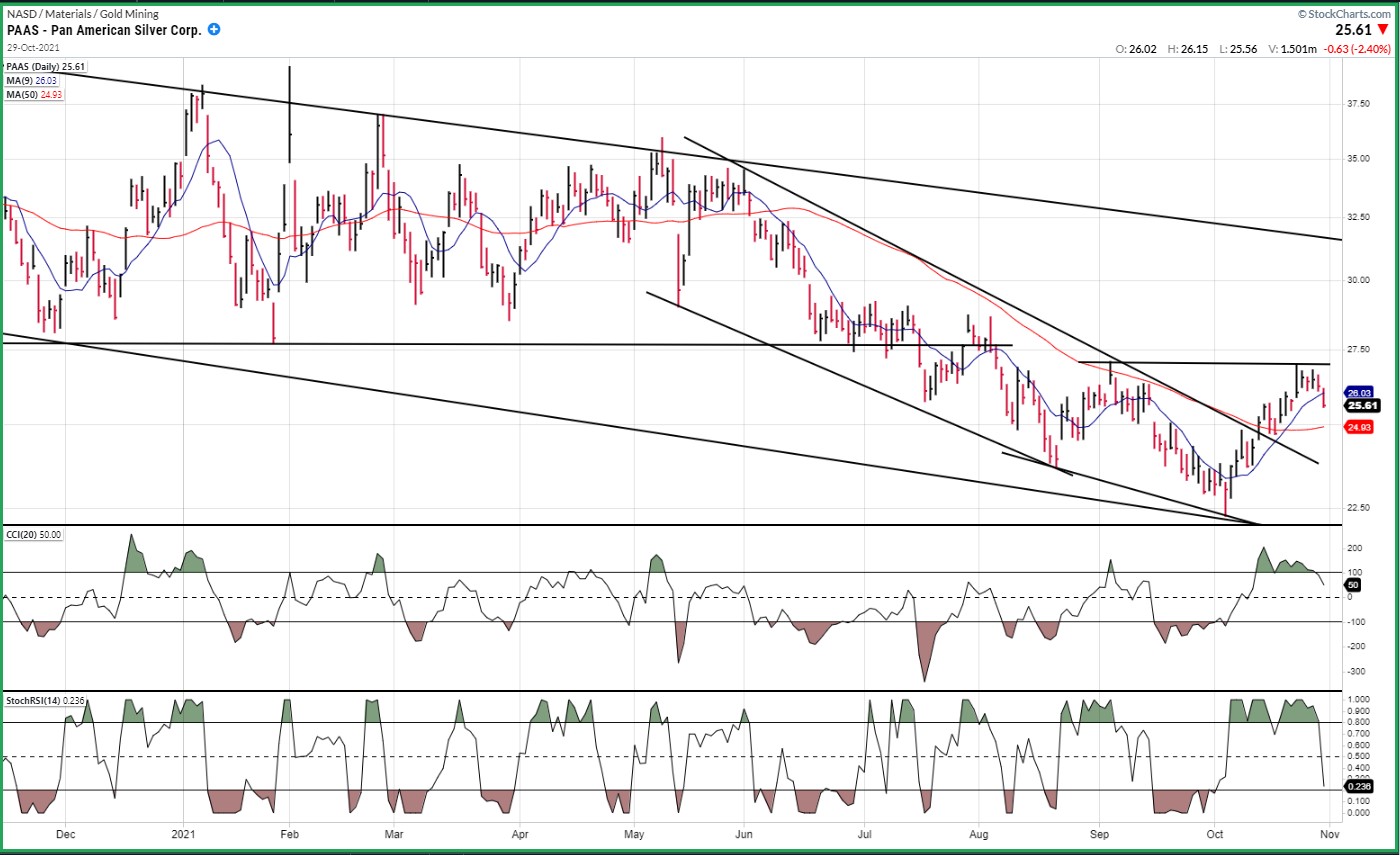
PAAS - daily
The same can be said of PAAS! A retracement to the broken trend line would create a potential reverse H&S pattern which, if it turns out to be valid, would next result in a move that would challenge the upper channel line.
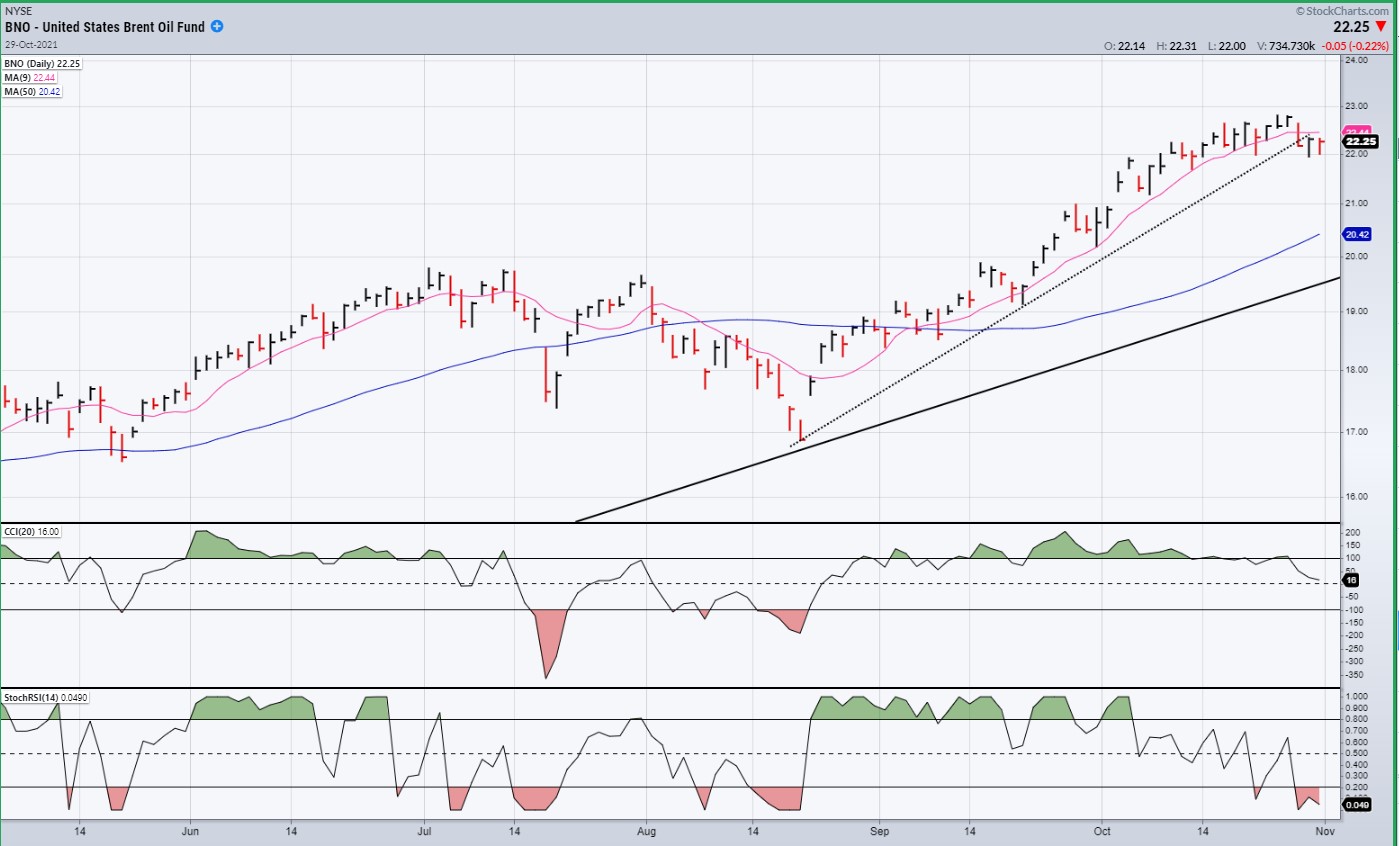
BNO Brent oil fund - daily
It looks as if our projection to the 22 level for BNO will turn out to be correct. It has already started to retrace, and in doing so has broken its secondary trend line. More retracement is likely, perhaps back to about 19 where it could find support from the July highs
SUMMARY
SPX could be done (or close to it) and could spend a little time in this area putting the final touch on a topping formation before starting a short-term correction into the end of November.
Free trial subscription
With a trial subscription, you will have access to the same information that is given to paid subscribers, but for a limited time-period. Over the years, I have developed an expertise in P&F charting (price projection), cycles (timing), EWT (structure), and general technical analysis which enables me to warn subscribers of pending reversals in market trends, and how far that trend can potentially carry. For a FREE 2-week trial, subscription options, and payment plans I encourage you to visit my website at https://marketurningpoints.com/.
The above comments and those made in the daily updates and the Market Summary about the financial markets are based purely on what I consider to be sound technical analysis principles. They represent my own opinion and are not meant to be construed as trading or investment advice but are offered as an analytical point of view which might be of interest to those who follow stock market cycles and technical analysis.
********

When Andre Gratian was a stock broker years ago, a friend introduced him to technical analysis of the market. Consequently, it is not an exaggeration to say that Andre fell in love with this approach! Ever since then, it has become an increasingly important part of his professional life. Gratian has studied the works of Wyckoff, Edwards & Magee, Edward J. Dewey (cycles) and many others. However, one of my most profitable undertaking has probably been to study Point & Figure charting, which he finds invaluable in analyzing stocks and indices. If he were restricted to one methodology, this is the one that he would choose. This well-rounded background has given him what he feels to be a special insight into the stock market, facilitating the recognition of meaningful patterns and the ‘turning points’ in all trends, whether they be short or long term. Andre feels very comfortable discussing the stock market and passing on meaningful information to others. His subscribers include individuals and money managers throughout the world. Moreover, his Newsletters are currently published on several financial sites, here and abroad.


