Current Position Of The Market


SPX Long-term trend: The 4540 projection which had been in effect since the March 2020 low has now been reached but appears to have been only an intermediate target. Higher levels should now be reached before an important top is struck.
SPX Intermediate trend: An intermediate correction has ended and given way to another intermediate uptrend.
Analysis of the short-term trend is done daily with the help of hourly charts. They are important adjuncts to the analysis of daily and weekly charts which determine longer market trends.
Bullish Trend Continues
Cycles: Looking ahead!
7-yr cycle – Last lows: 2009-2016. Next low: ~2023
Market Analysis (Charts, courtesy of StockCharts)
SPX daily chart
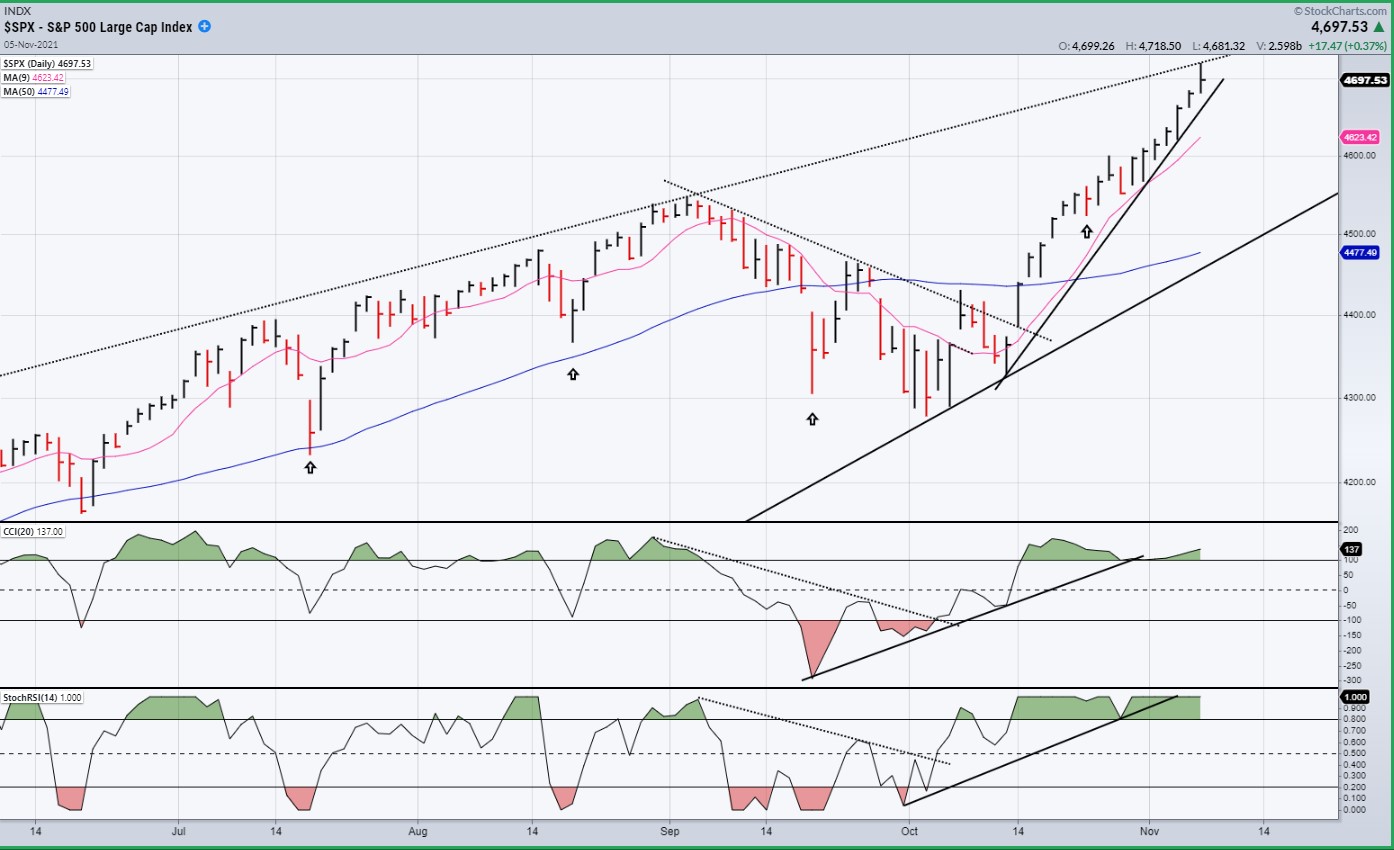
Last week SPX tacked on another one hundred points as the strong intermediate uptrend which emerged from the base formed by the corrective phase ending on 10/13 continued uninterrupted. A good part of that advance came after last Wednesday’s FOMC report which reassured traders that the Fed would not take any immediate action that would slow the economic recovery, as well as repeated comments by Fed chairman Powell that he did not consider the tick up in inflation to be a serious threat. These reassurances brought an immediate 40-point advance, but there was more to come! After a brief consolidation into Friday morning, more good news in the form of a stronger than anticipated jobs report, propelled the index nearly 50 points higher before some profit-taking finally took hold.
As discussed previously, the base which was formed into mid-October has the potential to send SPX to at least 4790, and perhaps as high as 4960. With the price acceleration which boosted the index this past week, it could reach the first target before coming to the current short-term cycle top. Subsequent market action will help us evaluate if the higher target is also reachable.
So far, there is no sign that the 7-year cycle is having any effect on prices. That could change after early 2022.
DJIA daily
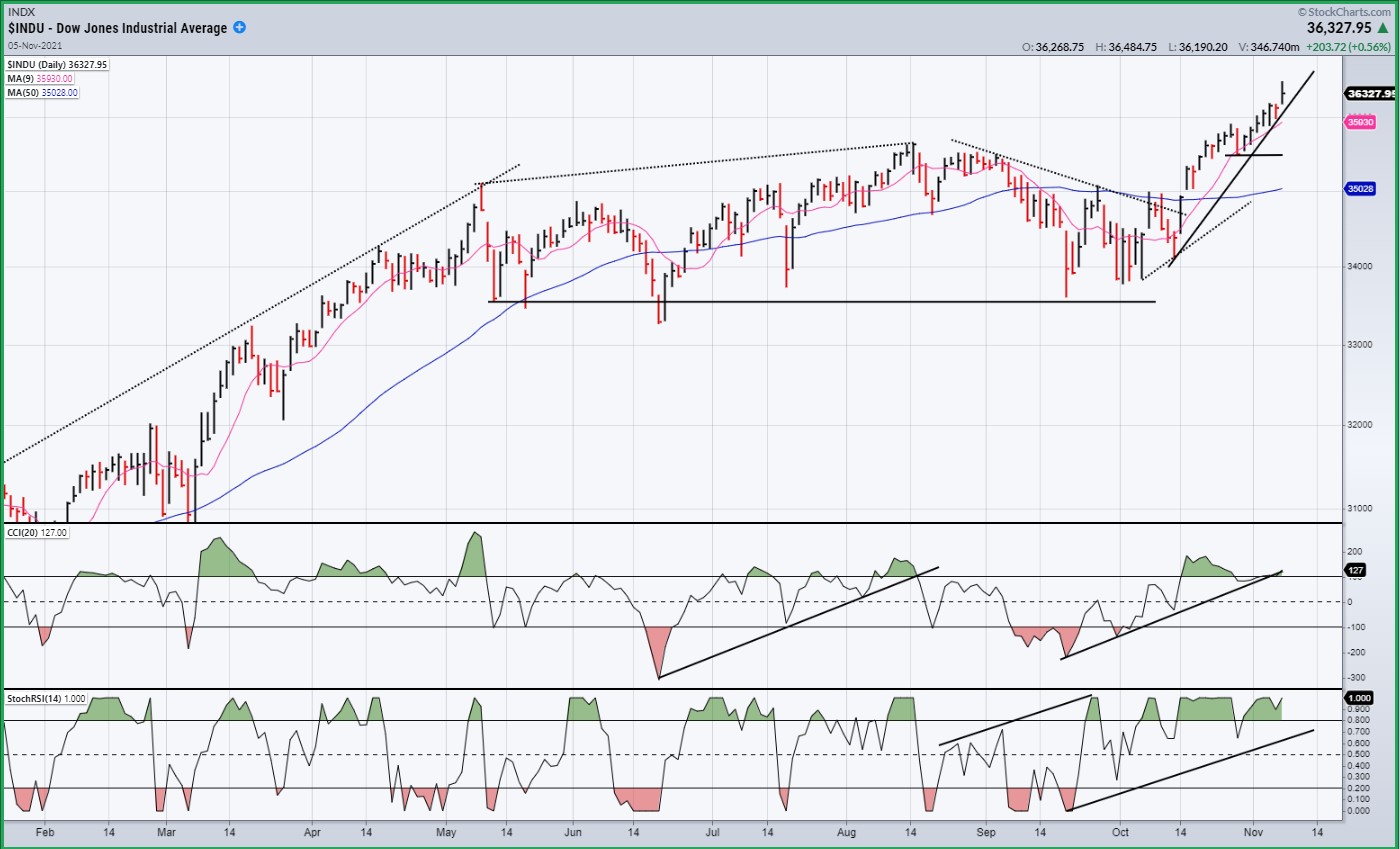
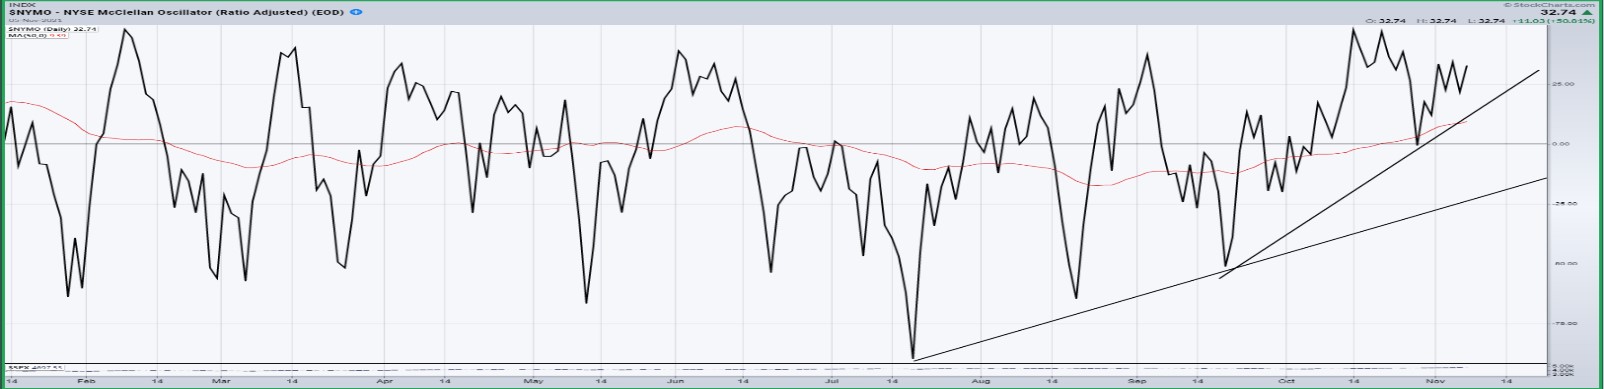
The DOW also profited from the bullish news background to extend its trend even higher above its five-month consolidation pattern and, like SPX, ended the week overbought, but with no sign that it is ready for its next correction. However, the McClellan oscillator which is posted below may be – is – telling another story. It had made a new high during the previous week, but last week the breadth indicator underperformed prices by a considerable margin. Does it mean that a consolidation in the price index is around the corner? In addition, a cursory evaluation of the price structure reveals a 5-wave pattern since 10/1, suggesting that we could be approaching a short-term high in that index.
SPX hourly chart
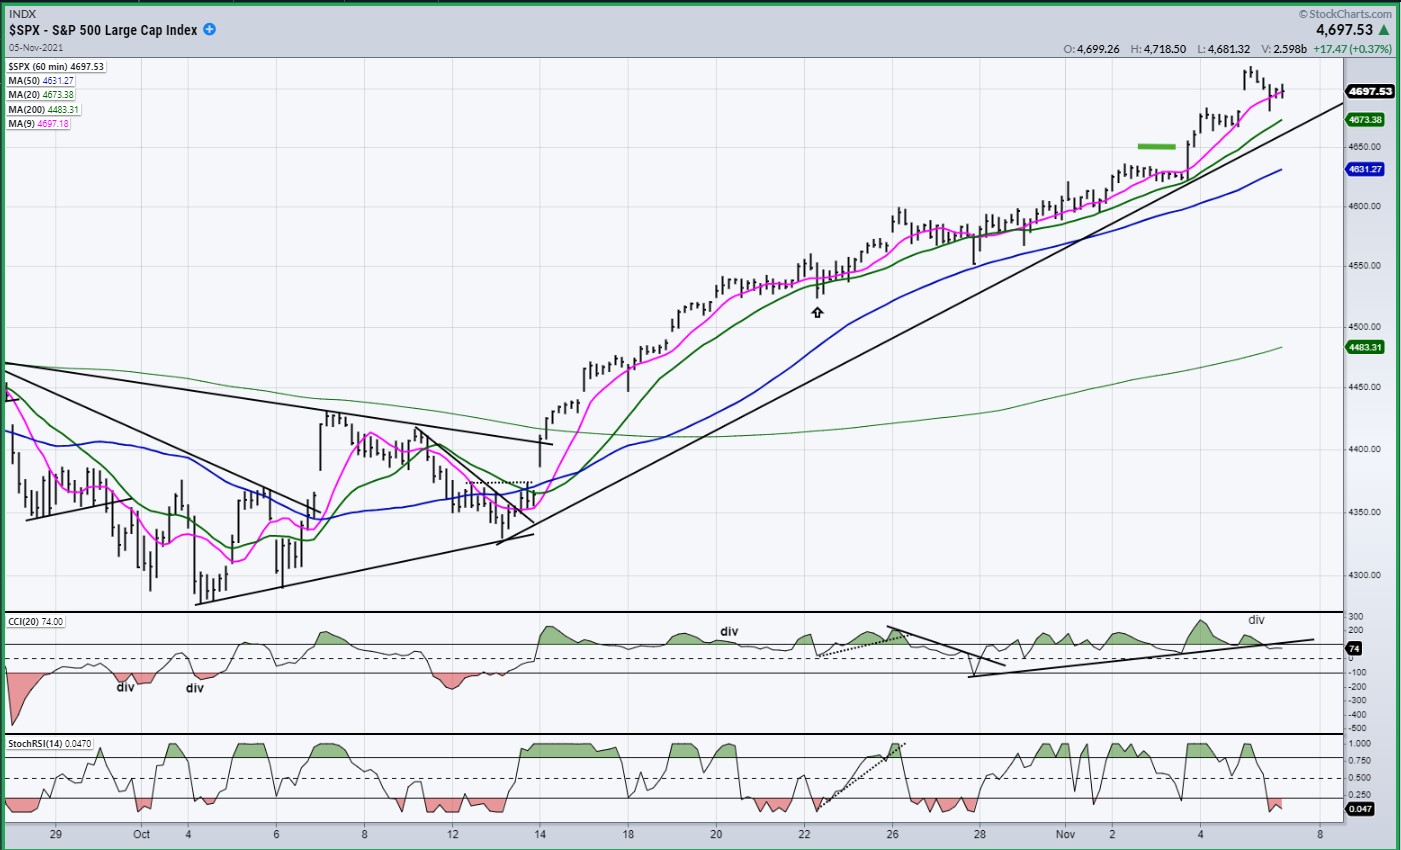
The base which was completed in October is divisible into phases, each of which resulting in a potential count on the P&F chart. These counts specify price levels where prices might be expected to pause in an uptrend, until the entire base count has been satisfied and the current trend is at risk of reversing.
The phase structure of the September-October base had alerted us that a pause might occur at about SPX 4650. In addition, a minor cycle was due to bottom toward the end of the week or early next week. Any concern that the index would consolidate after reaching 4650 was quickly dissipated by the market’s reaction to the FOMC comments and bullish jobs numbers. The index did pull back to 4681 after it had shot-up to 4718 on Friday morning, which could be attributed to normal profit-taking, or to the bottoming of the minor cycle. Either way, a trivial occurrence within the context of the overall trend which shows no real sign of slowing its advance; and with 4790 still very much on the radar before the current short-term cycle reaches its apex.
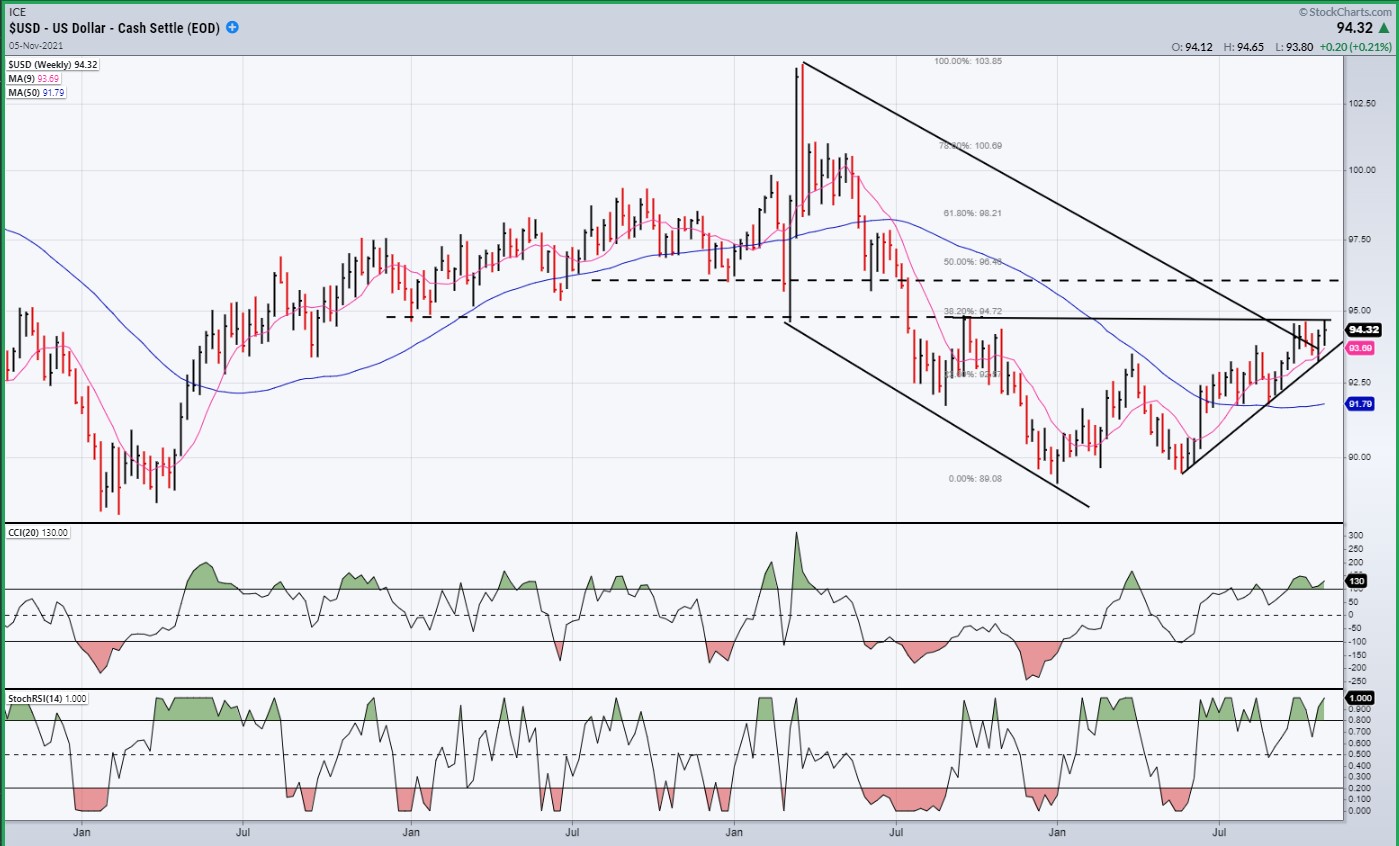
USD dollar daily
The dollar was not able to make additional progress last week, but neither did it reverse its short-term trend, so we’ll need a little more data before we can gauge whether or not it can extend its rally to the slightly higher resistance level.
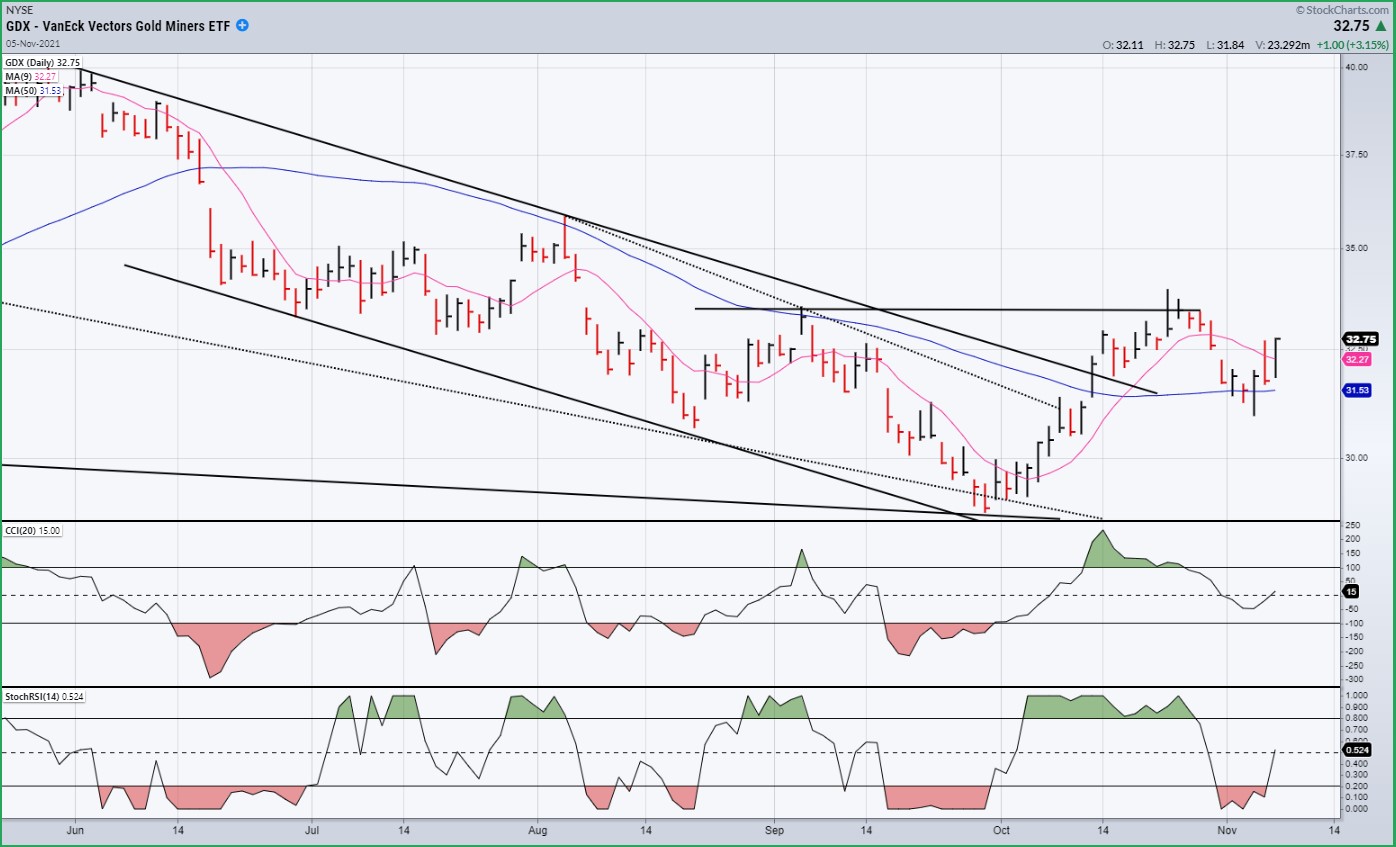
GDX gold miners - daily
GDX found support at the extension of its downtrend line and bounced. While last week’s action was bullish and the index may be ready to challenge overhead resistance, if the dollar is able to advance a little higher over the near-term, it may deter the index from making any further immediate progress.
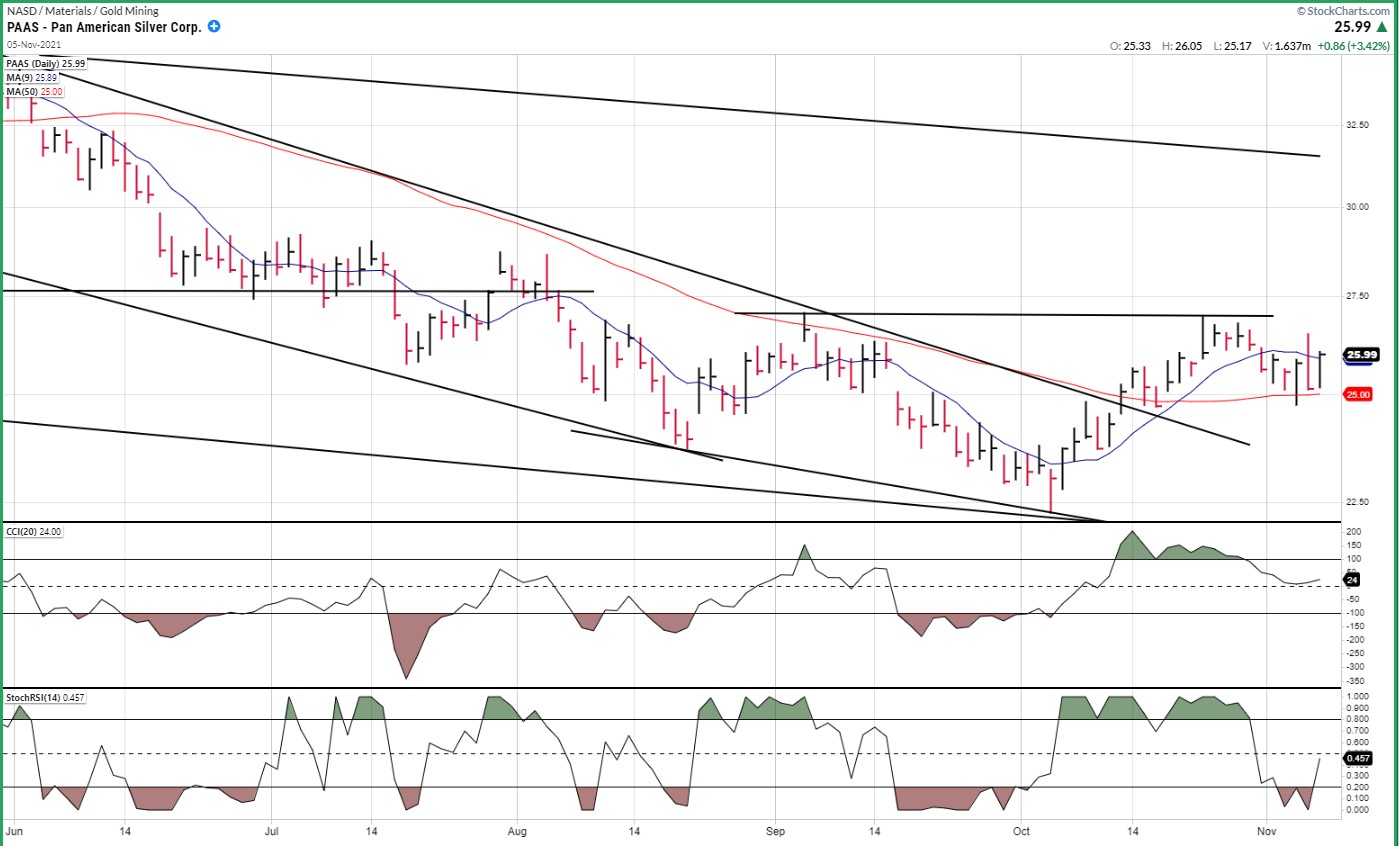
PAAS – daily
PAAS is also making a bullish pattern after finding support at ~22.50. Like GDX, it may be at the mercy of what the dollar does over the near term.
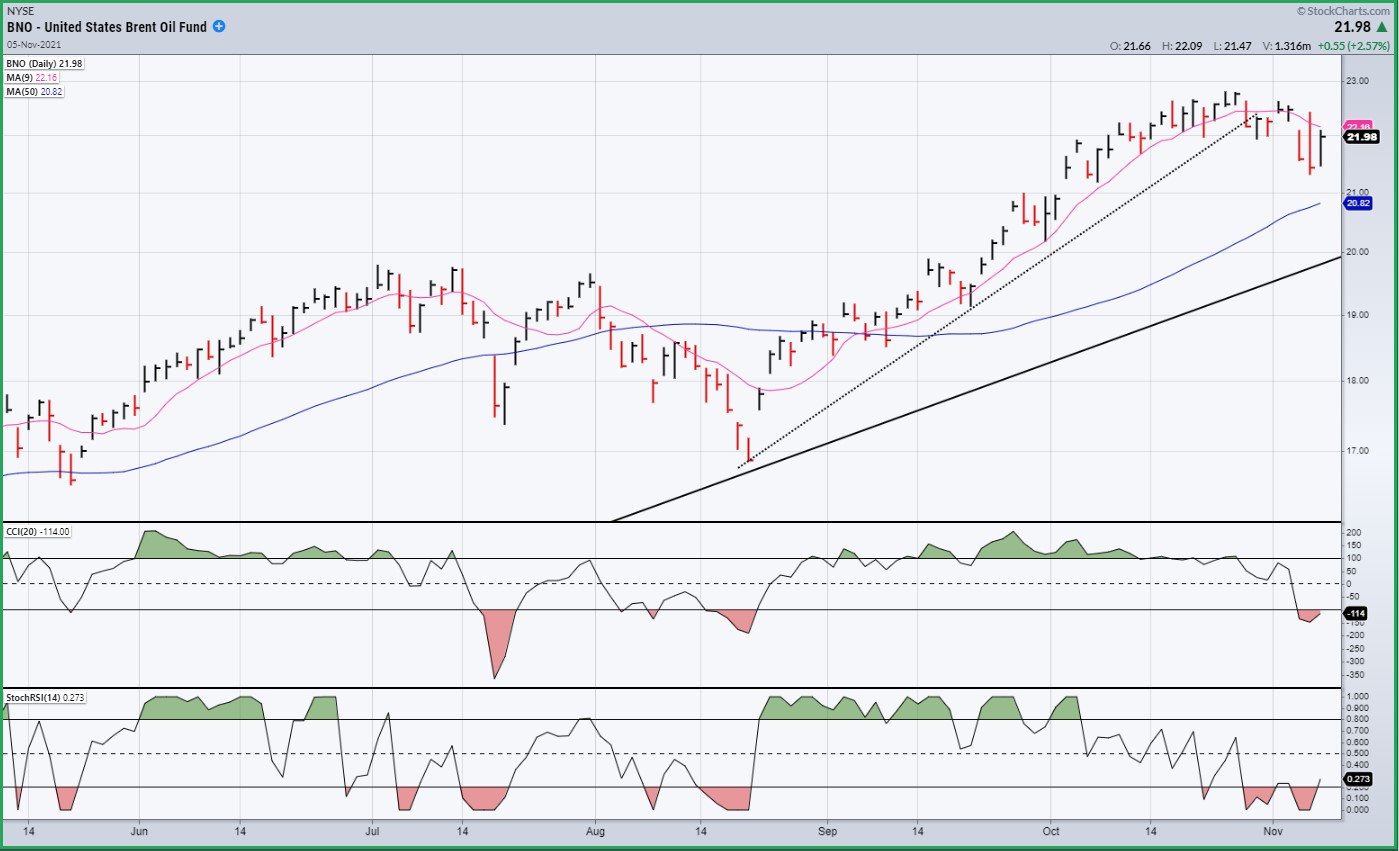
BNO Brent oil fund - daily
BNO has started to consolidate after reaching its 22-target. So long as it remains above its 50-dma, its correction will be limited, but it will probably extend down to its primary trend line if it closes below it.
SUMMARY
Boosted by reports that were taken as bullish for the market by traders, SPX continued the strong intermediate uptrend
which originated in early October. Higher prices are likely before a meaningful corretion can take hold.
Free trial subscription
With a trial subscription, you will have access to the same information that is given to paid subscribers, but for a limited time-period. Over the years, I have developed an expertise in P&F charting (price projection), cycles (timing), EWT (structure), and general technical analysis which enables me to warn subscribers of pending reversals in market trends, and how far that trend can potentially carry. For a FREE 2-week trial, subscription options, and payment plans I encourage you to visit my website at.
The above comments and those made in the daily updates and the Market Summary about the financial markets are based purely on what I consider to be sound technical analysis principles. They represent my own opinion and are not meant to be construed as trading or investment advice but are offered as an analytical point of view which might be of interest to those who follow stock market cycles and technical analysis.
*********

When Andre Gratian was a stock broker years ago, a friend introduced him to technical analysis of the market. Consequently, it is not an exaggeration to say that Andre fell in love with this approach! Ever since then, it has become an increasingly important part of his professional life. Gratian has studied the works of Wyckoff, Edwards & Magee, Edward J. Dewey (cycles) and many others. However, one of my most profitable undertaking has probably been to study Point & Figure charting, which he finds invaluable in analyzing stocks and indices. If he were restricted to one methodology, this is the one that he would choose. This well-rounded background has given him what he feels to be a special insight into the stock market, facilitating the recognition of meaningful patterns and the ‘turning points’ in all trends, whether they be short or long term. Andre feels very comfortable discussing the stock market and passing on meaningful information to others. His subscribers include individuals and money managers throughout the world. Moreover, his Newsletters are currently published on several financial sites, here and abroad.


