Did The Stock Market Top Last Week? I think Not!


We’re certain that many of you are asking yourself this question after seeing the markets rotate to the downside so hard recently. If you had been reading our past analysis for the early portion of 2018, you would likely know the answer to this question. If not, this research article will assist in your understanding of the market’s rotation and what to expect over the next few weeks/months.
We called a market advance in early 2018 nearly three weeks before the end of 2017. We also called the current move, lower, at that same time. Recently, we’ve made calls regarding the US Dollar, metals markets, and natural gas that have played out exceptionally well for our members. Now, we’ll show you what to expect in the markets for the next few weeks.
First, we want to alert you that this downside move in the US majors is, in our opinion, a rotational motion to establish support for a bigger and stronger upside leg resumes. We are certain that others will be posting research calling this a “major top” and warning of extended downside risks. In reality, that analysis could be true if the markets completely fall apart or some external factor drives the market below critical support levels. But right now, this is not the case and we don’t see it playing out in this form because many economic fundamentals are pointing to much higher price levels.
The NASDAQ Daily. We can see the beginning of 2018 started with a massive upside rally originating near the $6400 price level. Currently, the $6800~6900 price level is our “upper boundary” from our original analysis prior to the end of 2017. When the price level reached these levels, we were certain that the pullback would be exaggerated as well. Thus, this move lower, last Friday, is a perfect price reaction to the extent of the rally that started 2018.
At this time, though, we are moving right into our “upper boundary” range and most of our readers want to know what to expect next. In our previous research, we identified many key dates that we thought would play out as critical price rotation dates. Additionally, our cycle analysis dates assist us in understanding broader cycles. Our current analysis is that the downward price cycle in the NQ will stall near the $6668 price level and extend into a sideways price channel till near February 21st. Near that time, February 21st, prices will likely begin a new advance higher with the potential for an explosive rally to the upside which should end near March 15th.
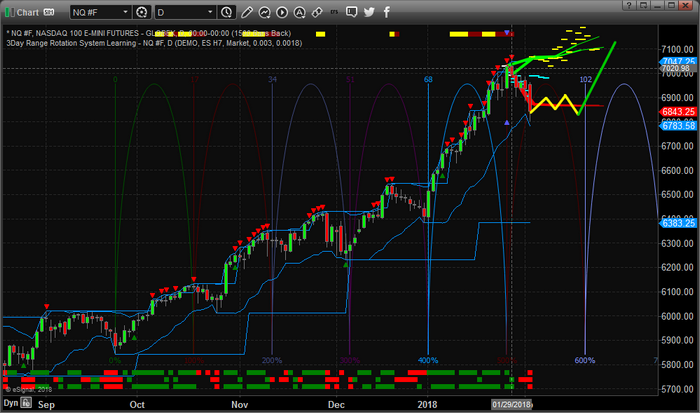
After the March 15th cycle top, we will have to review the market setups then determine what is the likely outcome. Overall, we believe the markets will rotate lower, again, in a similar manner to how they have moved in the past year plus. Each move of 4~7% lower has been a measured price rotation that supports a further price advance. We don’t believe there is any reason, currently, to be concerned about critical market failure. We are watching our sources for early warning signs and are paying very close attention to China and the EU.
Lastly, we wanted to share with you a larger perspective of the market’s rotation as it plays out over the next few months. April and May are always somewhat interesting in the markets because US citizens are dealing with the IRS/TAX issues at that time. Additionally, the markets will likely consolidate into the lower volume summer trading.
Our expectations are that the US Majors will move broadly higher towards the March 15th peak, then rotate lower for a week or two, then begin a move higher again ending near April 15th. All of this analysis is based on our research of cycles and price modeling systems. This allows us to see into the future a bit with some basic understanding of what is likely to happen. Yet, we can’t be 100% certain all the time, in fact, we re-analyze the markets daily and our forecasts slowly change as the markets evolve which is why it’s critical to receive our up-to-date research each week. The best we can do it to make educated expectations and make trades that provide us with the advantage over the markets. Our most recent trade in DUST shot up 11% in less than 2 days.
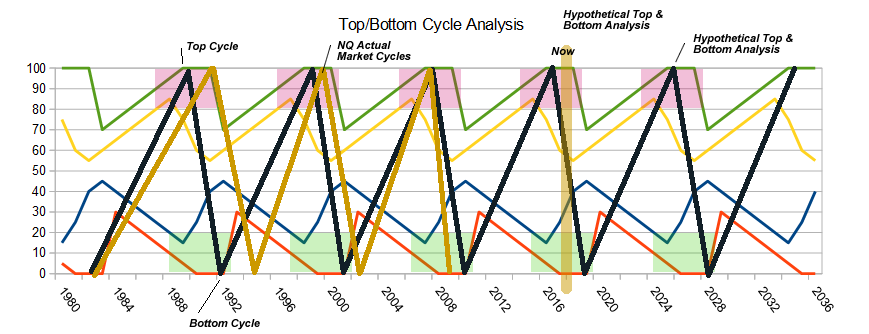
All traders must understand that the global markets are reacting to the new US President and his new business-friendly policies. Overall, there are major cycles still at play in all the markets and they may become extended in some form or another. Yet, these cycles are still fundamental to the operations of global economics.
As you can see from the following image below, the current market cycle is well within the topping range and has been pushed deeper into the topping range by recent policy. It is our opinion that without these policy changes and the new US President, we would have already been in a major market correction (bear market) by now. This cycle is still very relevant and important. At some point in the future, this will become critical for all investors.
If you find our research and articles helpful and insightful, then please visit Technical Traders Ltd. to learn more about our service that provides daily forecasts and swing trade alerts for stocks, ETF’s, and index futures and commodities to traders and investors.
Our objective is to help you find opportunities and success each and every day. We deliver our Daily Market Video early each morning telling you what to expect in the markets each day and we deliver text-based updates throughout the day (as needed) to alert you to opportunities. Try joining for one month to see how we can help you become a better and more successful trader – visit www.TheTechnicalTraders.com today.
53 years experience in researching and trading makes analyzing the complex and ever-changing financial markets a natural process. We have a simple highly effective way to provide our customers with the most convenient, accurate, and clear market forecasts available today. Our stock and ETF trading alerts are readily available through our exclusive membership service via email and SMS text. Our newsletter, Technical Trading Mastery book, and 3 Hour Trading Video Course are designed for both traders and investors. Also, some of our strategies have been fully automated for the ultimate trading experience.
Chris Vermeulen
Improve your trading and
boost profits with our analysis
Technical Traders Ltd. helps you identify and profit more from your trading. How? By providing you with verified trade setups and real-time notifications.
*********

Chris Vermeulen has been involved in the markets since 1997 and is the founder of Technical Traders Ltd. He is an internationally recognized technical analyst, trader, and is the author of the book: 7 Steps to Win With Logic
Through years of research, trading and helping individual traders around the world. He learned that many traders have great trading ideas, but they lack one thing, they struggle to execute trades in a systematic way for consistent results. Chris helps educate traders with a three-hour video course that can change your trading results for the better.
His mission is to help his clients boost their trading performance while reducing market exposure and portfolio volatility.
He is a regular speaker on HoweStreet.com, and the FinancialSurvivorNetwork radio shows. Chris was also featured on the cover of AmalgaTrader Magazine, and contributes articles to several financial hubs like MoneyShow.com.


