Did We Just Witness The Bottom In The Gold Market?


Mr. Market the Great Deceiver
Markets are deceptive…but we all know that. Beyond deceptive, markets are actually down right diabolical. Mr. Market operates through his two most trustworthy lieutenants Mr. Bull and Mr. Bear. He has tasked Mr. Bull to climb and reach the top of the mountain using investors buying power to fuel the rise. But he has also instructed Mr. Bull to not allow those same investors to complete the journey themselves, he wants to reach the top without them. It’s a hard job to pull off and Mr Bull needs to use every trick in the book to throw off these investors after they use their money to power the trend upward. It’s a process that takes time and Mr. Bull’s prime tools are greed and fear in the minds of investors.
Mr. Bear however, has been assigned a totally different mission. When it’s his turn he has been tasked to use those very same investors to power the trend to un-dreamed of lows. This is a mission even more difficult than Mr. Bull’s because counter to Mr. Bull it’s Mr. Bear’s duty to actually keep those investors in the market despite it falling over time, which is no easy task. This is because if these investors just gave up and left the market it would simply stop going down. His mission requires a particularly high level of deviance to pull off. It’s why Mr. Market retains a particularly fond place in his heart for Mr. Bear, since Mr. Market has a diabolical nature and like the Grand Inquisitor, he has no problem drawing blood.
The Psychology of a Market Bottom
A bottom occurs when virtually everyone turns bearish. I know what you are thinking…you’re thinking: “I am paying these guys money to tell me this?” Jeesh everyone knows that! But let’s dissect that comment. If almost everyone is bearish then that means everyone thinks prices have further to fall. This requires that virtually all bottoms occur before or even well before everyone thinks they will. Let that sink in for a while.
The Gold Market Bottom of January 2016.
Four trading days after the bottom in the HUI in January 2016 I attended the Vancouver Gold Show. It was thinly attended as one might expect after 5 years of relentless downside action in the PM stocks. It was in a way, a meeting of the gold bug remnant… kind of like the last man standing. So this hinted we were likely in a bottom zone for the gold stocks since anyone who wanted out had gotten out and there was no one else remaining to sell. Recall the HUI had just bottomed around 100. I myself remained bearish even though I knew we were near a bottom. Everyones eyes were fixated at the HUI chart and the “obvious” H&S pattern it had traced out. It was clearly setting itself up for a violation of its NL where the gold stocks would crash down to their measured move in a washout bottom. That would of course be the glorious buy point we all dreamed of. But as the great Joe Granville used to say: “What is obvious is obviously wrong”. The bottom had actually occurred 4 days previous.
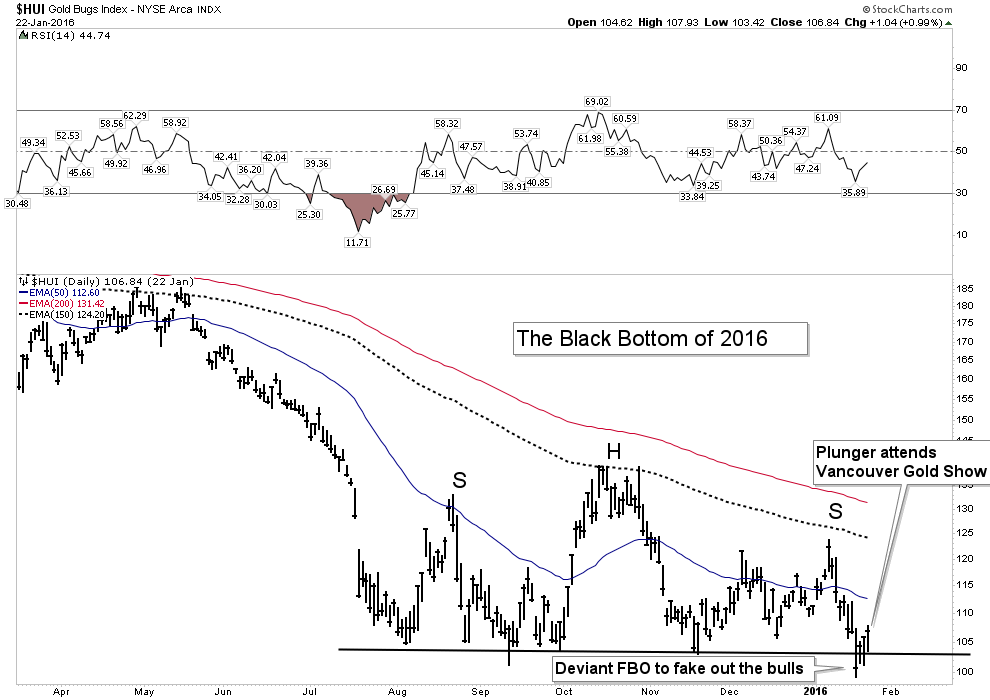
The snap shot of the market above is what the market looked like the day I attended the Vancouver Gold Show. It shows the level which Mr Bull will go to to fake out the masses. Mr. Bear did his work publicly so everyone could see how bearish the set-up was. He built out a broad well define H&S over a 6-month period just so no one could miss it. For good measure at the end he even threw in an FBO to break the NL just to make sure to get the last bull out of the market. In the background, out of view, Mr Bull was working in tandem with Mr. Bear in a sort of tag team relationship. Once Mr. Bear got everyone over to the short side Mr. Bull stepped out from the shadows with guns blazing. He used all of that short interest to power his move higher without taking the bulls with him. He used the bears buying power to power his initial move up while leaving the bulls on the sidelines. He was able to do this by using the bears’ short covering to launch the move. Later on the real bulls would come late to the party after crawling out from their bunkers once the coast was clear. Yes, that’s the deviance of Mr. Bull and Mr. Bear.
And here is the thing, I made it a special point to ask everyone I spoke with where they thought the gold stocks were going. Every single last one of them were bullish on gold but said we were going to drop for one last leg, they were bullish long term, but bearish in the immediate. That bearish H&S was so obvious to everyone, the market had just one last drop to go then everyone would pile in. But Mr. Bull had other plans, he launched vertical leaving all of those wanna be bulls scrambling to catch up.
That experience provided a seminal lesson for me. Bottoms occur when everyone thinks the drop has further to go. That sure sounds like the backdrop that we have been witnessing over the past month. Ask yourself who do you know that put money on the line and took an immediate bullish view over the past 3 weeks? I don’t know anyone and case in point the best analysts out there have recently turned uber bearish over the past 2-3 weeks. Their urgent bearishness was for a seemingly good reason as the price charts have looked dreadfully bearish. Even as recent as Wednesday one of the most capable & insightful advisors I know recommended the public and his subscribers to sell a large portion of their PM holdings and prepare for the worst. Other fine analysts have penned profoundly bearish reports recently. Frankly, its gotten downright depressing for a PM enthusiast.
Let’s be clear I am not saying these opinions are wrong, I am just saying that when informed opinion is so universally bearish it is often associated with a bottom and it demands we take a hard objective look at a bottom possibility.
An alternative view of gold’s big picture.
I have a different interpretation of the long term big picture for gold than what Rambus has detailed in his chart analysis. But before I present it I must add that it is not to be seen as counter of what Rambus has presented. I would characterize his current position after the Wednesday report as cautiously optimistic. One of Rambus’ great qualities is he lets the price action speak for itself and has an ability to turn on a dime when the price action indicates a change. We have seen this from last weeks Friday report to this week’s Wednesday report.
The nature of long term secular trends.
Secular bull and bear markets last a long time. Within their span they encompass several cyclical bull and bear markets within the secular trend. As an example long term US Government bonds topped in 1942 and didn’t bottom until 1983, thats a 41 year secular bear market. The bond market then began a secular bull market which possibly ended in 2016, 33 years later. Some would say it still hasn’t ended yet. Lacy Hunt as well as myself are in this camp. Different asset classes have different characteristics, and gold seems to also have ultra long cycles similar to bonds. Secular bear markets can last 20+ years and secular bull markets can also last well in excess of 20 years.
The Great Secular Gold Bull Market 2001-???
Bear markets typically have much shorter durations than bull markets. In the equity realm they are often 20-30% the length of their preceding bull markets. Since gold underwent a 21 year bear market from 1980 to 2001 I have no problem accepting the proposition that the follow on secular bull could last in excess of 30 years. That would put it to at least the year 2030. As mentioned, there will be 2-3 cyclical bull and bear markets within a long term secular trend. The bear market we have experienced since September 2011 is likely just one of those cyclical bear markets within the full long term duration secular bull market which began in 2001.
Plunger’s Alternative Long Term Gold View
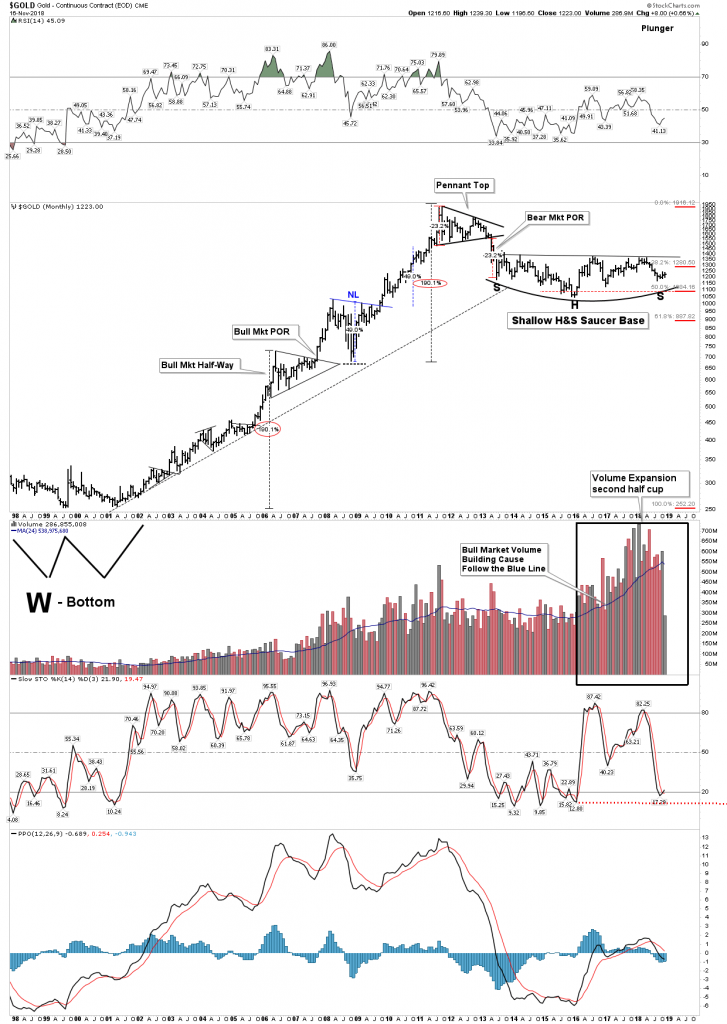
The most recent 10-Year cyclical bull market began with a massive 4-year W-Bottom from 1998-2002. You have heard it before: the bigger the base the bigger the move…(got uranium ?). Once the base was formed gold then underwent a 10-year bull market run. Here are some highlights and mile markers of that bull market.
-
Note the sideways to down action from late 2004-mid 2005. I recall that as a very discouraging period. It seemed that gold had given up and would no longer advance again and I was getting ready to give up on the game. In retrospect gold was just building cause for its next bull market explosive move. The average gold investor figured we were in a bull market but wasn’t totally convinced of it yet.
-
Bull Market Half-Way Point – 2006 to late 2007. I recall this time clearly as it was without doubt the POR of the bull market. When it broke out of the ascending triangle it exploded into a buyers panic as investors realized they were underinvested. The public for the first time were now certain we were in a gold bull market. Note this half-way move was almost exactly the mid point of the bull in extent.
-
The crash of 2008. Even though it seemed like the end of the world at the time, the crash just traced out a nice inverted H&S consolidation for the next move up in gold. It measured out the exact distance for its impulse move above its NL.
-
The 2010-2011 blow off top was powerful, but I would not classify it a mania. There were no lines down the street to buy gold like there were in January 1980. Sure the gold bugs got excited, but it was not universal. Full blown mania tops occur at secular tops and this was not a mania.
The Gold Secular Bull Markets First Cyclical Bear Market – 2011-2016.
The brutal bear market since 2011 completed a 50% Fib retracement of its 10-year uptrend. That is actually pretty standard and it matched the 50% retrace of the 1974-1976 bear market. The monthly chart shows a pennant top where gold finally fell out of the pennant in a two month crash. The daily charts trace out a H&S top. This was the bear market POR where investors finally realized they were in a bear market. In typical form retail investors buy one third of the way into a bear market thinking they are getting bargains, but the buy the dip tactic quits working and when the pain gets too great there comes a moment when the public recognizes it’s a bear market. It’s an instantaneous event usually triggered by a news item which causes a “point of recognition”– the POR. In the case of the 2011 bear it came in the form of the Goldman bear raid on gold in April 2013. It was quite ugly and painful and afforded no escape for the bulls due to the massive opening down gaps.
Bear Market Semantics-
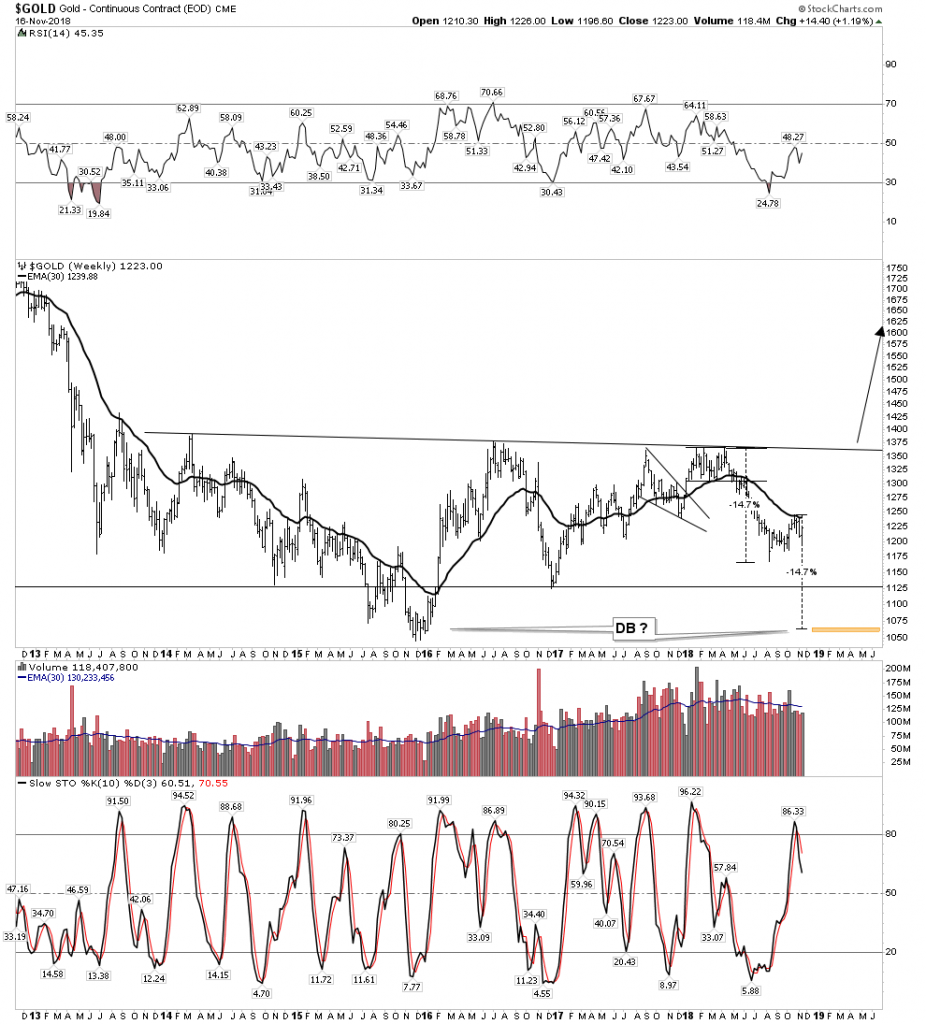
So are we still in a bear market? No, I think the bear market actually ended 4 days before that Vancouver Gold Show I mentioned in January 2016. That was the price low of the bear. Gold bottomed in December and the stocks bottomed in January. Having said that the action since over the past 3 years may be a form of a double bottom or partial retest of those January 2016 lows. This would explain why it hasn’t felt like a bull, because we are retesting the original bottom. So can one claim we are still in a bear market? Honestly you label it what you want to label it, but I see it as a complex test of the original bottom of 2016.
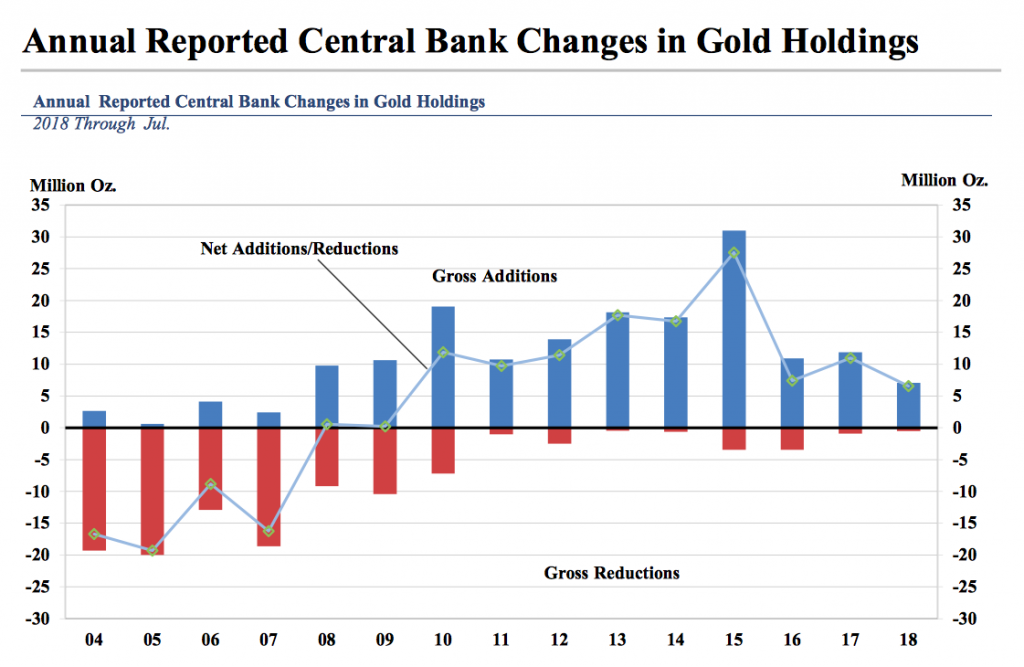
Some of the evidence I point to which backs up this claim that the true bottom occurred in 2016 is the volume you see on the chart above. Note this volume began coming in after the Jan 2016 low was solidified in the market. I call this building cause volume. It’s building pent-up firepower for when gold finally breaks out to the upside. You don’t get this kind of SUSTAINED volume at the end of a bear market. Interest has waned since the powerful leg up in 2016 but this volume shows positioning for the next leg up. So who then is buying? Central banks and big money that’s who. Remember 8-20 years ago central banks were dis-hoarding their gold, well now they are quietly buying it as the chart shows below:
Furthermore, back in late 2015 M&A activity in the sector had dried up and there was NO financing for projects. Companies like Barrick were issuing shares to pay off debt to prevent going bankrupt. That is what one sees at bear market bottoms. We don’t see that today, instead we see M&A activity and economic projects getting funded. This is consistent with a bull market, although early days.
Gold Bottoming Indicators
Let’s take a look at some bottom indicators. Keep in mind that for the most part at an actual bottom most indicators will look dreadfully bad as they have not turned yet. When they finally do turn they confirm the actual bottom of the market is in place. Some indicators give clues that the turn is actually at hand in real time.
Gold vs Silver Non Confirmation
Here we see gold not confirming silver’s recent move to lower lows. This is over a 4 month period and is enough time where they should be in alignment if the trend is still down… Well they are not! Could this be foretelling a turn? Keep in mind that silver tends to lag gold.
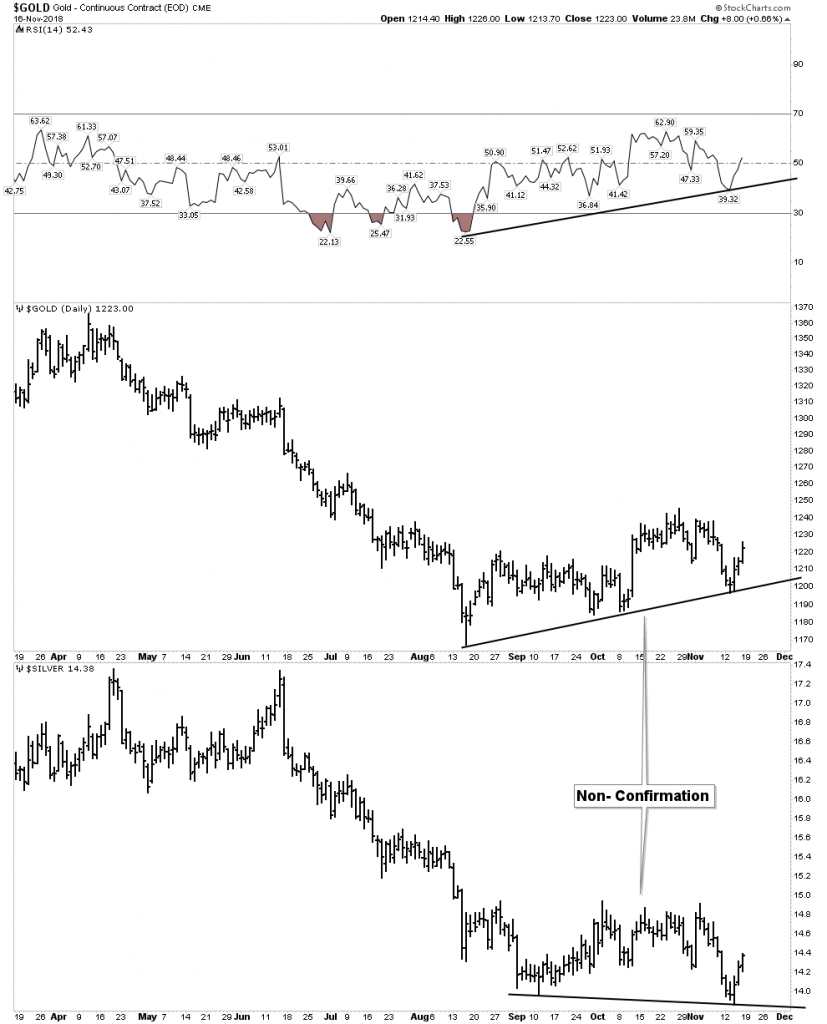
The level of pessimism has been off the charts when silver hit its recent bottom. RSI is in line with gold’s move up.
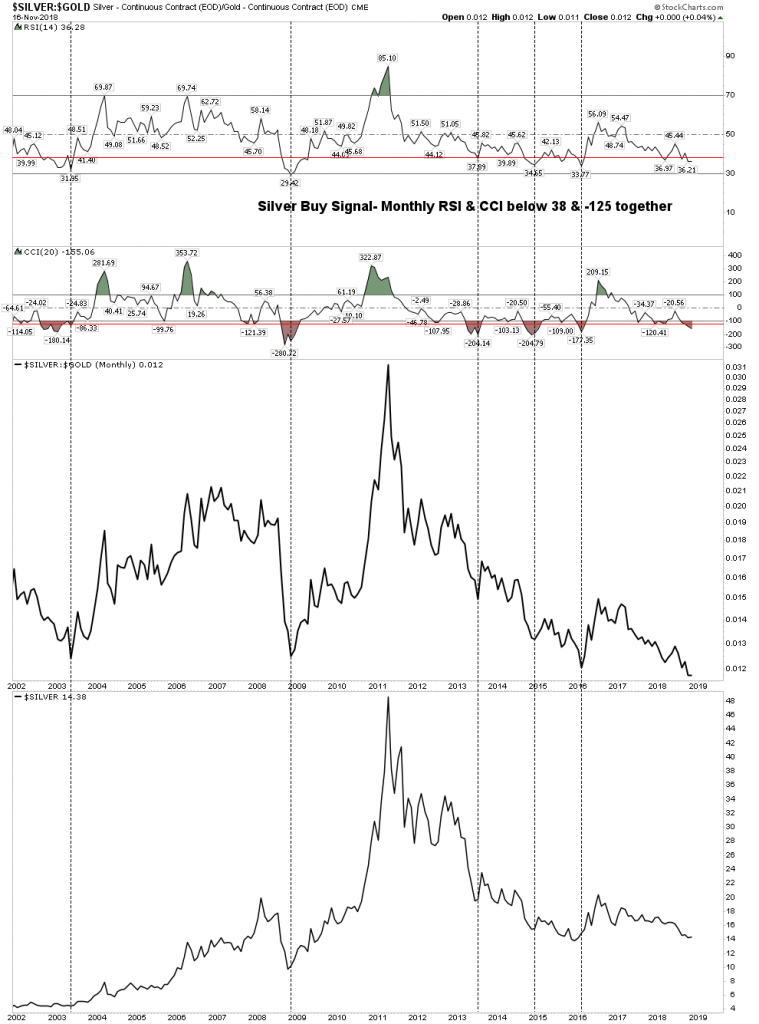
Plunger’s Silver Buy – Signal Indicator
You can see in the below chart we are in the zone for a turn in price. Once CCI and RSI turn up it will signal a buy. We could be very close.
HUI:GOLD
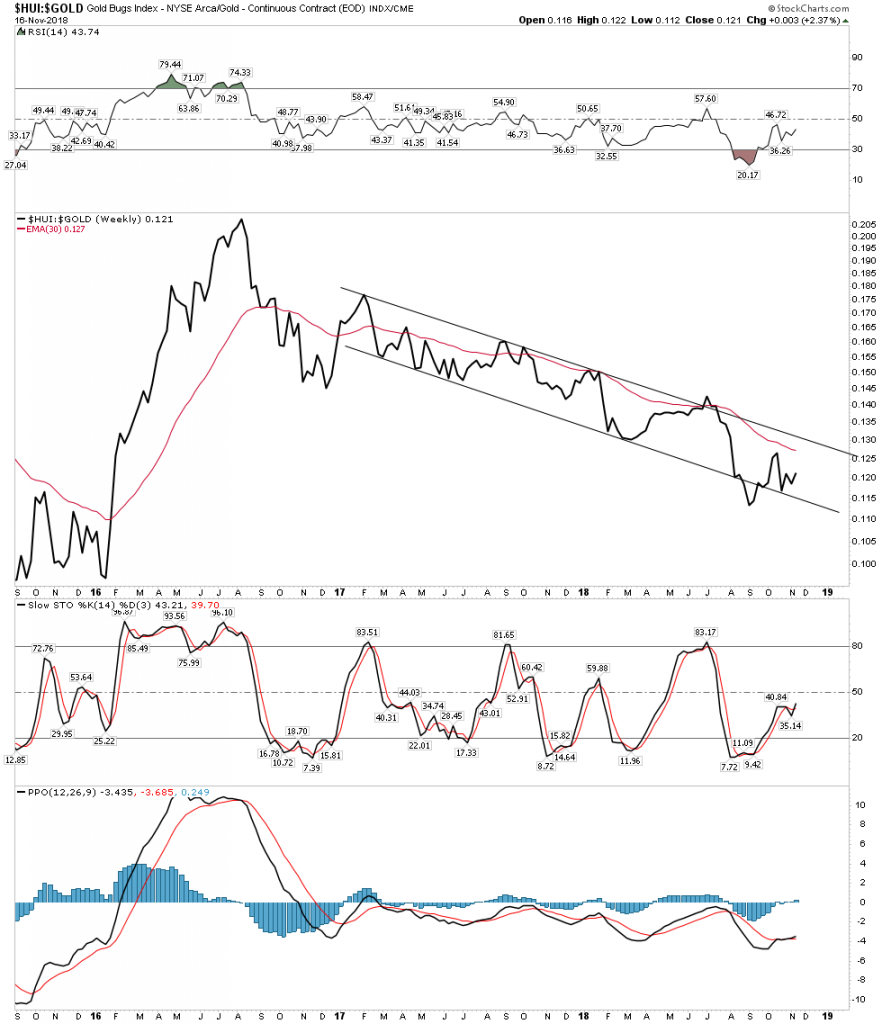
HUI:GOLD is the premier indicator for an uptrend in gold. Look closely at the action over the past 3 months as we now have a series of higher lows. We had a blow out bottom below the trend channel which reached 20 on the weekly RSI which is very extreme. Slow Stoch have now turned up and PPO is ready to join. This could be saying a bottom is at hand.
Silver:Gold Ratio
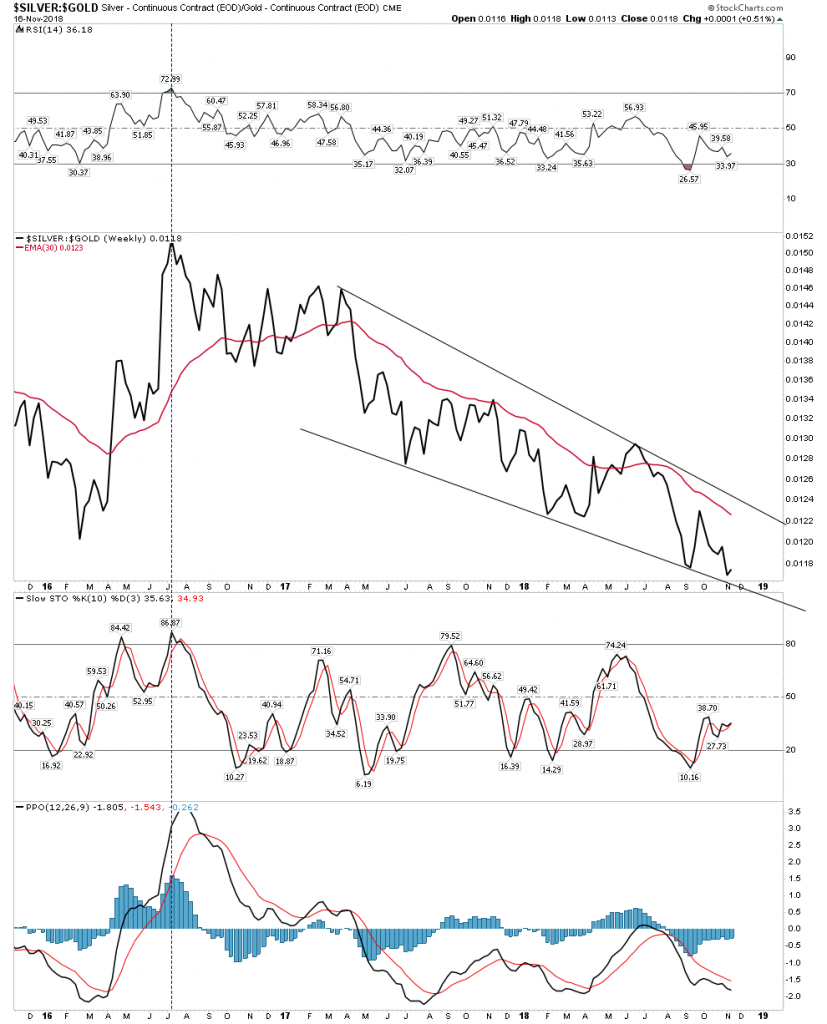
In any sustained gold advance this ratio will be in the upward configuration. Slow Stoch seem to be making a turn here. Note the positive divergence of the RSI with the recent low in the ratio. This is indicating a bottom is at hand and it’s going to make the turn.
SIL:GDX
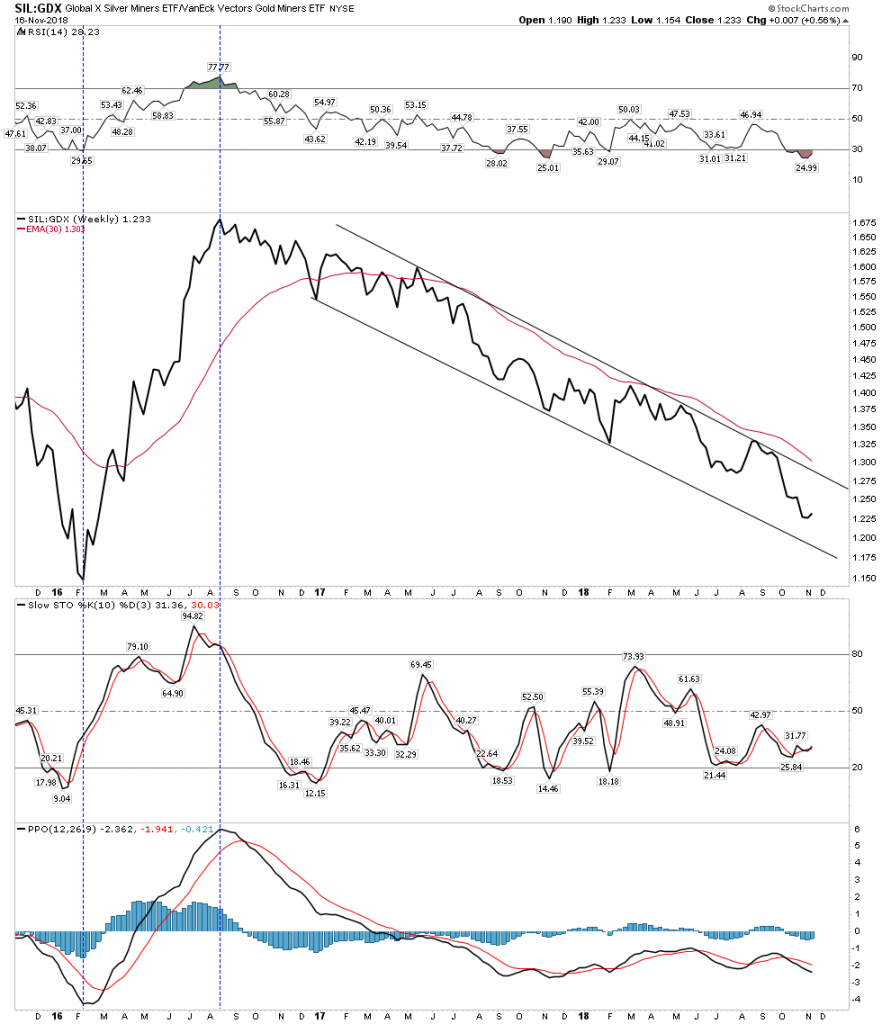
SIL:GDX can be considered a lagging indicator, but it’s worth looking at because of the RSI. It hit an extreme which should limit the move to the downside. Silver stocks don’t start outperforming gold stocks until the rally gets well on so we wont expect a turn until later, but the depths of the plunge tells us it’s not likely going down any further.
Gold Miners Up Vs Down Volume
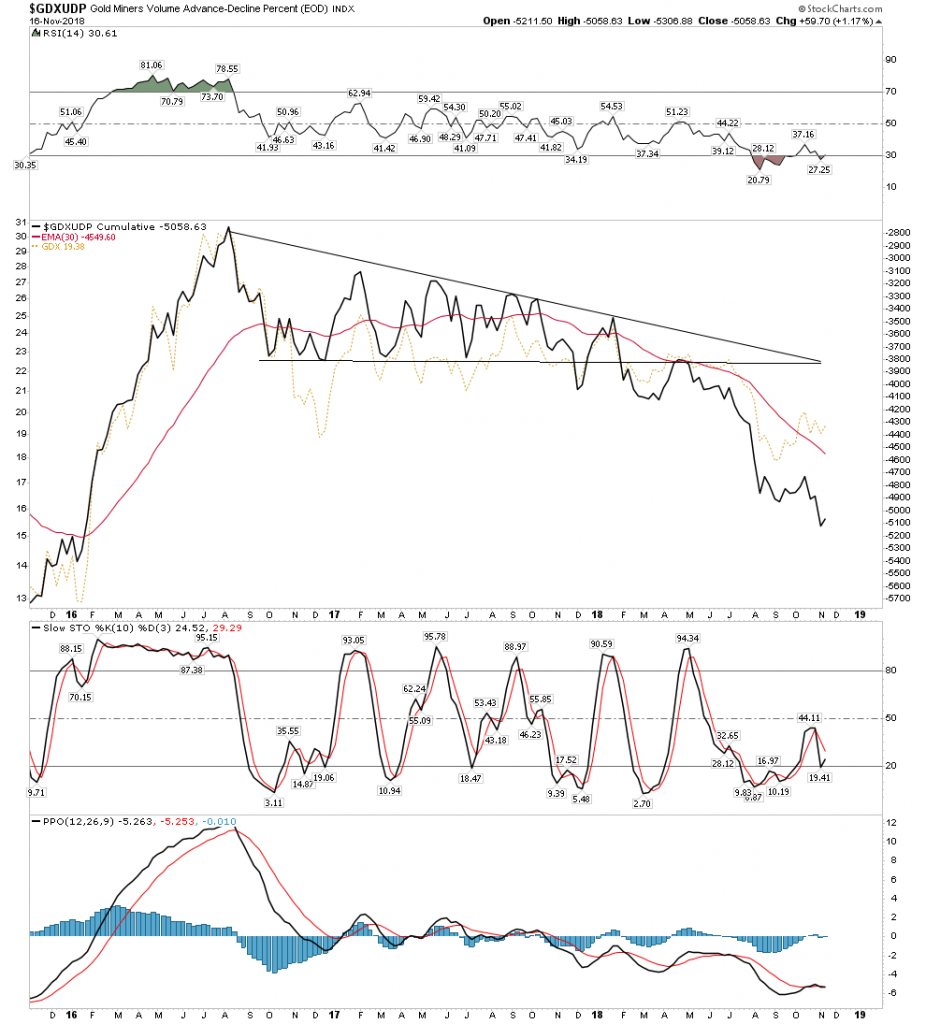
This Adv/Decline volume chart shows a blow out to the downside. Shall I call it capitulation? Note the divergences in this chart. The GDX price (dashed gold line) shows a positive divergence . More down volume than up yet the stocks refuse to go lower. Next we see a positive divergence in RSI with the lower low of the index. This chart is saying somethings up. Again this is what occurs at bottoms.
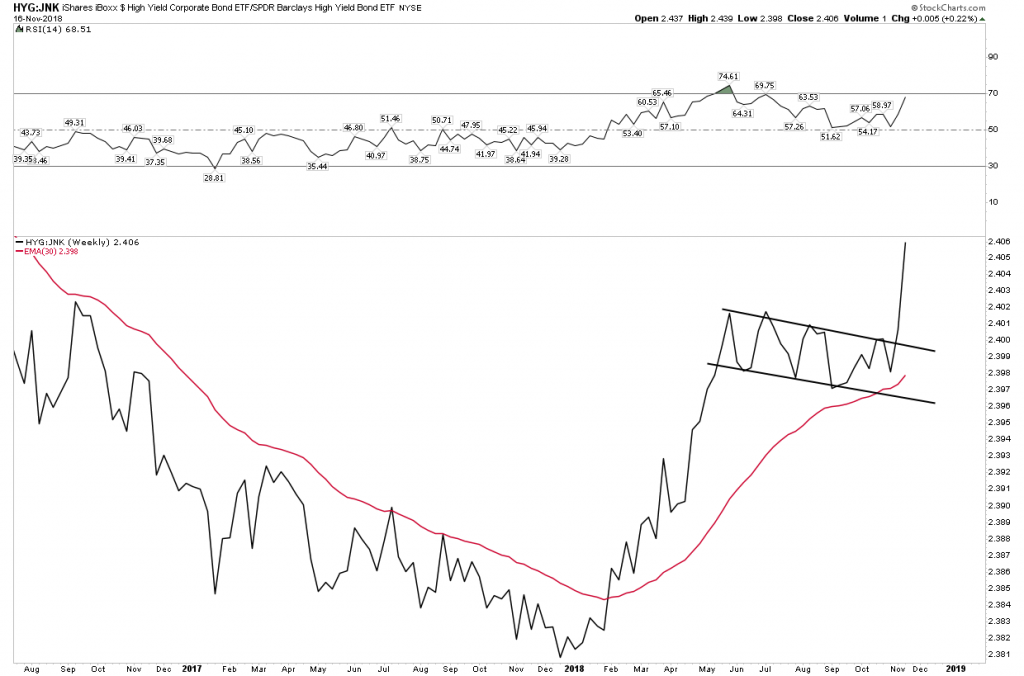
The PBC Credit Turn – Credit Stress Arrives At The Center
In a financial crisis junk bonds underperform high grade corporate bonds. In the GFC of 2008 it was a total blow out. In all likelihood it’s going to happen again in the coming PBC crisis. In the below chart look what’s happening right now: High Grade Corp bonds are breaking out relative to Junk bonds. This is when credit stress gets transmitted into the system and gold begins to perform. Just another clue that a turn may be at hand.
If the USD goes up isn’t gold supposed to go down?
No, not necessarily. This has been the case in recent times, however once financial stress enters into the market they both can go up together. That’s because they are both perceived as safety assets and stores of value. In the recent stock bull market this hasn’t been very important to people so gold did not catch the safety trade as the USD went up, but that will change once the PBC becomes more advanced.
Worst-Case Gold Outcome.
With gold and the gold stocks having such a bad year up to now it may take some time for them to both make the turn chiefly because we are now entering into tax loss selling which can put downward pressure on the group due to its underperformance this year. It is possible that the gains of the past 2 months may need to be retested in a form of a double bottom down to the 1180 area for gold. I would regard this as a gift buying opportunity. The absolute worst case in my view would be to double bottom the late 2015 lows down around 1050-1075 early next year. This worst case scenario would be a measured downside move as shown on the chart below, however the charts above indicate it is not the most likely outcome. The bright side of such a move however, is it would solidify a massive base for an extended upside move. Personally, I am not going to wait around for such a theoretical low as I believe the message I have shown above is to start buying right now.
How High Could The Gold Stocks Go?
If one wants to get his head around the ultra long term trends in the gold market he should examine the history of the BGMI. It’s the only current index which has a long term duration. The BGMI gives us a view from horizon to horizon and unveils a most shocking possible outcome for the gold stocks and what they may be in for over the next 10 years.
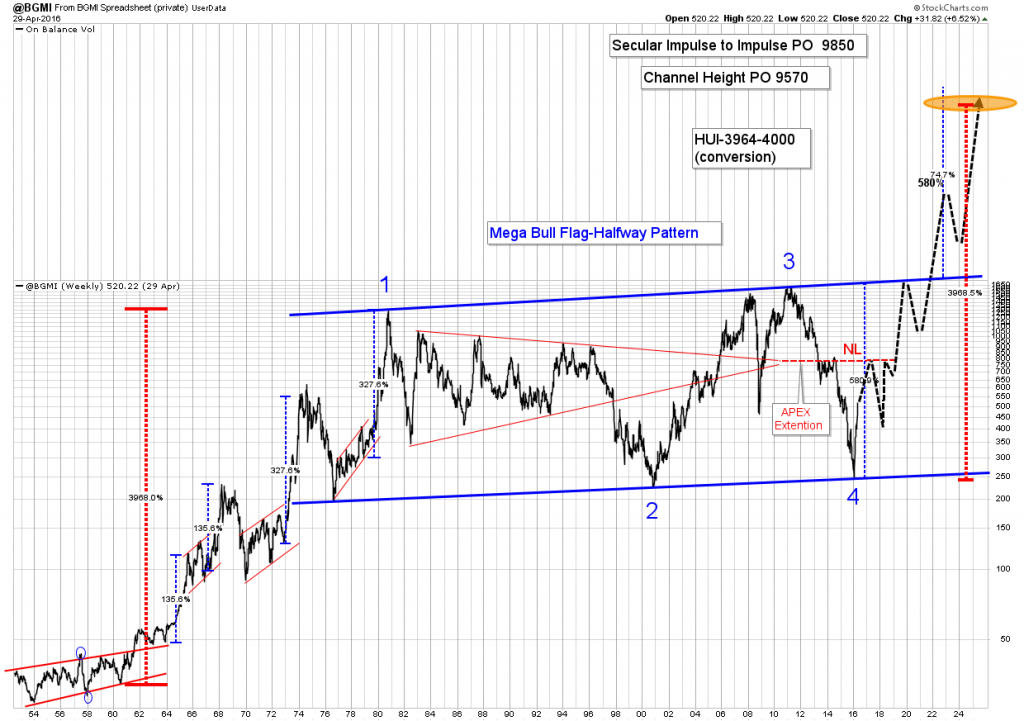
A 20 year impulse move 1960-1980
That’s what this chart reveals – a massive impulse move lasting 20 years from 1960-1980. As students of the market we know that these kind of massive moves need lots of time to digest themselves once they reach their zeniths. The above chart reveals that the consolidation bordered by the thick blue channel could end up being about a 40 year duration. There is plenty of precedent for this as oil underwent a 30 year consolidation from 1974-2004 after its massive impulse move from $1.85 to $30 bbl from 1972-1974. Once oil broke out of its consolidation channel in 2004 it ran from $40 to $147 in three years. This demonstrates historic precedent.
So we see in the gold stock index above that the past 40 years has served as a consolidation zone for the massive 39X impulse move from 1960-1980. Chartology principles would suggest that a breakout move of equal proportions above the channel equates to an estimated HUI level of between 3964-4000. Yes, you read that correctly… that would be a 27X return for the INDEX from todays level when converting from the BGMI to the HUI.
The principle at hand is that gold stocks have been coiling energy for 40 years now and when they finally break above the 2011 highs they will be unleashed into a powerful impulse upward. It is my analysis that this is what the massive 5-year saucer shaped base we see in the gold chart at the top of this report is telling the world. Remember, the bigger the base the bigger the move.
It may be time to start deploying that well vetted buy list you may have been working on. Mr. Bear has spent the past 3 months clearing the decks by sending bullish investors into their bunkers , maybe he is about to hand over the mantle to Mr. Bull.
For More Plunger…Visit Rambus Chartology
*********


