Double Shot of that Golden Love
 share
share
 share
share
 share
share
 share
share
 share
share
Back in ’63, Dick Holler & the Holidays crooned a tune (penned by Don Smith and Cyril Vetter) entitled  “Double Shot (Of My Baby’s Love)”. The catchy piece has since been covered ‘twould seem some 5,000 times, similar to Gold’s being recognized as real money for some 5,000 years. Be that exaggerative or otherwise, we’ve just been gifted a “Double Shot of that Golden Love” as follows:
- Shot One: as you regular readers already know, just back on 25 July, Gold’s weekly parabolic trend formally flipped from Short-to-Long;
- Shot Two: price’s settle this past Thursday (3483) in turn confirmed Gold’s daily parabolic trend also flipping to Long.
“I’m feelin’ the love there, mmb!”
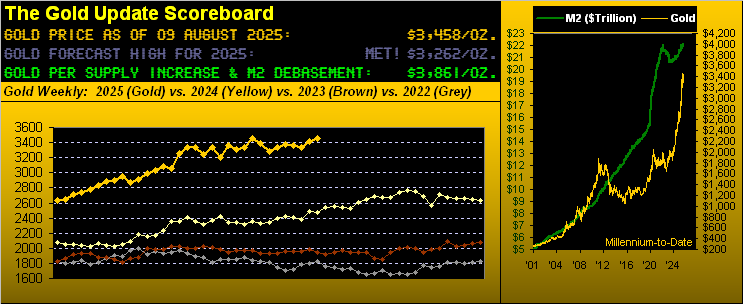
As well we ought, Squire. Toward settling yesterday (Friday) at 3458, Gold’s “continuous contract” en route made an All-Time High at 3534, albeit that needs a bit of qualification, by which again we bullet-point three types:
- Spot Gold: is the de facto hard-money resource, the official All-Time High for which is 3500 as traded this past 22 April;
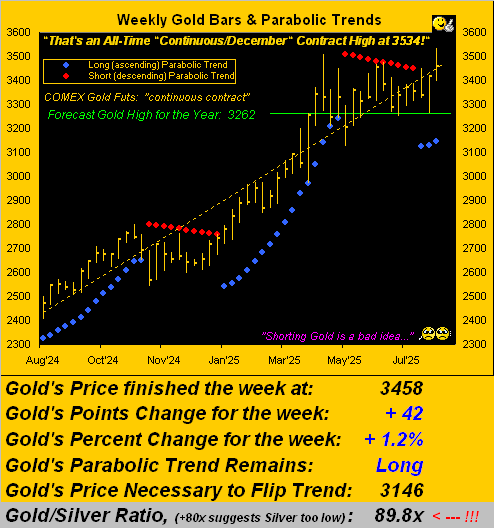
- Continuous Gold: is the chaining together of futures contracts (Gold’s most liquid trading form) such as to present (per our weekly bars graphic) a continuous history of the futures price, its new All-Time High just achieved as noted yesterday at 3534;
- December Gold: is the current so-called “front-month” futures contract, its All-Time High too achieved back on 22 April at 3586 (when June was then the “front-month”, with its 3510 high).
Regardless of which All-Time High you prefer to apply, what we now see as key is December’s 3586 being relatively short-lived (no pun) given the timing of this fresh “Double Shot of that Golden Love”, should price evolve similarly as it has by both the various weekly and daily parabolic Long trends across the past 10 years.
Recall from two missives ago our historical table of Gold’s prior 10 weekly parabolic Long trends having produced average upside price follow-through of +10%, which applied to this stint would find Gold well up into the 3600s. And per our Market Rhythms’ analyses, Gold’s best study for pure swing consistency is its daily parabolics, presently ranked (on a 24-test basis) at No.1 of the 405 rhythms tested nightly.
All of which in an encapsulated Golden nugget means we anticipate still higher highs through these ensuing weeks.
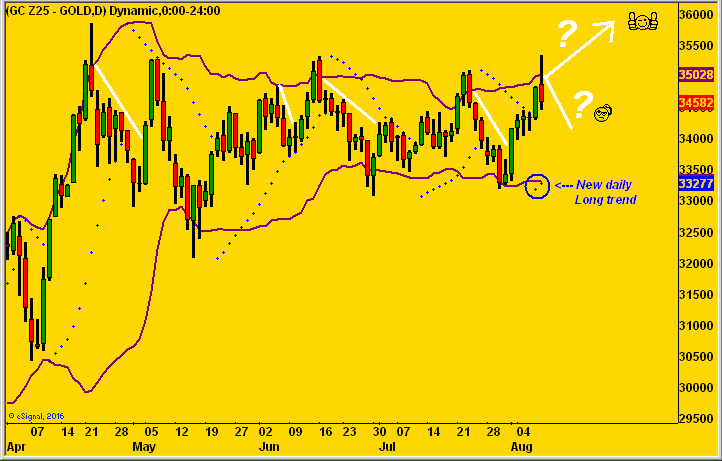
That stated, even the best markets’ analyses are no holy grail, provably as signals can — and do — fail. To wit, beware of John Bollinger and his Band(s). The following graphic depicts December Gold by the day from this past April-to-date. The two encircled rightmost wee blues dots are, of course, the commencement of this new daily parabolic Long trend for Gold. However, we’ve also applied the two violet Bollinger Bands, the upper through which — at Friday’s open — price penetrated (thank you StateSide tariff on Swiss Gold … see our close). Therein, note price’s imminent decline per the white lines after such prior upside penetrations:
“But it’s different this time, right mmb?”
Our sharp-eyed Squire gets it. Unlike the graphic’s prior “white-line” declines following upper Bollinger Band penetrations occurring into already well-established parabolic Long — and even Short — trends, this time ’round we’ve the “Double Shot of that Golden Love” of both the weekly and daily versions having instead just commenced. Further, being this near to the next All-Time High per the December contract (3586), we sense the net trading push is in that direction, (in turn slapping the Shorts silly). So as we turn to Gold’s weekly bars from a year ago-to-date, clearly the slant is toward still higher levels:
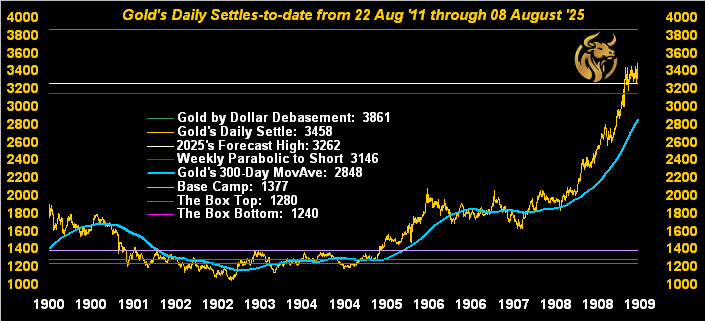
More broadly, here next we’ve Gold by the day across the past 15 years-to-date, notably with respect to price’s once highly-regarded 300-day moving average. The Gold Short may argue that price is far too high above the average. To which the Bull shall snort and retort that price today (3458) vis-à-vis the value of Gold by Dollar debasement (3861) is at a very attractive -10% discount. Don’t pull the wool over the bull:
Yet just as Gold remains undervalued relative to its most foundational metric of Dollar debasement, so does the S&P 500 remain overvalued (understatement) to its most foundational metric of earnings. With but a week to run in Q2 Earnings Season, an above-average 79% have beaten The Street’s marketing tool known as “estimates” … but just 67% — only one pip above the historical mean — have improved their year-over-year quarterly performance. Is it any wonder the “live” price/earnings ratio is 46.7x? Baffling is the S&P red line in the Baro:
As to the Econ Baro itself, the past week’s set of incoming data points elicited a bit of a negative bent: of the eight reports, just three bettered their prior period result, Q2 Productivity being the star there in swinging from -1.8% in Q1 to now +2.4%. The five stinkers were lowlighted by Factory Orders, after being +8.3% for May, shrinking -4.8% in June. Oh yes, and with respect to last Tuesday’s -0.5% “the world is ending” drop in the S&P, ’twas ever so severely blamed on the Institute for Supply Management Services Index’s wee July drop from June’s to 50.8 to now 50.1. ‘Course, this time of year, the FinMedia desks are staffed by summer interns: “Hey, look at this plunge! That’s headline stuff, man!” (They’d be better off in Summer School learning arithmetic).
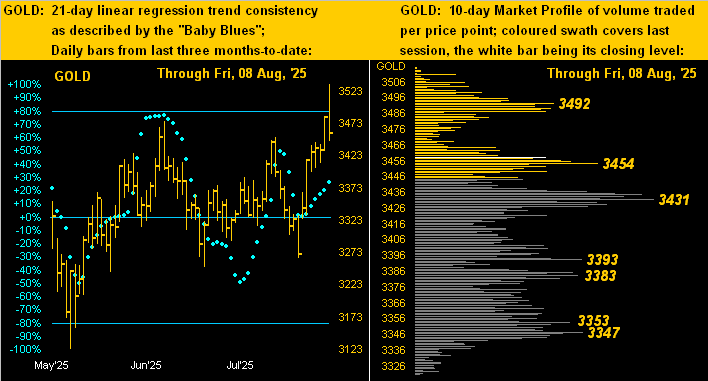
As for Gold’s Friday “Spike n’ Plunge”, ’tis the rightmost bar below on the left as we view the lot across the past three months-to-date. Whilst arguably a “failure day”, of greater import are the rising “Baby Blues” indicative of the regression uptrend nonetheless gaining strength. Too, on the right, price remains in the upper-third of the 10-day Market Profile, the most volume-dominant underlying supporter being 3431:
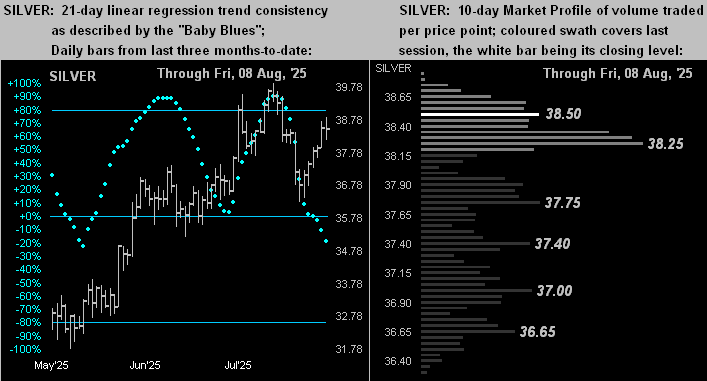
But not exactly similar is the like graphic for Silver. Her “Baby Blues” (below left) are falling away as the regression trend has rotated to negative; but perhaps ’tis mostly momentary given her price getting a grip across recent sessions. And by her Market Profile (below right), 38.25 shows as key support. Moreover, how close is Sweet Sister Silver to 40! She has not traded at that handle since 21 September 2011! And we have to think that given Gold getting on the move per both its fresh daily and weekly parabolic Long trends, Silver ought finally get swept up over 40. “C’mon Sister Silver!!”
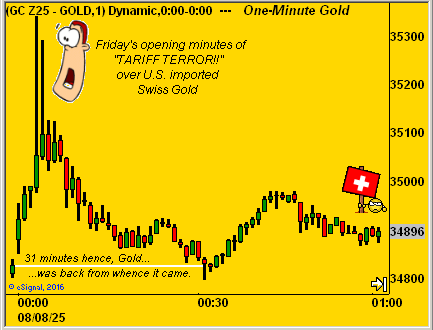
As teased, let’s close with the high-drama event of the week: the evoking of “Tariff Terror!” on Gold bars of both one kilogram and 100 ounces imported from Switzerland into the U.S. And with the utmost respect for our beloved Swiss family to the north of us, we had to chuckle. We don’t know how many folks StateSide regularly engage in buying 1kg bars of Swiss Gold (currently $122k/bar + 39% tariff = $170k/bar), let alone nearly triple that for a 100/oz. bar. Regardless, our mobile phone here lit up with chaotic panic over the 39% imposition, (for which ’tis now said may be misinterpreted).
‘Course, unlike today’s FinMedia, the late great Paul Harvey would have additionally reported to us “the rest of the story”. To be sure, after having settled Thursday at 3482, four minutes into Friday’s session found Gold having spiked +1.5% to the aforementioned new “continuous contract” All-Time High of 3534. But “left out of the story” was that 31 minutes into the session, Gold was back down to where it had ended Thursday. Further, the Swiss Franc was completely docile over it all, trading just 54% of its EDTR (“expected daily trading range”) on Friday. As for Gold, here is Friday’s first hour of trading by the minute, courtesy of the “If You Blinked, You Missed It Dept.”:
Either way, our double-shot bottom line is: do not miss out in owning Gold, and Silver too with $40/oz. in view!
Cheers!
…m…
www.TheGoldUpdate.com
www.deMeadville.com
and now on “X”: @deMeadvillePro
*******
share
share
share
share
share

Mark Mead Baillie has had an extensive business career beginning in banking and financial services for two years with Banque Nationale de Paris to corporate research for three years at Barclays Bank and then for six years as an analyst and corporate lender with Société Générale.
For the last 22 years he has expanded his financial expertise by creating his own financial services company, de Meadville International, which comprehensively follows his BEGOS complex of markets (Bond/Euro/Gold/Oil/S&P) and the trading of the futures therein. He is recognized within the financial community of demonstrating creative technical skills that surpass industry standards toward making highly informed market assessments and his work is featured in Merrill Lynch Wealth Management client presentations. He has adapted such skills into becoming the popular author each week of the prolific “The Gold Update” and is known in the financial website community as “mmb” and “deMeadville”.
Mr. Baillie holds a BS in Business from the University of Southern California and an MBA in Finance from Golden Gate University.
More from Gold-Eagle


