Dow Jones' Step Sum And Volatility Update


Last week, the media celebrated the Dow's best October ever! But Monday was Halloween, and the first week of November more trick than treat for investors with the Dow down 248 points by Friday's close. Well, good and bad weeks come and go, and it's hard to say exactly what will happen from one week to the next. So why guess? Its best to take a longer term look at the Dow Jones to determine exactly where we are, before we ponder where it might go in the months ahead.
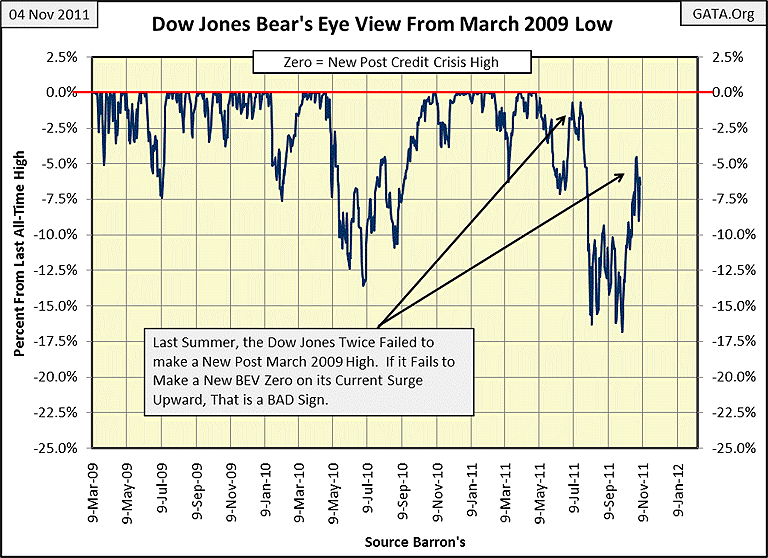
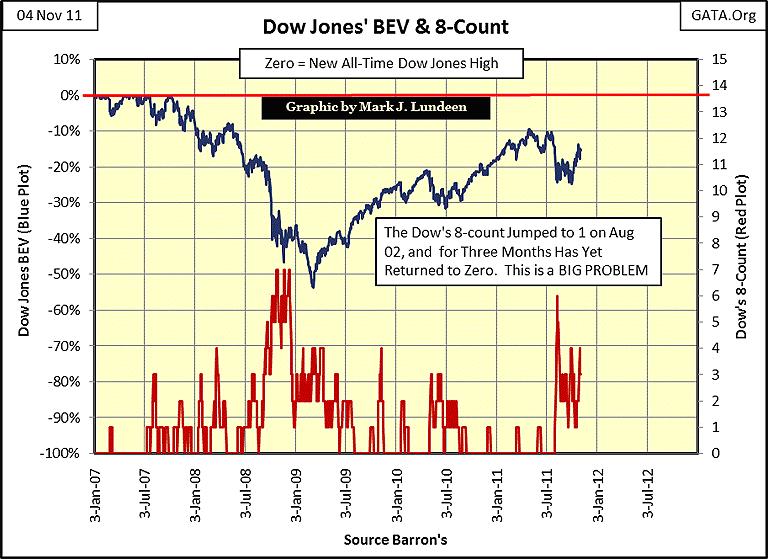
Examining a BEV plot of the Dow from its March 2009 low can be very useful at a time like this. Last summer, the Dow twice failed to make a new post credit-crisis high, just before it dropped below its BEV -15% line. Then from October 3-28, it climbed from -17% to above -5% on the BEV chart; that's a huge 12 BEV points in a short time. After an advance like that, the Dow deserves a rest, so it was reasonable to expect this week's decline. But now the stock market is at a critical junction. Within a reasonable amount of time, say in the next six months, the Dow must make a new BEV Zero, or strike out. But with the recent surge in the Dow's volatility I expect that like Mighty Casey, the Dow is going to strike out.
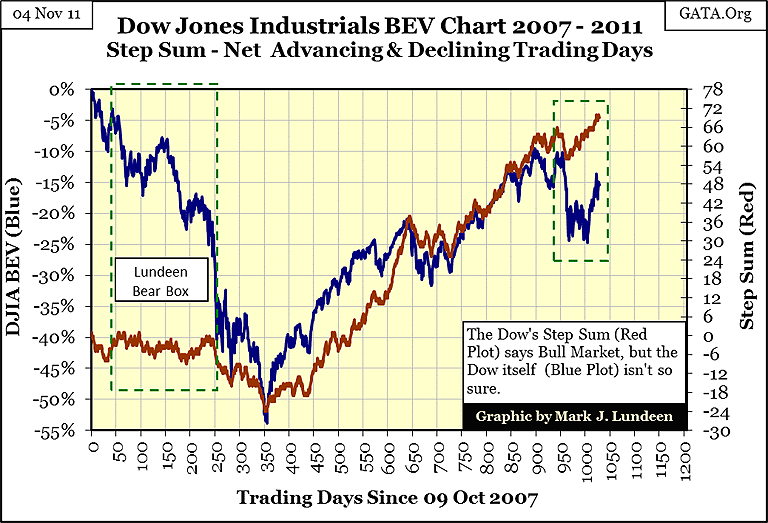
If it does strikeout, it won't be from a lack of effort. Look at the Dow's step-sum below, it just keeps chugging upwards. With all these net up days, one could reasonably expect the Dow Jones to have already made a new All-Time High. I think it's significant that the Dow is still struggling to make a new post credit crisis high.
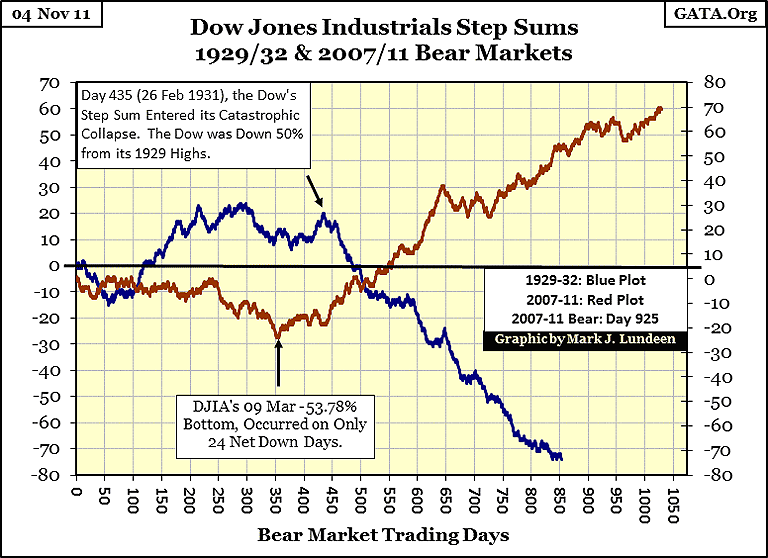
One thing for sure, every massive bear market since 1900 has seen its step-sum collapse catastrophically, the one thing that didn't happen during the 2008-09 credit crisis. So what exactly is a catastrophic collapse? That point in time during a bear market (as seen in the step-sum), when the bulls realize that continuing to resist Mr Bear is futile. As the step-sum begins to collapse, hopelessness and fear take over, and bulls begin to dump their holdings as the bear market enters its climactic, liquidation phase. From October 2007 to March 2009, the Dow declined over 50% on only 24 net down trading days. That meager decline in the Dow's step sum showed no sign of the capitulation one would expect to see at a true bear market bottom. For that reason, I never believed the Dow's March low (-53.78%) was the final low of our bear market. That means that worst is yet to come, or so I expect.
Below is a comparison of the Dow's step-sums from the Great Depression bear market, and ours today. As you can see, our bear market (red plot) has already lasted much longer than the 1929-32 bear. We can also see that for the first 435 days of the Great Depression bear (blue plot), there were more up days in the Dow than down. Even though the value of Dow Jones had declined 50% from its peak in 1929, the bulls were still hoping for the best. After all, since 1885, the smartest thing any investor in the stock market could do is to sell the farm and go all in after the Dow Jones had dropped 40% from an all-time high, except from 1929-32. Looking at the Great Depression's bear market plot (blue plot), it becomes apparent that the bulls surrendered in fear on day 435 as the Dow's step-sum collapsed CATASTROPHICALLY, ultimately taking the Dow Jones down to its -89.19% bottom in July of 1932.
Compare that to the Dow's current step-sum (red plot); it continues to advance. I guess it's only to be expected that the Dow, and its step sum, would continue advancing considering all the trillions that have been dumped into the financial markets. But this rescue only made our present situation worse, as it was financed with debt that can never be paid back. But world events will eventually overwhelm the best efforts of the Federal government's continuing manipulation of the stock market, and the debt taken on to finance the 2009-11 dead cat bounce will only make the liquidation phase of the bear market worse.
But it's hard to believe that anything could make our current situation worse. After the high-tech fiasco, the housing bubble, Enron, World Com, AIG, Lehman Brothers, Bear Sterns, Madoff's Ponzi scheme, and now MF Global, headed by a former CEO of Goldman Sachs, and former governor of the state of New Jersey, it's becoming undeniable that the Big Apple is full of worms, and that isn't good for a financial system based on confidence. Still, after trillions of dollars in rip-offs and scandals over the past twenty years, most people still trust Wall Street with their money - but for how much longer? We'll know when Wall Street, and their regulators, receives their vote of no confidence from the stock market as soon as we see the catastrophic collapse of the Dow Jones' step-sum, just as italways does before any bear market comes to its termination.

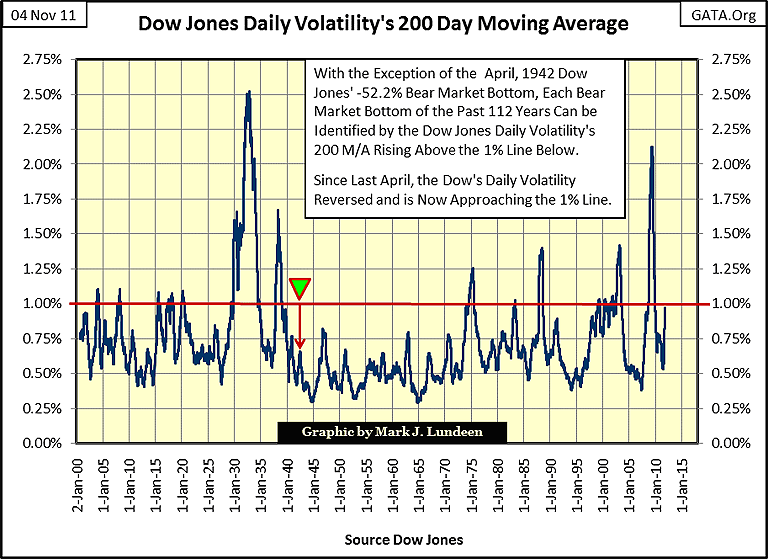
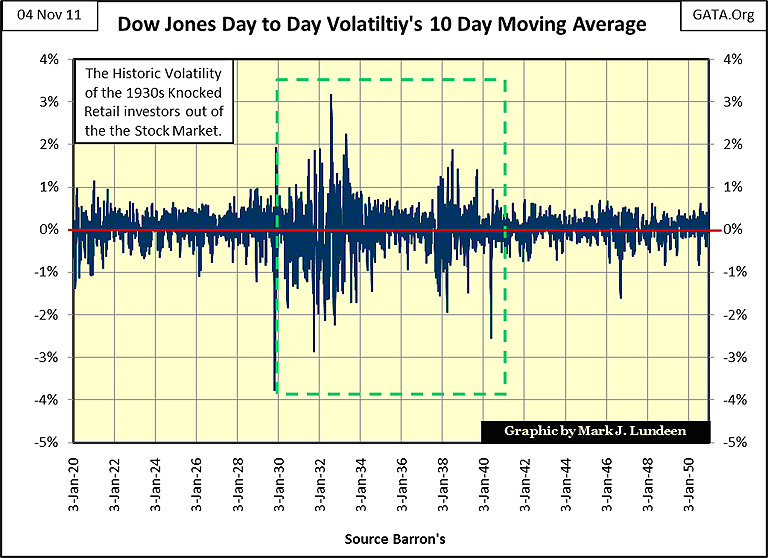
In another troublesome sign, the Dow Jones daily volatility 200 day moving average (percentage move from one day to the next) is approaching its 1% line. This week it closed at 0.97%. Since 1900, bad things happen in the stock market when the Dow's volatility's 200 day M/A exceeds its 1% line. The +1% peaks in the plot below identify bear markets.
Below is a table showing every significant spike above the 1% line seen in the chart above. The Dow's volatility spike is seen on the left side of the green divider, with the associated Dow bear market on the right. Note how the spike's peak value is usually a lagging indicator of Dow Jones's bottom. The Great Depression bear market bottom is the exception, with volatility peaking in May 1932, not after the Dow's July 1932 bear market bottom. The small 1983 spike corresponds with the beginning of the 1982-2000 Dow Jones bull market. I did not include it in the table, nor will you see an entry for the April 1942 bear market bottom as volatility for this massive bear market was actually very tranquil.
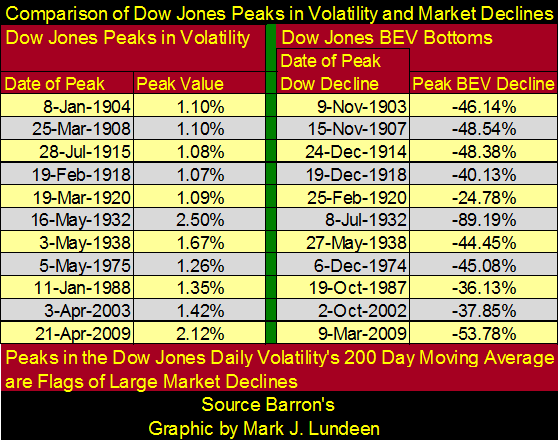
In the chart above the table, I've placed an arrow and marker for the Dow's April 1942 -52.20% bear market bottom, the second deepest bear market until March 2009 knocked it into third place. This massive bear market is not shown in the table above, as it occurred with normal volatility. It's like the bottom dropped out from the floor of the stock market; and no one gave a damn. The early 1940s was a strange time for the stock market. When Pearl Harbor happened on Sunday, December 7th, the next day, Monday, December 8th, the stock market closed down a mere 3.5% as President Roosevelt declared war.
What caused the low volatility of the 1942 bear market bottom? The public had already been driven out of the stock market after the two giant volatility spikes of the 1930s, and their 1932 & 38 bear market bottoms.
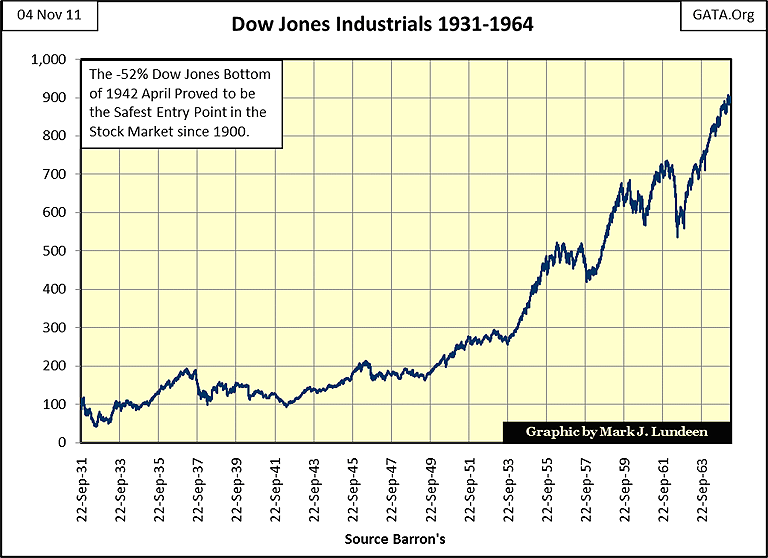
Also, the United States had entered a global war just five months before, so people were thinking of other things than their long ago liquidated stock portfolios. So, Wall Street's large financial companies were in control of the stock market, and the Dow Jones declined by more than 50% with no panic or media fanfare. After the 1930s, anyone outside a Wall Street investment bank could care less that the Dow Jones had fallen to its second deepest bear market bottom since 1885. The public and media had become detached from the financial markets. But what a great bear market hard-bottom the Dow saw in 1942! In the chart below, we see the post April 1942 Dow Jones doing very well for the next twenty years.
At the bottom of today's bear market, I expect to see another excellent entry point into the stock market, for the same reason April 1942 was: the public had lost all trust in the stock market. Wall Street had to become honest or go out of business.
But we are still far from a good entry point back into the stock market, as detached still doesn't describe the public's emotional state when it comes to Wall Street. So, seeing the Dow Jones volatility 200 day M/A just a hair short of reaching 1% is a very alarming development in the stock market.
And those Dow Jones 2% days just keep on coming. The Dow's 8-count ended the week at three (2% days occurring in the last eight trading sessions), and the pattern is starting to look suspiciously similar to the first three months of 2009. So far nothing really ugly has happened in the stock market, but as we navigate the minefield of European sovereign debt defaults ahead of us, and questionable dealings of Wall Street firms' management of their clients funds, one misstep could cause market volatility to explode.
Europe's problems are not isolated from the American banking system, thanks to the derivative market. And then there is the MF Global situation; where hundreds-of-millions of client's funds were comingled with their broker's trading account. I assume this policy was implemented when Jon Corzine became CEO of MF Global. If so, Mr. Corzine was trading his client's money for quite a while. Question: when MF Global made money on their client's money for the past year, did they share the wealth with them? Hell No! But when Jon Corzine lost their money, MF Global's clients discovered that Corzine's risk was all theirs!
Where do the malignant narcissists in control of the global-financial system come from? Considering that Wall Street doesn't recruit from God-fearing synagogues and churches, but exclusively from our left leaning college system, I have to believe that these well-paid bandits are only doing what they were taught in college. If someone in a large financial institution had objected to using clients' funds for the firm's trading profits, and contacted the SEC or the CFTC, what do think would have happened? After the Madoff scandal, where Harry Markopoulos fruitlessly attempted to get the SEC to investigate Madoff for ten years, and Andrew Maguire's attempt to inform the CFTC of JP Morgan's silver market short-side manipulation, I expect that the regulators would contact the whistle blower's boss to have an honest man fired.
"Higher Education" bears much responsibility with the current state of global finance. After all; a college education with a post-graduate degree are requirements for the top jobs on Wall Street, and for NY State and Federal financial regulators too. No doubt these wise-guys learnt much from college professors, like our current Fed Chairman, Doctor Bernanke, except for what is right, and what is wrong. I expect that Mr Bear is going to send them all to a re-educational facility, shortly after the Dow breaks below its March 2009 53% bottom.
Mark J. Lundeen
[email protected]
[email protected]


