The Dow Jones Is Trending Down Precious Metals Are Trending Up


The Dow Jones in its Bear’s Eye View Chart below, is trending down to its BEV -10% line, closing the week at a BEV of -8.65. However, on Tuesday’s close the Dow Jones found itself with a BEV of -9.52%, only 0.49% from breaking below its BEV -10% line. The Dow Jones’ decline from its last all-time high on January 4th hasn’t been dramatic, but it has been relentless.
I’m going to assume the Dow Jones below will be sporting a double-digit BEV value sometime in the next few weeks; what then? It could rebound back to a new all-time high, or maybe just back to scoring position (BEV -0.01% to -4.99%). However, with the world as it is today, seeing the Dow Jones rising up to new all-time highs any time soon is unlikely. So, when the Dow Jones does break below its BEV -10% line in the chart below, which I believe it will, the question is does it continue deflating in an orderly manner, or will it at some point collapse in a selling panic?
For myself, I’m on the side of the Dow Jones collapsing in a selling panic, but that may not happen until the Dow Jones breaks below its BEV -15%, or maybe even its BEV -20% lines. Whenever the Dow Jones does begin collapsing in a selling panic, it won’t be because it declined below this, that or some other BEV line.
The big problem the stock market has in March 2022, is the financial markets are grossly overvalued, and have been for decades. It doesn’t help Wall Street that our current politicians, and other government officials, are proving to be so inept in foreign and domestic matters.
Whenever markets become this overvalued, the bursting of the bubble in market valuations always becomes a messy business. Riding the stock market down in a selling panic, while holding firm to your favorite glamor stocks, is a market experience you can live without.
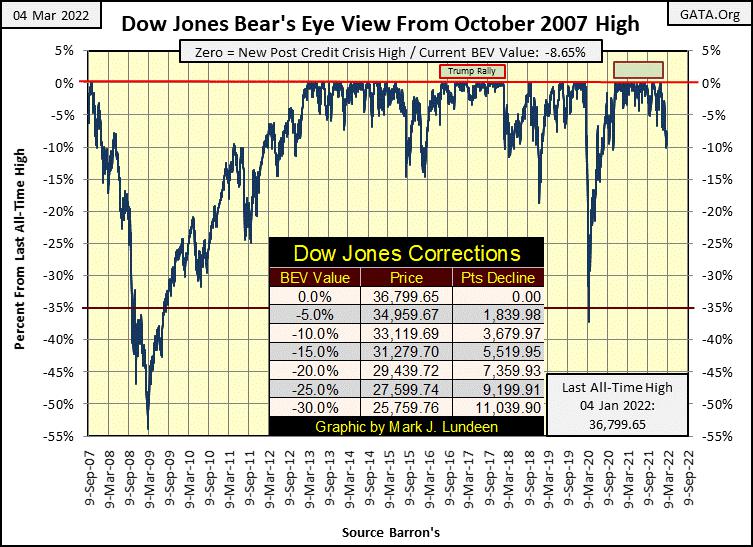
Here’s my table for the major market indexes’ BEV values. The Dow Jones Utility Average made a BEV Zero on this week’s close, its first since December 31st. With no other index within scoring position (within 5% of its last all-time high), for the utilities it’s looking very lonely at the top!
The Dow Jones is #6 in the table, and so far, has performed much better than the other indexes; meaning it has yet to see a double-digit BEV value. But most of the other major market indexes have on a regular basis. The NASDAQ Industrials (#19) closed the week below its BEV -20% line. This index made its last all-time high (BEV Zero) on November 19th. Three and a half months later, its valuation is down by 21%, with more deflation in its valuation expected to follow.
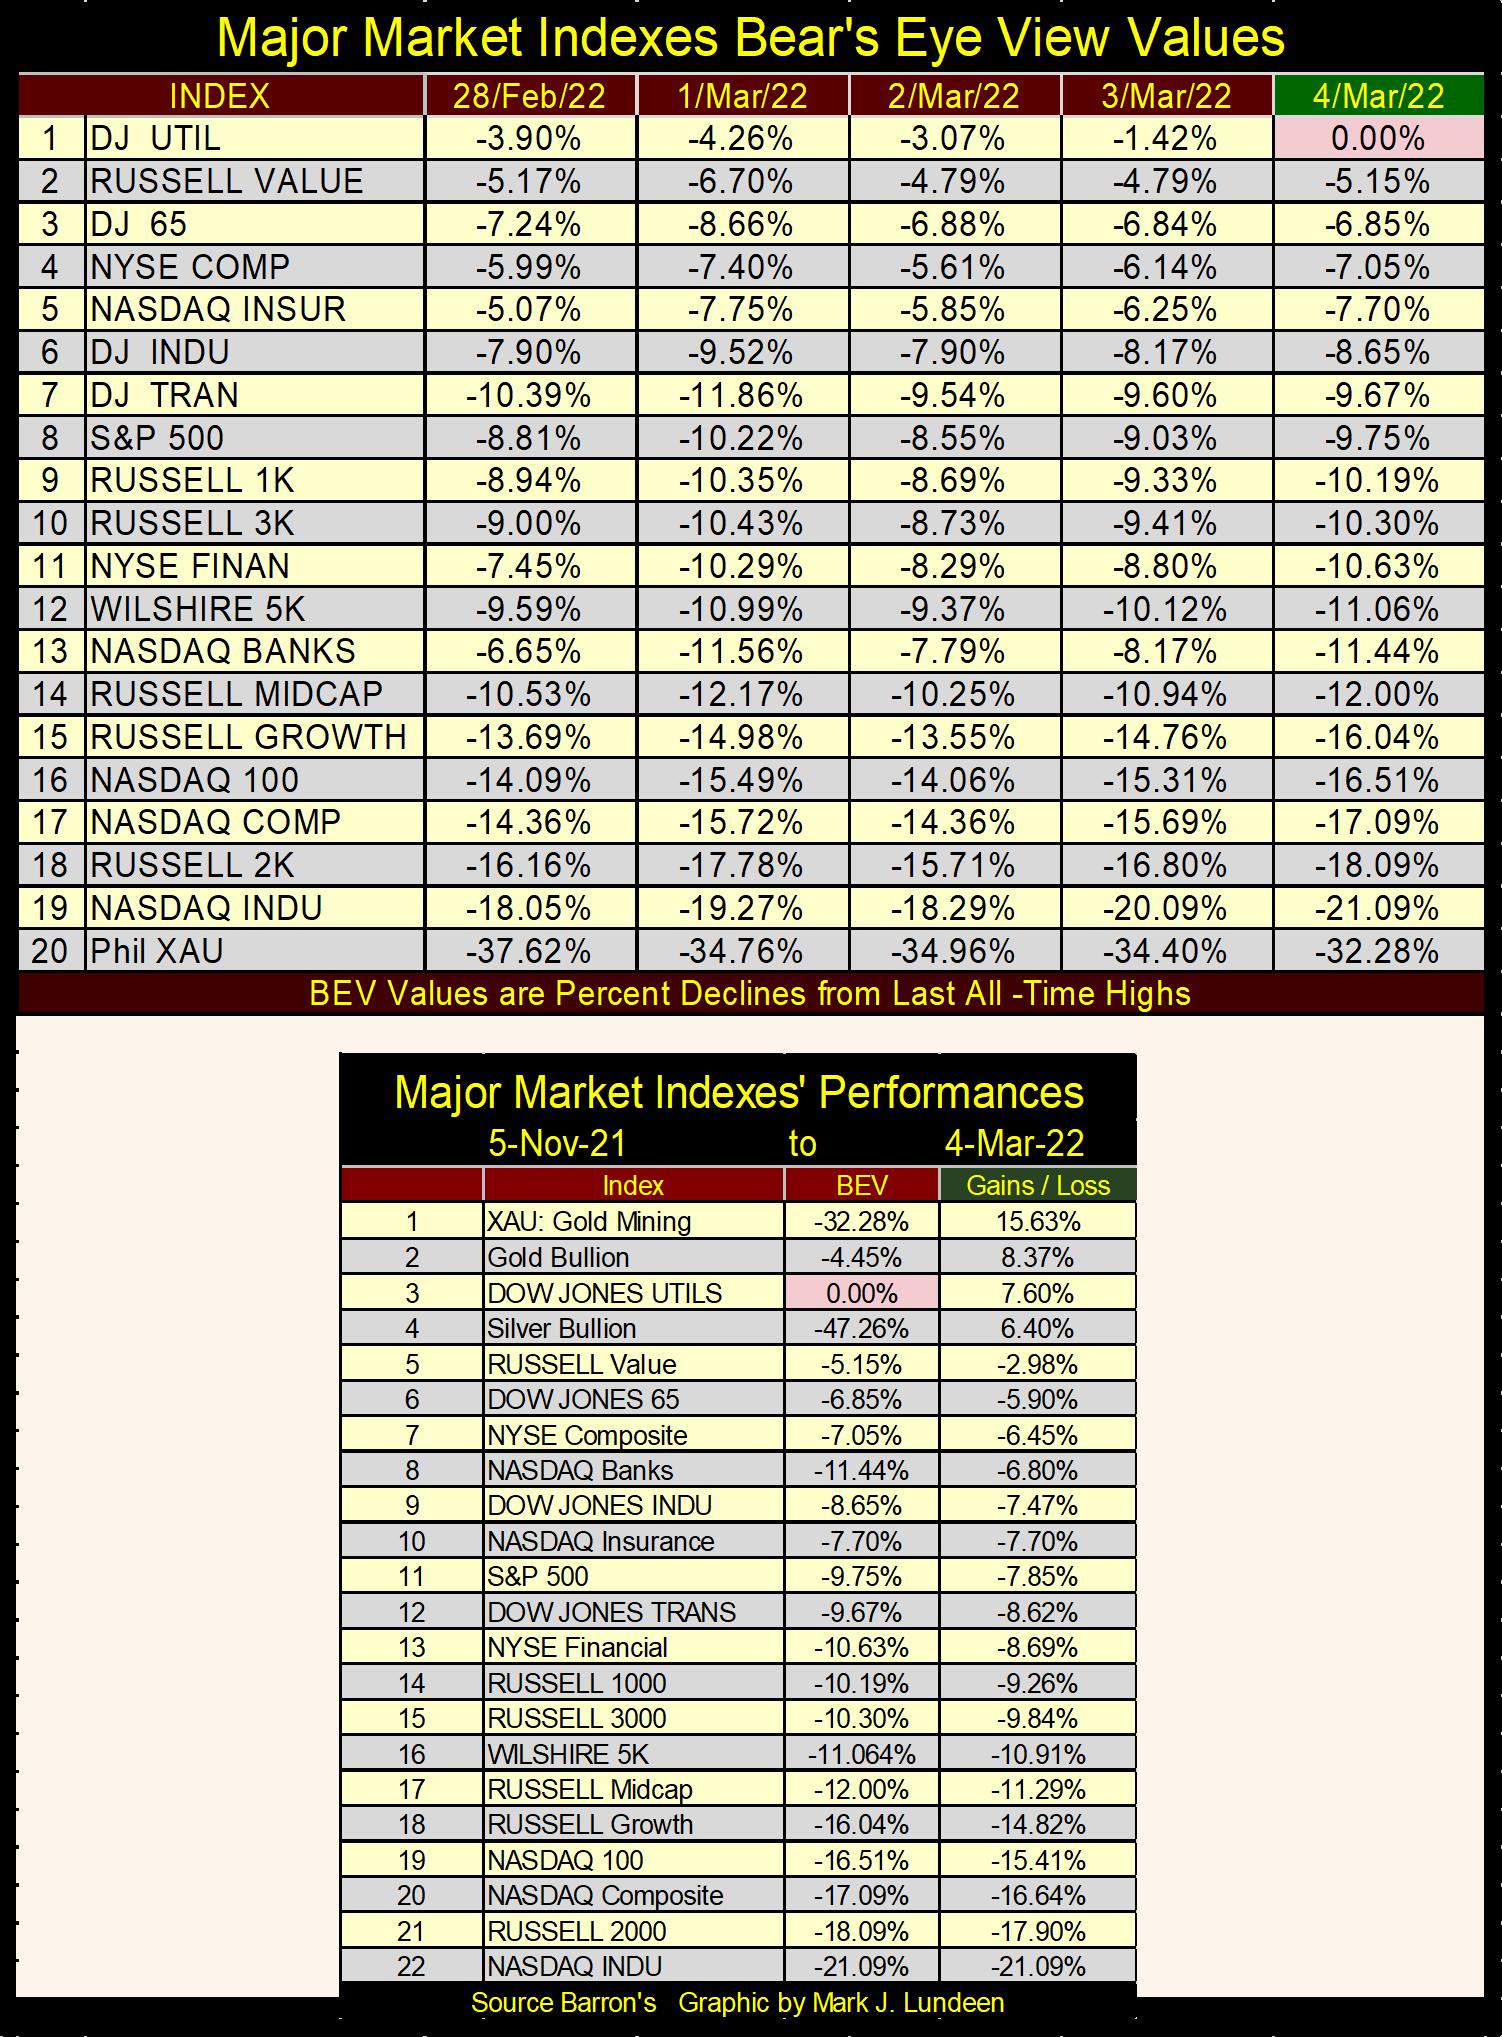
Looking at the performance for these major market indexes above, since November 5th, unless its gold and silver related (DJ Utilities too), these indexes have been money losers. What is with the XAU? Its up 15.63% from early November, as gold is up 8.37% and silver up 6.40%. Not shown in the table above, Barron’s Gold Mining Index (BGMI) is up 21.1% since early last November.
One of the factors making me very concerned about the stock market is how well precious metals investments are currently doing. In the past, seeing the stock market underperform resulted in even more underperformance in gold and silver. However, as seen above, that is no longer so.
We may have begun a new paradigm, where deflating valuations in stocks and bonds, results in inflating valuations in precious metal assets. That is how big-bull markets in gold and silver operate; their rising valuations are fueled by flight capital fleeing deflation on Wall Street. Something I believe is on display in the tables above.
Let’s look at the Dow Jones in daily bars below, along with a chart of this same data series from my 02 April 2020 article, which included the March 2020 flash crash.
Daily volatility is a huge factor in both bull and bear markets. In bull markets, the Dow Jones advances in tiny baby steps as the market advances from one new all-time high to the next. Yes, there can be Dow Jones’ 2% days in bull markets, but they are transitory market events that may not be repeated for many months, or even years. It’s been this way since the Dow Jones first traded in 1885.
Market declines behave the exact opposite, with daily volatility for both advancing and declining days increasing noticeably above the daily volatility seen during the previous bull market.
I’m no longer short-term bullish on the stock market. When I was in January and February, I was waiting for a few days-of-extreme volatility, or Dow Jones 2% days before I became bearish. Until last Friday’s Dow Jones 2% day, where the Dow Jones closed up 2.51% above Thursday’s close, we haven’t seen a day-of-extreme volatility since July 19th of last summer; a -2.09% day.
This is rather meager fare to become bearish. But I just don’t like the way the Dow Jones is trading, as seen in the chart below (two charts below), with a series of declining tops and bottoms since last December.
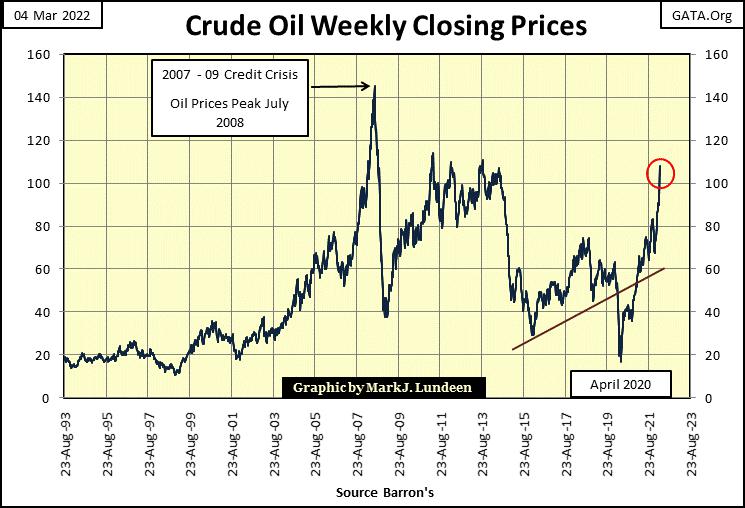
Seeing bond yields rising, as well as commodity prices increasing at double-digit percentages since last November aren’t helping the stock market. Crude oil this week was trading over $100 a barrel. Like all markets, crude oil will see corrections in this market advance. But I’m expecting a new all-time high, and then some, before this advance in crude oil is over. Rising energy prices alone could instigate a selling panic in the stock market.
And then there are the problems with a shooting war between Ukraine and Russia. The list noting the bearish factors for the stock market is longer than that. Ships that can’t unload their cargo. The supply chain from producers to consumers are in a state of disorder. Since the deep state stole the election from President Trump, and gifted the presidency to bumbling Joe Biden, what in our world has gone right?
As I understand the market, I’m now waiting for a moment of crisis, a day where everything will change, undeniably for the worst, as investors and money managers come to understand they have stayed at the party too long.
When will this day happen? I don’t know. Maybe not until 2023. But this market and economy has been manipulated by the idiot savants at the FOMC for too many decades, for its price structure to return to its natural equilibrium in an orderly manner. As far as the eye can see, prices have been inflated far above where they should be; real estate, financial assets, and salaries for Wall Street and their worthless government market regulating bureaucrats. The coming correction of inflated market valuations will prove to be brutal.
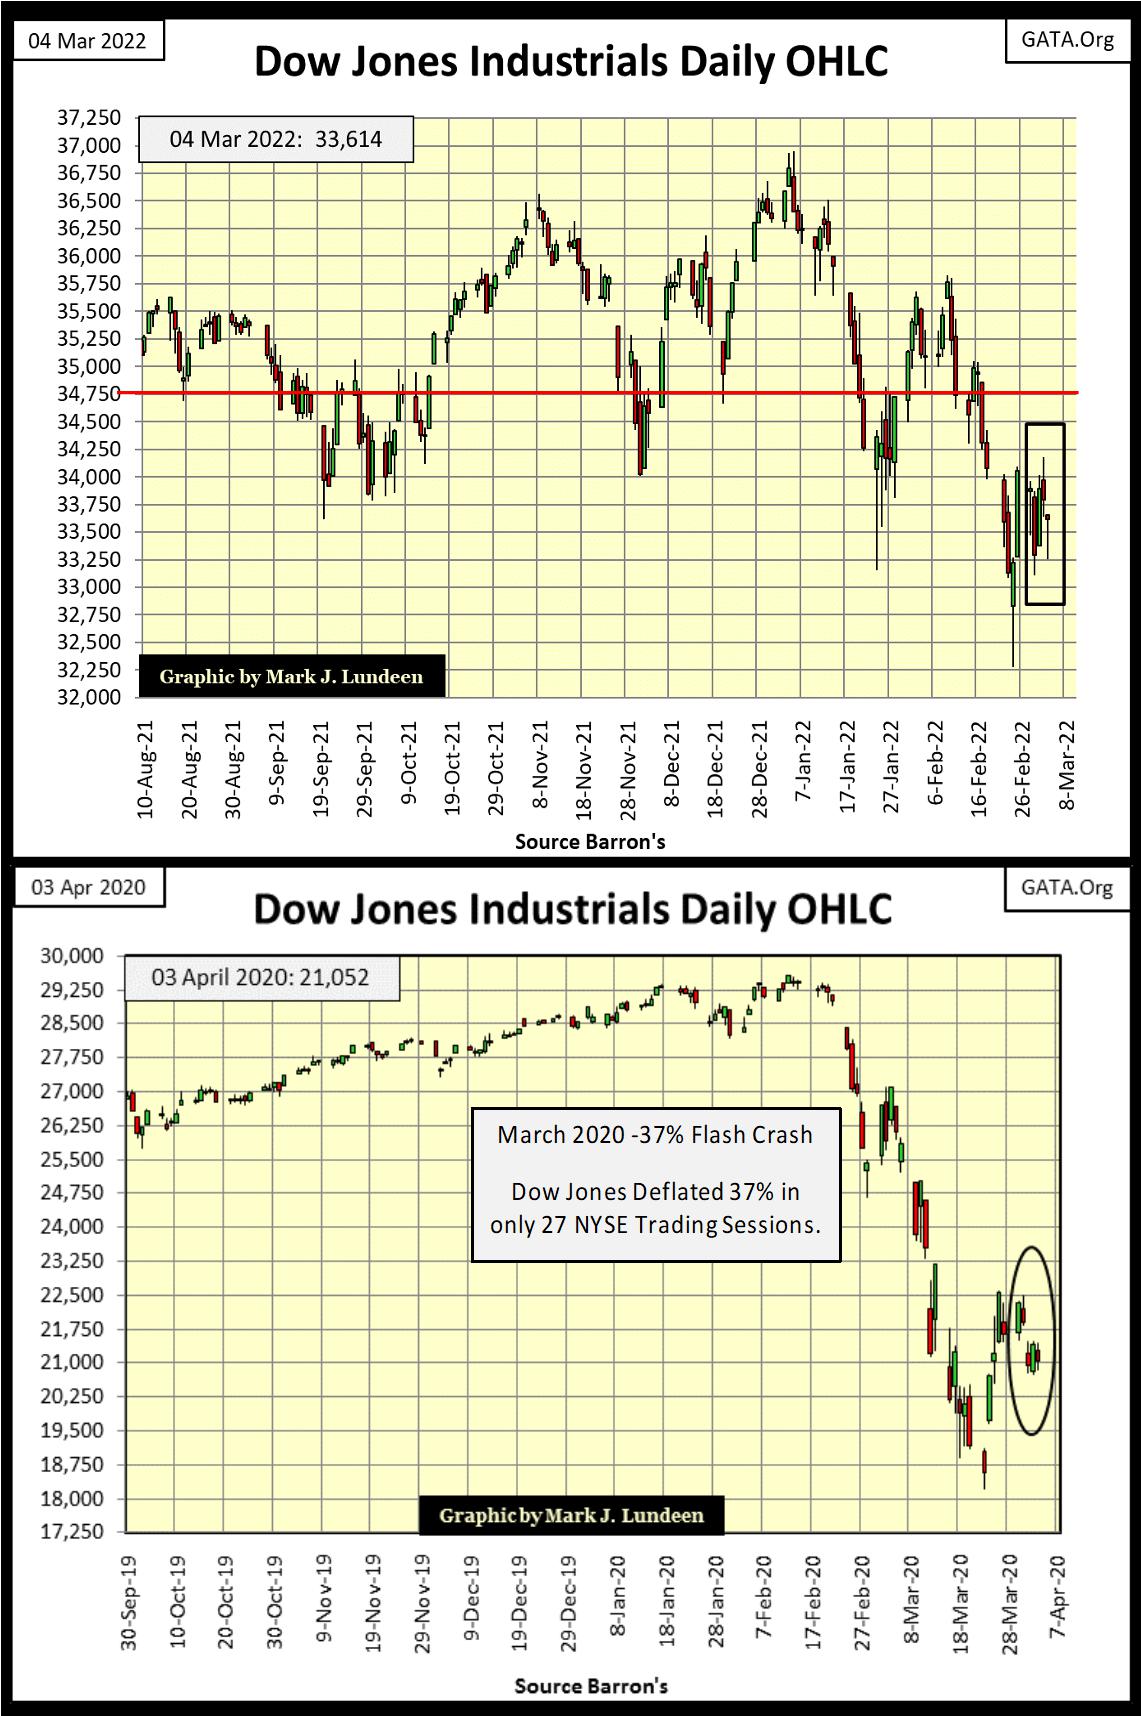
Let’s take a moment to study the daily bars for the Dow Jones from September 2019 to April 2020 above. At first glance, from 30 September 2019 to 12 February 2020, this chart doesn’t look all that bullish. Just a series of tiny ups and downs in the Dow Jones (my proxy for the broad stock market). But in fact, during this time there were twenty-five new all-time highs for the Dow Jones. Two years ago in February 2020, the bulls weren’t complaining about the poor market action. As bull markets go, this is about as good as it gets.
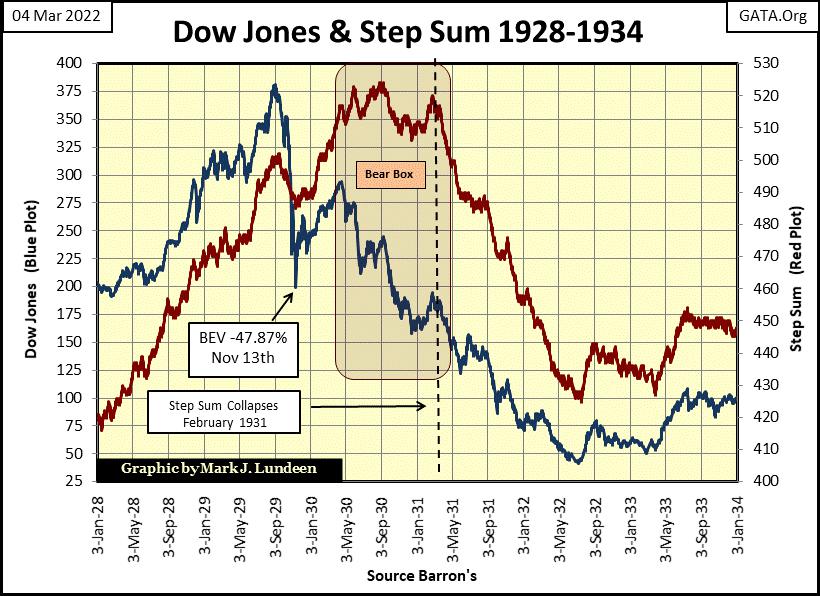
Then came February 13th, 2020, and in the next twenty-seven NYSE trading sessions, the Dow Jones deflated by 37% from its last all-time high of February 12th. In the chart above, we’re looking at the most explosive deflationary event in Dow Jones history – ever. During the Great Depression market crash, from it’s last all-time high of 03 September 1929, it took * FORTY - EIGHT NYSE Trading Sessions (October 29th) * before the Dow Jones deflated by 37%.
Of course, in 1929 the Dow Jones would continue going down until it made its first significant market bottom in the Great Depression Crash, deflating 47.87% on November 13th.
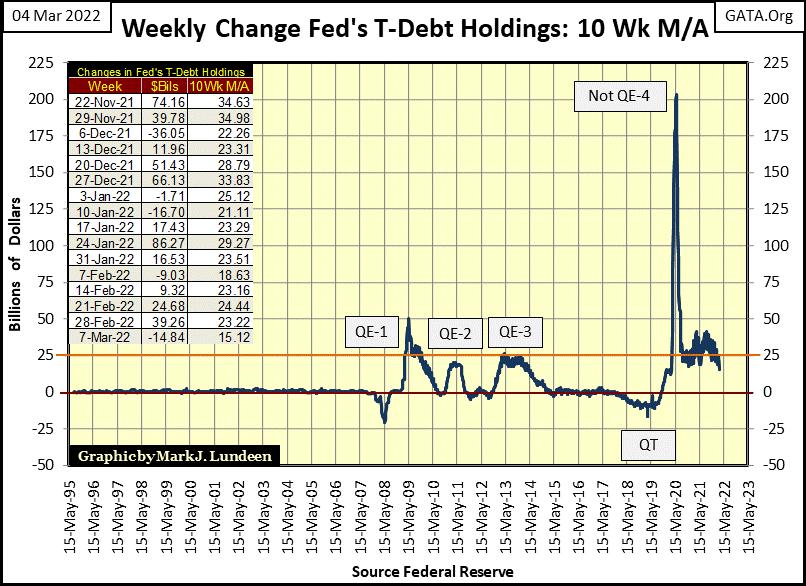
That didn’t happen in March 2020, as the idiots at the FOMC decided the Dow Jones would not be allowed to deflate by 40% from its last all-time high. To implement this “policy decision” they flooded the financial system with a tsunami of inflationary dollars with their Not QE#4 below. In doing so, they fixed nothing. Rather, they compounded the markets’ over valuation problem, which have been festering since Alan Greenspan became Chairman at the Federal Reserve in August 1987.
If I were to attempt to describe the ultimate consequences from the FOMC’s reaction to market declines since the sub-prime mortgage debacle (October 2008), I couldn’t put it better than what the prophet Hosea said long ago about the Kings of ancient Israel. Who, as when our “policy makers” today went wrong, they too insisted on staying wrong.
The problem of course is, that we shall all reap the coming whirlwind, to some degree or another. For myself, I’m for avoiding as much of the coming troubles and tribulations as possible. As I see it. The best way to do that is with the old monetary metals; gold and silver bullion, as well as with holding shares of the mining companies that mine them.
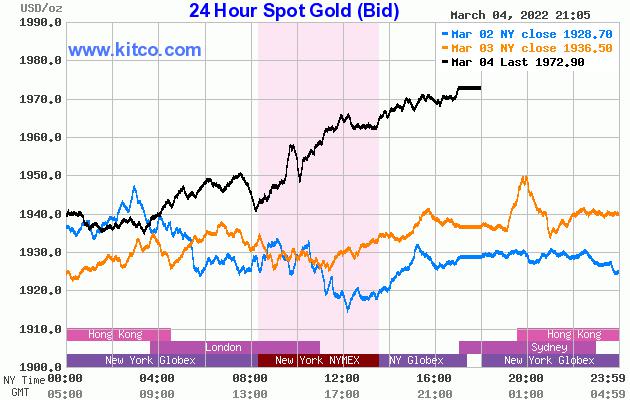
Here is a chart for gold, courtesy the good people at Kitco.com. Gold has closed above $1900 since February 28th. Since then, it appears gold is in a rush to trade above $2000. Count on the COMEX goons to do everything they can to put a stop to that. But clearly gold is headed up, and I believe this is due to flight capital fleeing deflation on Wall Street, entering the precious-metal markets as a safe harbor from the coming storm.
If I’m correct, that the new money flowing into the gold market is actually flight capital fleeing deflation on Wall Street, the COMEX goons will prove to be inadequate in stopping this advance. Oh, the goons will still have their good days. But over time, the price of gold, silver and their miners’ share prices have only one way to go for the balance of 2022 – UP.
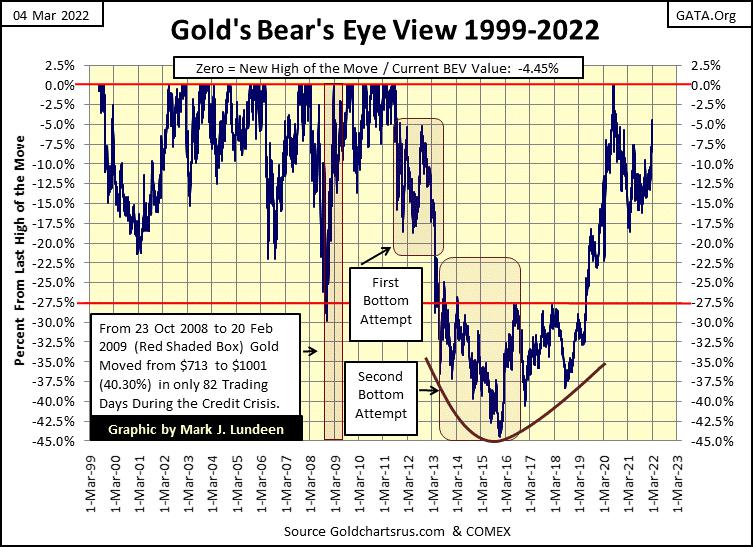
Here is a pretty chart; gold’s BEV chart below. This week closed with gold in scoring position; less than 5% away from its last all-time high. Last time gold did that was on 15 September 2020.
I keep looking at gold’s post August 2011 correction below. It was a mighty eleven-year struggle between the bulls and bears in the gold market. But looking where gold closed this week; less than 5% away from its last new all-time high, I believe even the bears know they have lost this battle.
No guarantees my opinions on the market will become market reality any time soon, but with gold now in scoring position, it could easily exceed the current all-time high gold price ($2061.44) in the next few weeks, or even by next week. To advance to a new all-time high from this week’s close, gold has to advance only $91.68. Since February 1st, gold has advanced $171.35, so I don’t see a problem here.
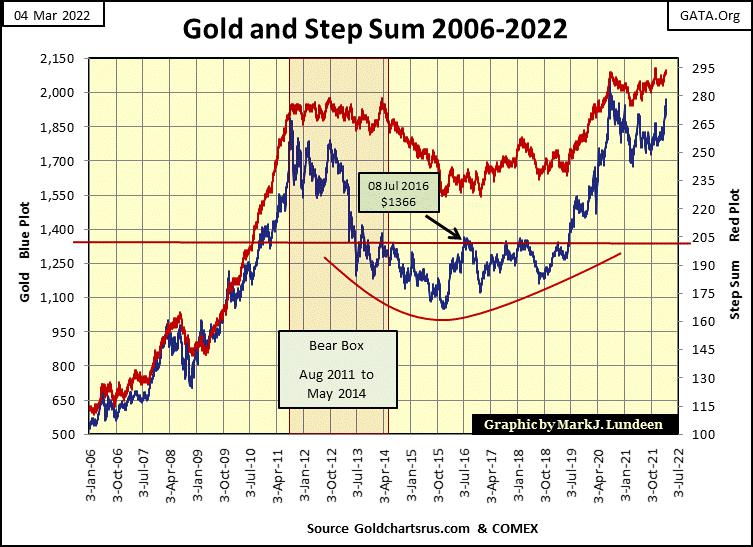
Moving on to gold’s step sum chart below, both gold’s step sum and price plots are gaining speed to the upside, and apparently are ready to break out into market history. I’m all for that!
If the idiot savants at the FOMC can’t stop the current deflationary trend in the stock market, a market event that looks to me is feeding the precious metals market with flight capital fleeing deflation on Wall Street, we may all be amazed where the prices of gold, silver and the mining shares may be come this summer.
The reason for this is, precious metals assets are no more than a tiny barnacle on the side of the huge whale we call the market. It doesn’t take much flight capital fleeing the whale, and attempting to enter the tiny barnacle on its side before everyone knows something has changed. Gold, silver and their mining shares’ valuations could become the stuff of legend before the pending bear market on Wall Street comes to rest on its ultimate bottom.
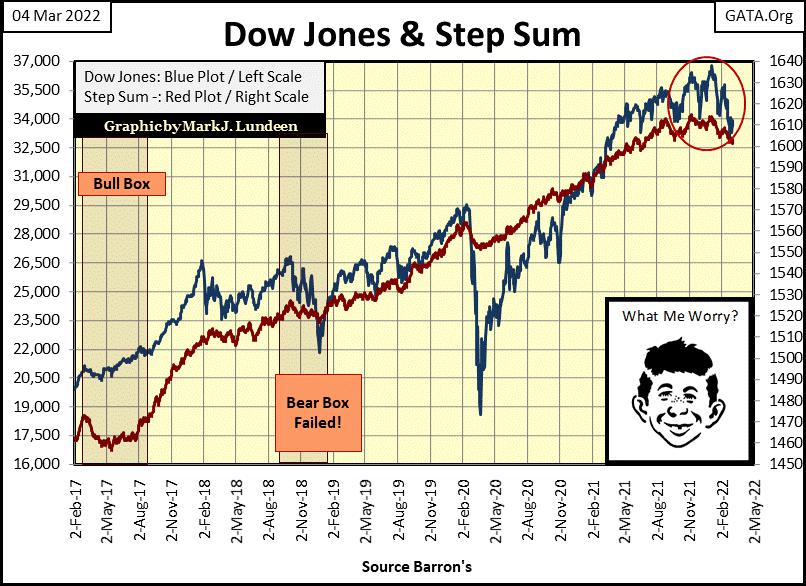
The step sum chart for the Dow Jones below is looking very heavy. Market gravity is pulling both plots down, ever closer to their breaking points. Old Alfred may not be worried. But I am.
Actually, I’m not as I’m out of this market. I’m sitting high above in the market’s peanut gallery, guzzling beer and gorging on hotdogs, as the bulls and bears slug it out far below.
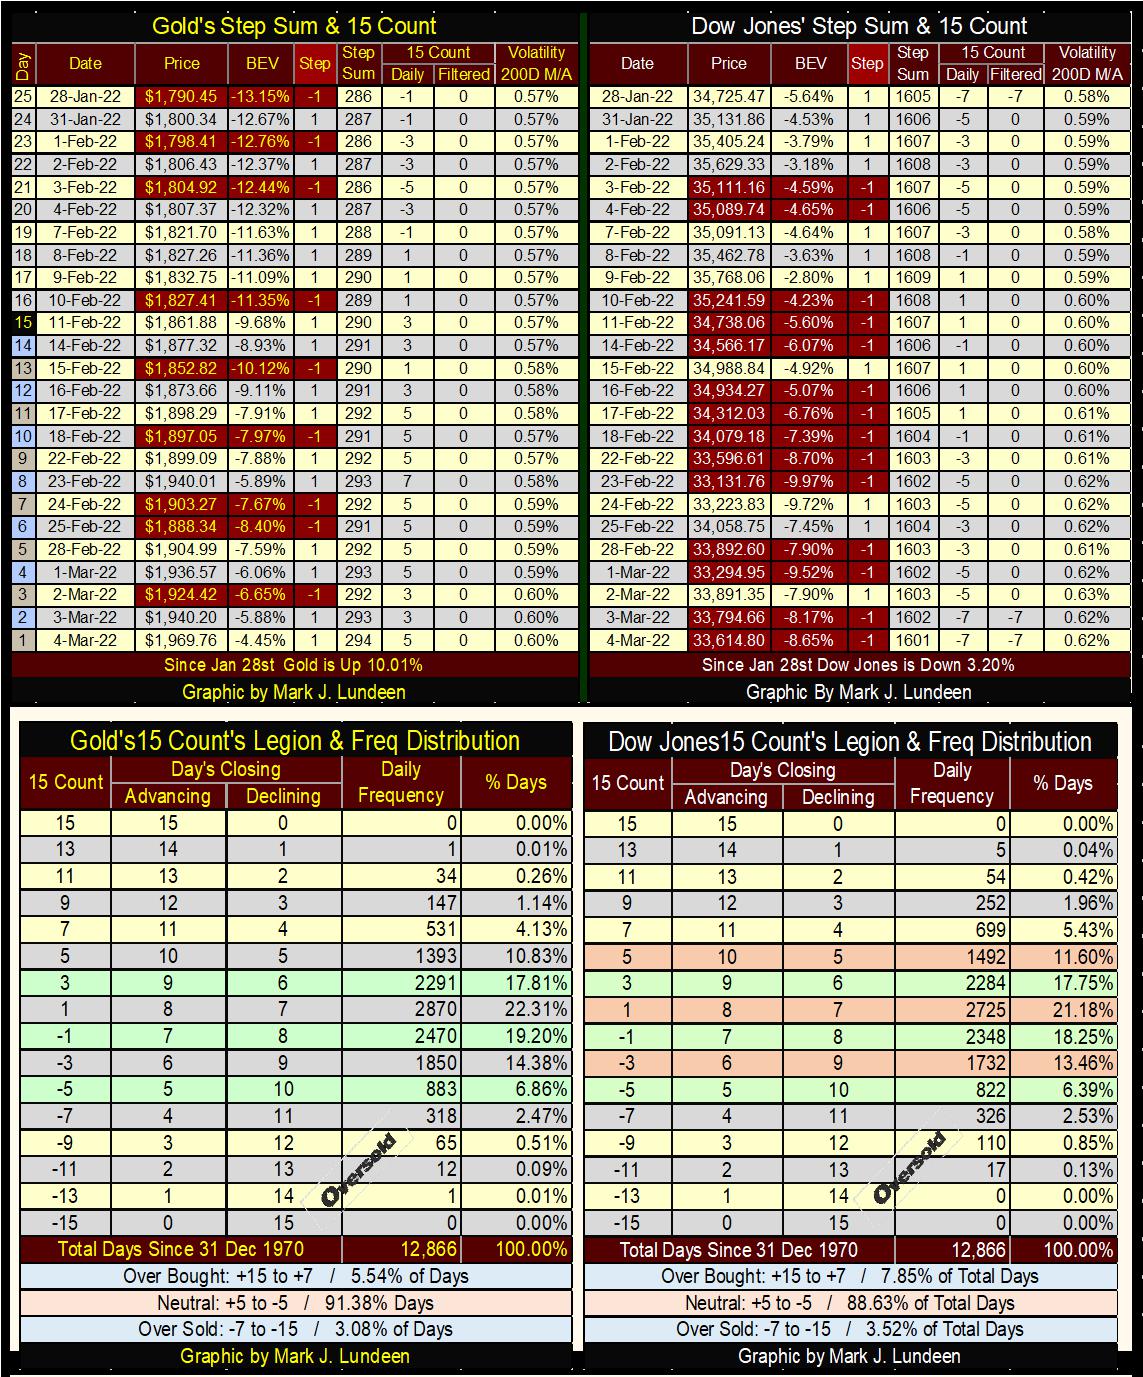
Some odd market action to note in gold’s, as well as with the Dow Jones’ step sum tables below.
Gold became over bought when its 15-count hit a +7 on February 23rd. An overbought market is a market due for a pull back. But gold’s pull back since February 23rd was very meager. It went from $1940 to $1888 two days later, and hasn’t closed below $1900 since.
In fact, gold closed on Friday at a whopping $1969, as it worked off that overbought market condition, ending the week with a neutral 15-count of +5. Gold’s daily volatility’s 200-day M/A has also increased to 0.60%. That’s a big positive, as precious metals bull markets are volatile markets. And look at gold’s step sum itself. It has increased from 286 on January 28th, to 294 at this Friday’s close.
As I see this, I’d say that the bull market for gold and silver are coming along nicely.
As for the Dow Jones side of the step sum table below, the Dow Jones is having some difficulties. No longer seen, but the Dow Jones’ 15-count on January 26th hit a very oversold -9. The Dow Jones doesn’t like being very oversold, and so it tends to see a nice bounce when its 15-count sees a -9. But since January 26th, where is the bounce?
And now the Dow Jones 15-count saw an oversold -7 this week on Thursday, March 3rd. Normally I’d be expecting a nice bounce off of this -7. But just looking at the Dow Jones step sum table below, from January 28th to this week’s close, the Dow Jones is down 1,111 points. This lackluster market action is a prelude to something, and I don’t believe it will be something the bulls are going to enjoy.
That’s it for this week. I’ll have more to say a week from now.
Mark J. Lundeen
********


