Dow Schmao; Gold, Hast Thou?


The next person that says "The Dow [aka that Index at which our parents look] went up 1000 points in seven days!" is going to get (to quote Catherine Deneuve from "The April Fools", 1969) "a sock in the eye!"
Let's put this one to bed straight away. 'Twas all the rage last Wednesday about a seven-day, 1000-point increase for "The Dow". First, on a closing basis, the seven-trading-day rise was 820 points, not 1000. Second, such rise was 3.241%. Third, of the 4289 trading days thus far in this millennium, "The Dow" has closed at least 3.241% higher than 'twas seven trading days earlier on 342 of those days. That's nearly once in every ten trading days. End of story.
"Hang on, mmb, what about for Gold?"
Squire, since you ask, comparably speaking for those same 4289 millennium-to-date trading days, gold has closed higher by at least that same 3.241% from where 'twas seven days earlier 573 times. Moreover, since 01 January 2001, gold-to-date is presently +386%, yet "The Dow" is but +144%. "What's been in your wallet?"
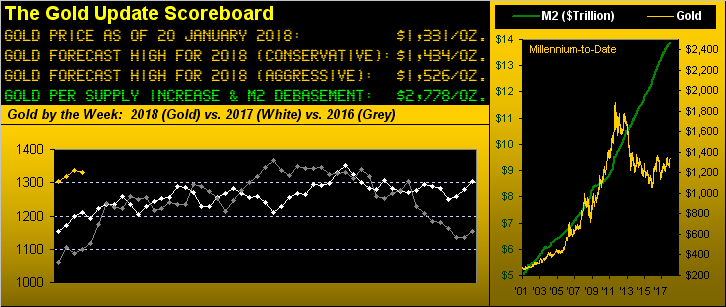
Or better asked, "What ought be in your wallet?" Using current prices divided by "trailing 12-month earnings", the average P/E ratio of "The Dow" 30 stocks is presently 29.3x, (i.e. double what we were taught is "overbought"). Meanwhile, despite gold's tonnage having doubled since 1980, our currency debasement has been so rampant that we presently "score" gold at 2778 as opposed to its actually having settled yesterday (Friday) at only 1331. Yes, you regular readers already know all that, but upon inevitable revertings to means we'll then all say "See?"
As for what we currently "see" in turning to gold's weekly bars is the recording of a fifth consecutive "higher-high", despite price having posted a wee net loss for this past week. Would it nonetheless be rare to lock in a sixth straight "higher-high" week? 'Tis happened on 17 mutually-exclusive occasions since 2001, but only thrice since gold's All-Time High of 1923 on 06 September 2011, (the most recent occurrence being a seven-week stint from 30 December 2016 through 10 February 2017). Rare perhaps, but rather let's focus on price. As annoying as 'twas having to deal ad infinitum with The Box (1280-1240) and its overhanging Whiny 1290s, that whole area ought now act as major technical support for the foreseeable future. Gold presently at 1331, the contest is to re-test the highs of the last two years: 1362 (in 2017) and then the more venerable Base Camp 1377 (in 2016, and following gold's retreat from its All-Time High, the key support shelf through much of 2013 before then turning to resistance and it all going wrong, price reaching to as low as 1045 on 03 December 2015). And to quote from our 2017 year-end missive: "...As price closes in on 1377, 'twouldn't surprise us a wit see a zillion buy stops hit the market just in or above there. That in turn ought open the top fuel dragstrip for the nitro-burning drive back above 1400, the finish line being a retest of 1434 for the year's high..." And now, we're not really that far away, eh?

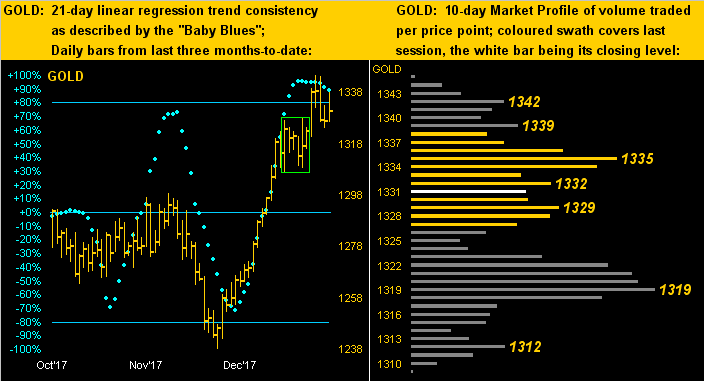
Nearer-term, let's turn to gold's daily bars (below left) from three months ago-to-date. From the panel's low (1238 on 12 December) to its high (1345 this past Tuesday, 16 January) marks a fairly stout +8.6% run across those 26 trading days. The baby blue dots depicting the day-by-day consistency of gold's 21-day linear regression trend remain well above their +80% level: breaching that to the downside becomes a trader's signal to anticipate lower levels; however structurally, the green box of "price bunching" suggests gold is safe should it slip into the low 1300s. In the 10-day Market Profile (below right) we more starkly see the dominant 1319 apex as key short-term trading support:
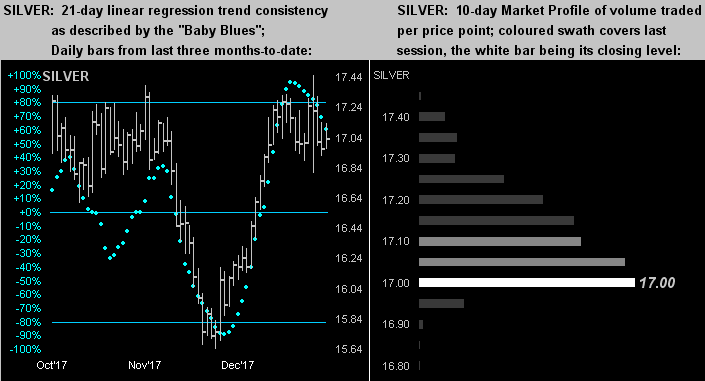
In viewing the same two panels for Silver, she appears a bit more feeble. To be sure, her run (below left) across those same 26 days of +11.6% rightly surpassed that for Gold. But her "Baby Blues" already have slipped below the +80% level, and she doesn't have that same nearby "price bunching" support as we above showed for Gold, (although the leftmost side of Silver's daily bars panel therein suggests quite a supportive pricing nest). As for her 10-day Market Profile (below right), in settling out the week at 17.025, Sister Silver is sitting upon her sole trading apex at "Seventeen, you're just seventeen..."--(Foreigner, '79):
Now in just a week-and-a-half's time we've Chair Yellen's farewell fling in fronting the Federal Open Market Committee. And fortunately for her she shan't have to formally face the media (post-policy statement on 31 January). But will the FOMC face up to the fact that the Economic Barometer is of late waning away? Blind euphoria over "The Dow" et al has swept across the nation, indeed 'round the world. From Europe to China, econ data is a-poppin' ... but recently StateSide, 'tis a-floppin'. For example: what inflation, eh? Not only did December's CPI eke out a gain of just +0.1%, but the PPI actually went backward by -0.1%. The latest readings (November) for both Wholesale and Business Inventories ballooned rather than moved. December Retail Sales slowed, as did Housing Starts. January readings slowed in both the New York State Empire and Philadelphia Fed Indexes. The just-released University of Michigan Sentiment Survey fell to its lowest level since July of last year. And despite Consumer Credit being on the increase, Standard and Poor's reported this past week that bank card default rates for December were the most since March 2017. Can your variable rate debt handle the effect of another FedFunds up nudge? 'Twill be interesting to the see the first read of Q4 GDP next Friday (26 January). Either way, up with stocks, down with data? That pattern never lasts. Here's the Econ Baro:
And specific to the stock market, we really are seeing froth as the moneyflow of the S&P 500 is not keeping the upside pace of the index itself. As pulled from the website, here is the points change of the S&P for the past 21 trading days versus that of its moneyflow (regressed into S&P points such that they can be displayed on the same scale). The lower panel depicts the moneyflow less the S&P. 'Course, that negativity is pure peanuts in the broad consideration that the S&P is trading at double its earnings support:
Oh, and then there's this: the yield-to-maturity on the 10-year U.S. Treasury Note is presently 2.637%. The yield on the S&P 500 is 1.815%. Moreover, with the Note, you know how much dough will be returned to you upon its maturity. With the S&P you know nothing. ('Course, your money manager has it all under control, non?)
For our wrap, here's the stack:
The Gold Stack
Gold's Value per Dollar Debasement, (from our opening "Scoreboard"): 2778
Gold’s All-Time High: 1923 (06 September 2011)
The Gateway to 2000: 1900+
Gold’s All-Time Closing High: 1900 (22 August 2011)
The Final Frontier: 1800-1900
The Northern Front: 1750-1800
On Maneuvers: 1579-1750
The Floor: 1466-1579
Le Sous-sol: Sub-1466
Base Camp: 1377
2018's High: 1345 (16 January)
10-Session directional range: up to 1345 (from 1309) = +36 points or +2.8%
Trading Resistance: 1332 / 1335 / 1339 / 1342
Gold Currently: 1331, (expected daily trading range ["EDTR"]: 13 points)
Trading Support: 1329 / 1319 / 1312
10-Session “volume-weighted” average price magnet: 1327
2018's Low: 1305 (02 January)
Neverland: The Whiny 1290s
The Box: 1280-1240
The 300-Day Moving Average: 1253 and rising
The Weekly Parabolic Price to flip Short: 1243
Finally, this is worth noting. Did anyone notice that from the instant bitcoin debuted on a real, Big League trading exchange - The CME - that one-half of the value has vanished? Don't mess with the Big Dogs. Better to join the Gold Bulldogs!

Mark Mead Baillie has had an extensive business career beginning in banking and financial services for two years with Banque Nationale de Paris to corporate research for three years at Barclays Bank and then for six years as an analyst and corporate lender with Société Générale.
For the last 22 years he has expanded his financial expertise by creating his own financial services company, de Meadville International, which comprehensively follows his BEGOS complex of markets (Bond/Euro/Gold/Oil/S&P) and the trading of the futures therein. He is recognized within the financial community of demonstrating creative technical skills that surpass industry standards toward making highly informed market assessments and his work is featured in Merrill Lynch Wealth Management client presentations. He has adapted such skills into becoming the popular author each week of the prolific “The Gold Update” and is known in the financial website community as “mmb” and “deMeadville”.
Mr. Baillie holds a BS in Business from the University of Southern California and an MBA in Finance from Golden Gate University.


