Elites Set To Wipe Out Shorts Before Next Down-Wave


The recovery rally in the US stock market that we have been expecting for a week or two started on Friday with a robust advance that gathered strength into the close. The trigger was Japan's announcement that it is going into NIRP (Negative Interest Rate Policy) in a big way, which means that as they slip deeper into the abyss of bankruptcy they are going to resort to robbing savers. This is real "endgame stuff" - another milestone on the road to ruin, and it looks like it was the result of the Japanese attendees at Davos being taken to one side and given their "marching orders". The US stockmarket reveled in this news of course, because it means that the Fed's proposed interest rate rises will never happen and instead they will get ready to launch a massive QE blitz, in concert with Central Banks around the world, in a desperate effort to fend off the gathering forces of deflation. The end result of this QE blitz will be hyperinflation and chaos. At some point the penny will drop with investors and there will be a stampede into gold and silver, although latest COTs suggest that this is still some way off.
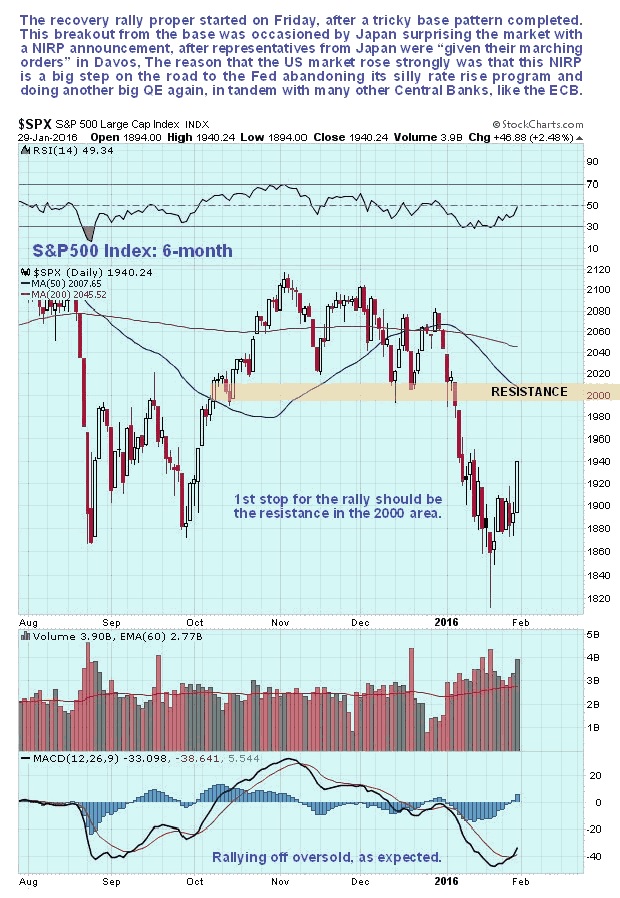
On the 6-month chart for the S&P500 index, we can see how the index finally broke out upside from an intermediate base pattern on Friday, with a big bullish white candle appearing. The large white candle portends a continuation of the rally. First stop should be the resistance shown in the 2000 area, and it may well rise further, as we will see on other charts, with a fairly precise target for the move provided by the chart for the Dow Jones Transports, which we will look at later.
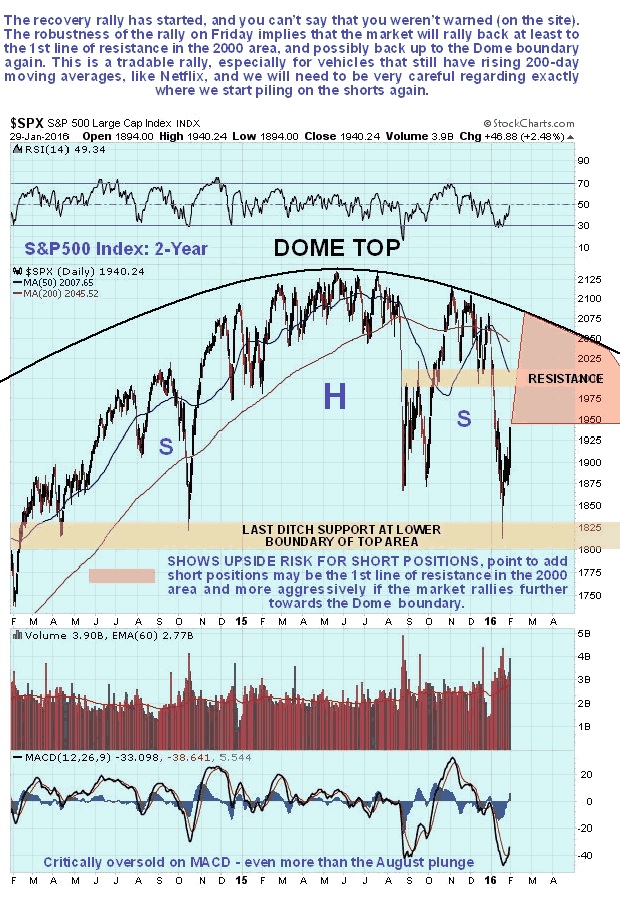
On the 2-year chart for the S&P500 index we can see more clearly how far this countertrend rally is likely to get. The first stop will be the resistance shown in the 2000 area, as pointed out above, but the vigor of Friday's advance suggests that it is quite likely that it will push on higher to the Dome boundary again, as it did after the August plunge. That the market is rallying here should hardly be surprising, given that it had dropped to become extremely oversold on its MACD indicator and at a zone of support at the lower boundary of its large Head-and-Shoulders top.
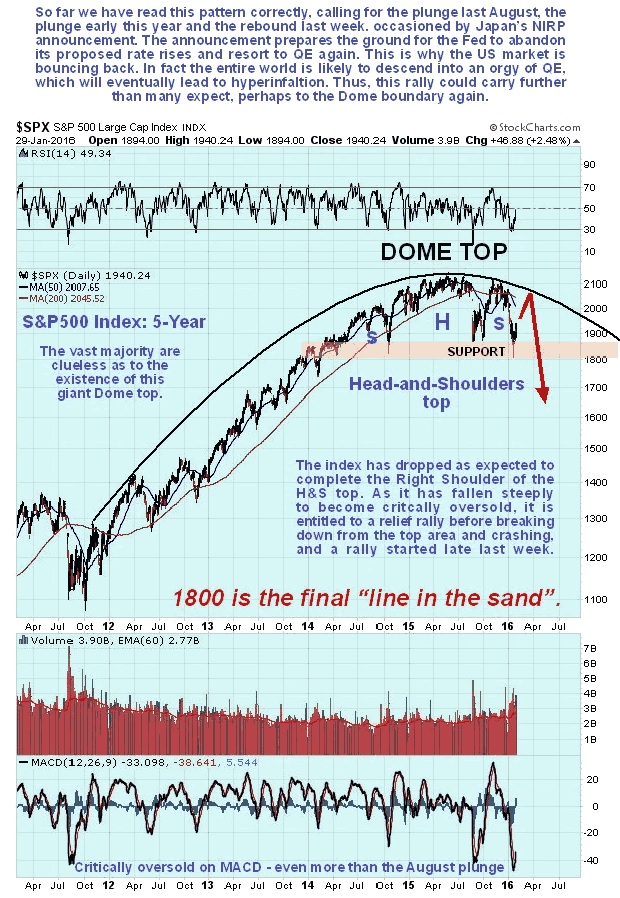
The 5-year chart shows the big picture, and what is likely to happen after the index reaches the Dome boundary again, if it gets that far.
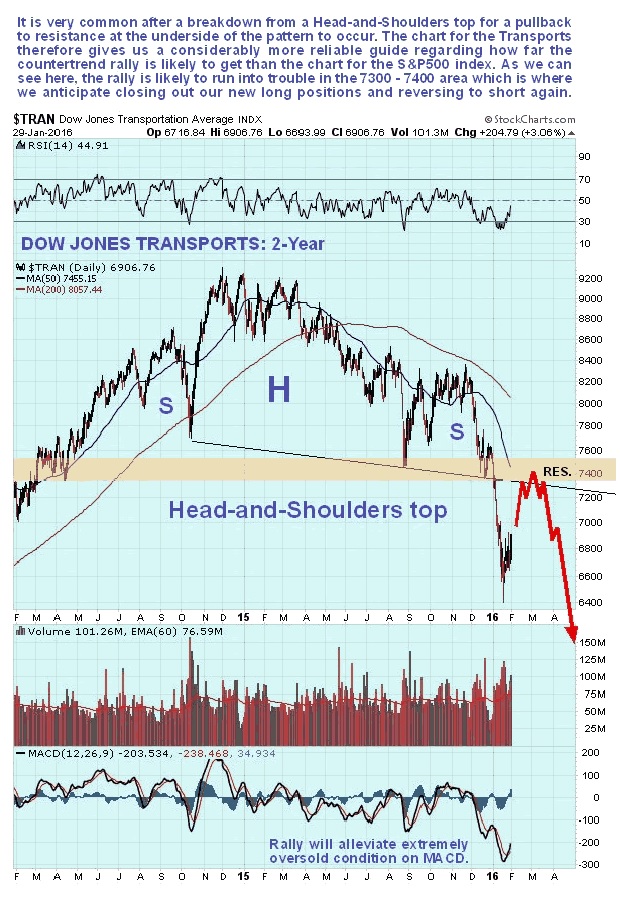
Whilst it is rather tricky to determine how far this countertrend rally will get on the charts for the S&P500 index, happily this is not the case with the chart for the Dow Jones Transports, which provides us with a fairly precise target, as we will now see.
On the 2-year chart for the Transports, we can see that after it broke down from the clear Head-and-Shoulders top right at the start of the month, it plunged to become extremely oversold. Now, it is very common after a breakdown from a Head-and-Shoulders top for a pullback to the neckline of the pattern to occur, before the bearmarket that it portends gets underway in earnest. After the basing action of the past couple of weeks that is what it looks like we are now going to see, in which case the Transports will rally back up to the 7300 - 7400 area in coming weeks, where we will offload our short-term long positions and probably go heavily short. That's the plan - let's see what happens.
Now here are some other indicators that back up our contention that a sizeable countertrend rally has just started.
First we have the latest Odd Lot Short Sales chart, which shows that almost everyone has been piling in on the short side in recent weeks, and since "that many people can't be right" it follows that Big Money will now fleece these shorts by engineering a sizeable short-covering rally. Once they have been wiped out the market will be free to drop again.
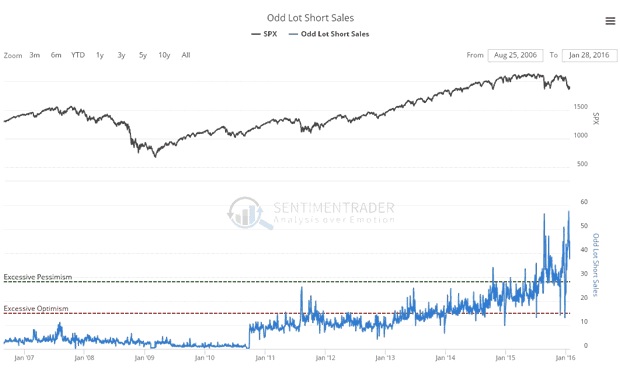
Chart courtesy of www.sentimentrader.com
The extremely low appetite for risk of the past couple of weeks is another indication that the market is ripe for a rally, as we can see on the latest Risk Appetite Index shown below.
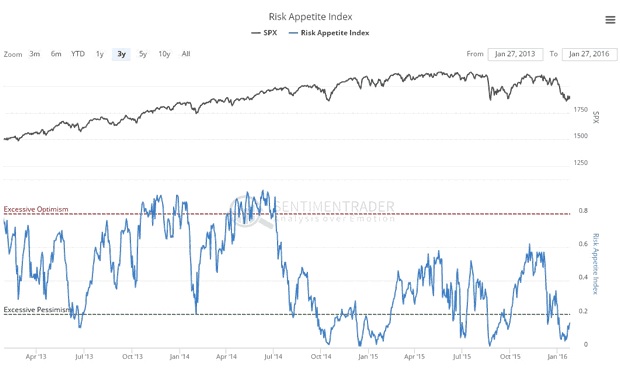
Chart courtesy of www.sentimentrader.com
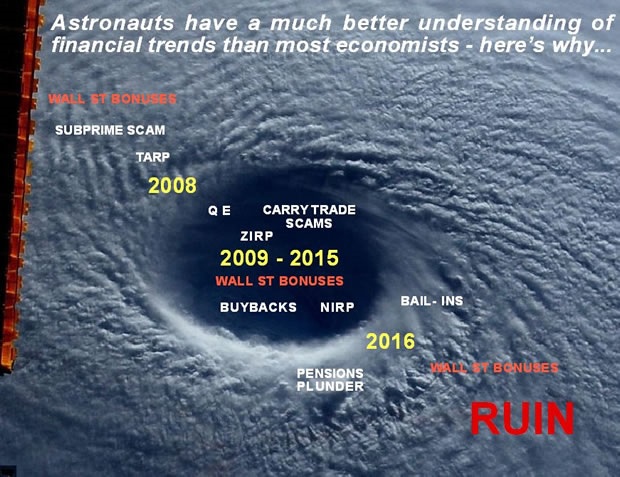
Since 2008 we have been traversing the eye of a gigantic financial hurricane, and you may recall that it was pointed out on the site back in November that the eyewall at the back side of this storm was about to hit, as we can see to advantage on this photo from the International Space Station, and we can also see how NIRP will precede the final acts of desperation of a broken system - bail-ins and the brazen looting of pension funds...
In a separate article we will be looking at some vehicles for making money on the long side during the expected rally in coming weeks, before piling on the shorts again.
********
Courtesy of Courtesy of http://www.clivemaund.com

Clive P. Maund’s interest in markets started when, as an aimless youth searching for direction in his mid-20’s, he inherited some money. Unfortunately it was not enough to live a utopian lifestyle as a playboy or retire very young. Therefore on the advice of his brother, he bought a load of British Petroleum stock, which promptly went up 20% in the space of a few weeks. Clive sold them at the top…which really fired his imagination. The prospect of being able to buy securities and sell them later at a higher price, and make money for doing little or no work was most attractive – and so the quest began, especially as he had been further stoked up by watching from the sidelines with a mixture of fascination and envy as fortunes were made in the roaring gold and silver bull market of the late 70’s.
Clive furthered his education in Technical Analysis or charting by ordering various good books from the US and by applying what he learned at work on an everyday basis. He also obtained the UK Society of Technical Analysts’ Diploma.
The years following 2005 saw the boom phase of the Gold and Silver bull market, until they peaked in late 2011. While there is ongoing debate about whether that was the final high, it is not believed to be because of the continuing global debasement of fiat currency. The bear market since 2011 is viewed as being very similar to the 2-year reaction in the mid-70’s, which was preceded by a powerful advance and was followed by a gigantic parabolic price ramp. Moreover, Precious Metals should come back into their own when the various asset bubbles elsewhere burst, which looks set to happen anytime soon.
Visit Clive at his website: CliveMaund.com


